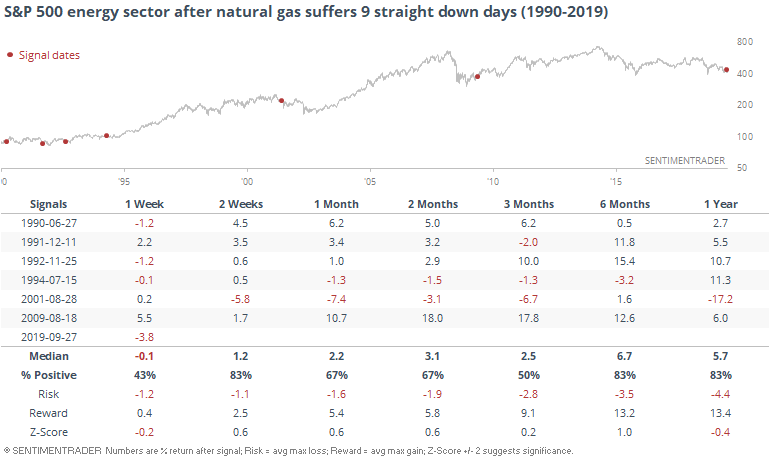
Wednesday Color - Small-cap outflows, financial & energy breadth, natty drop, energy options

Here's what's piquing my interest so far today.
Flow Woes
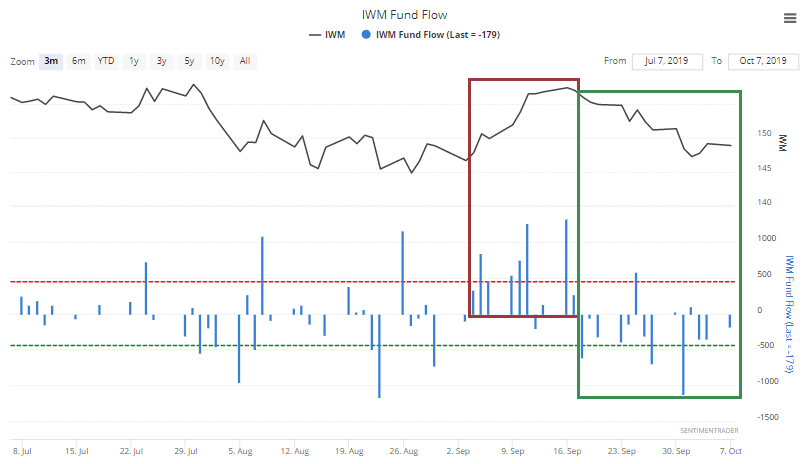
After a couple of weeks of almost uninterrupted inflows to small-caps leading up to the early September peak, ETF traders have turned tail and triggered almost nothing but outflows. Seems like it could happen today, too, with them lagging the market again.
During the past 3 weeks, the IWM fund has enjoyed only 3 days with an inflow, one of its worst stretches in 15 years. Over that time, the fund has bled an average of more than $250 million in assets each day.
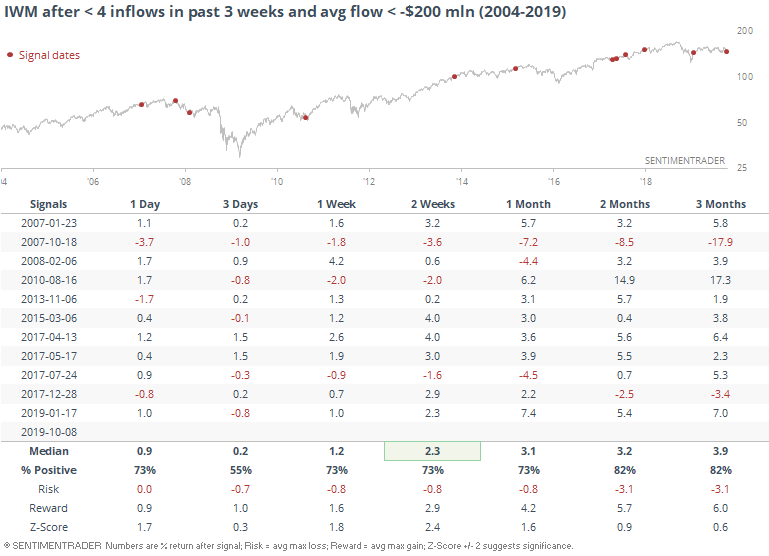
The other times traders left the fund like this, it tended to rebound in the weeks and months ahead.
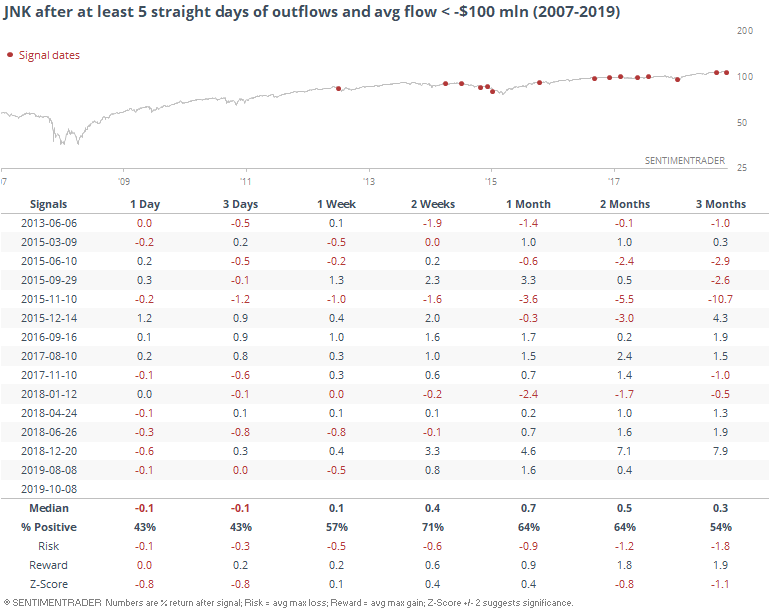
Traders have also been leaving junk bonds in the form of JNK, with more than 5 straight days of outflows, averaging more than $100 million / day. It hasn't been as reliable a buy signal, though.
Sector Breadth
With the selling on Tuesday, there were a few extremes that popped up, but nothing especially noteworthy. Stocks have seen large swings over the past week or so, meaning there hasn't really been an opportunity for some of the metrics to hit true extremes.
Among the few that we should at least note, the selling in financial stocks has been enough that an average of nearly 30% of them have traded below their lower Bollinger Bands during the past week. That's a high level for an environment where XLF is still trading above its rising 200-day average.
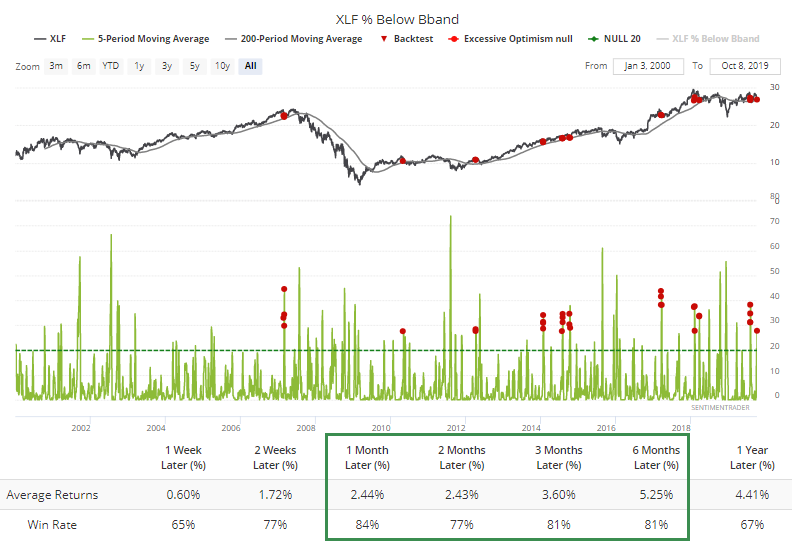
Of the 31 total days where this triggered, XLF traded higher a month later 26 times.
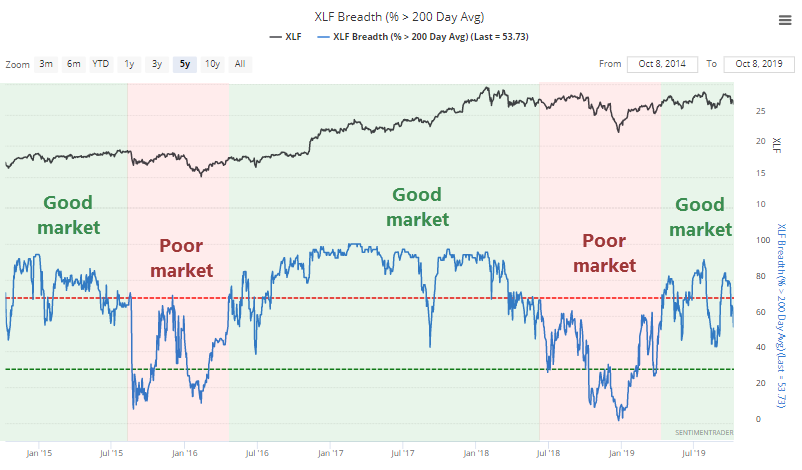
We've often noted that for longer-term metrics like the % of stocks above the 200-day average, during strong markets, the indicator tends to hold above 60%, and forays near or below 40% tend to be buying opportunities. During weak markets, that's flipped. For the past six months or so, the "good market" behavior has mostly held firm, and continues to so far.
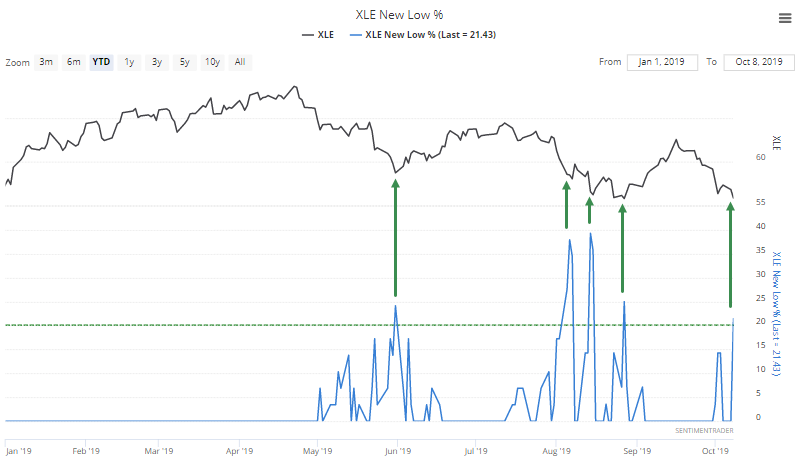
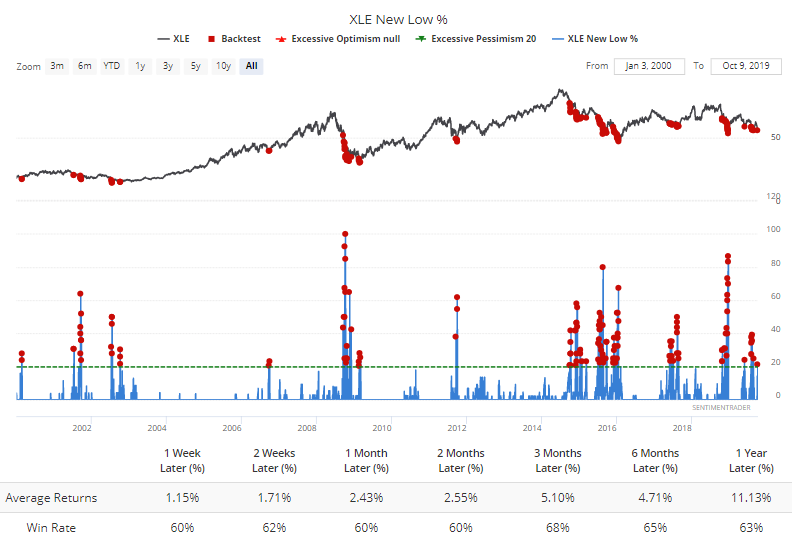
Energy stocks have seen nearly relentless selling, and it's triggering some minor extremes. More than 20% of those stocks hit a 52-week low on Tuesday, among the most in 2019. The other times it spiked above this threshold, XLE at least enjoyed short-term rebounds.
Longer-term, this only triggered during protracted declines (of course), yet forward returns were positive. Not exactly a raging buy signal, but getting there.
Gas Leak
The Journal notes that natural gas has had a record run of negative days. Indeed.
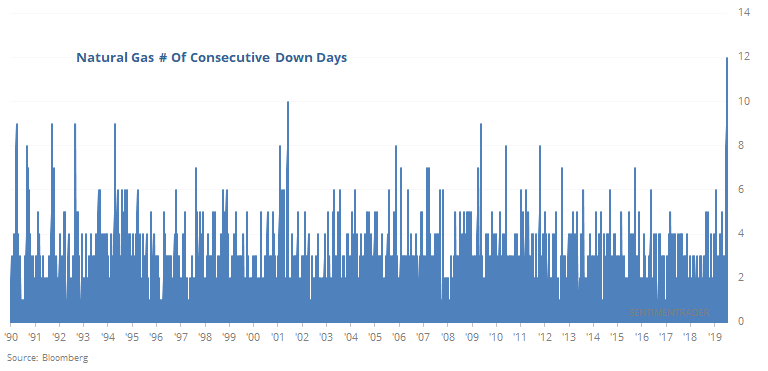
When the streak hits 9 down days in a row, it has not been a consistent sign of exhaustive selling pressure.
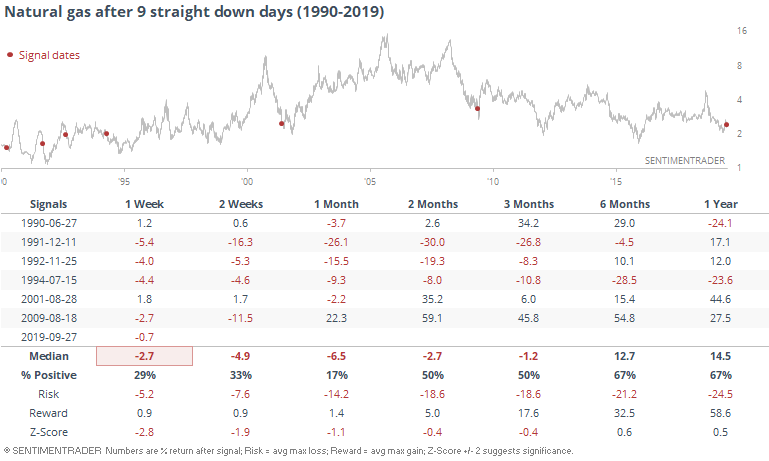
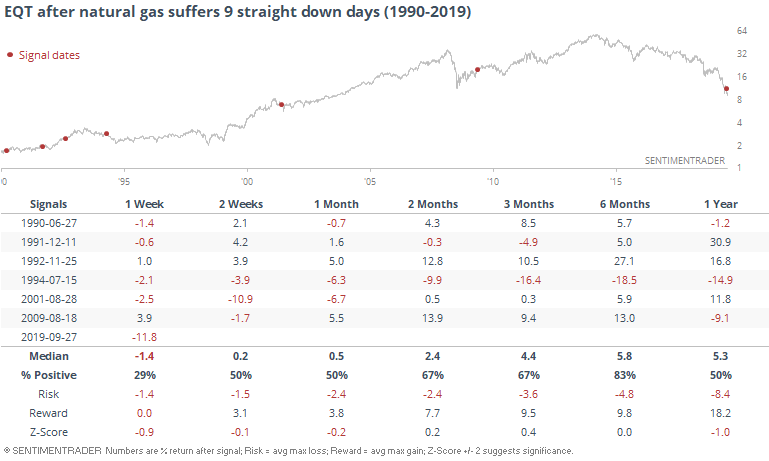
It was a better sign for some of the producers, especially EQT.
Range Resources has less history, and also didn't react as well.
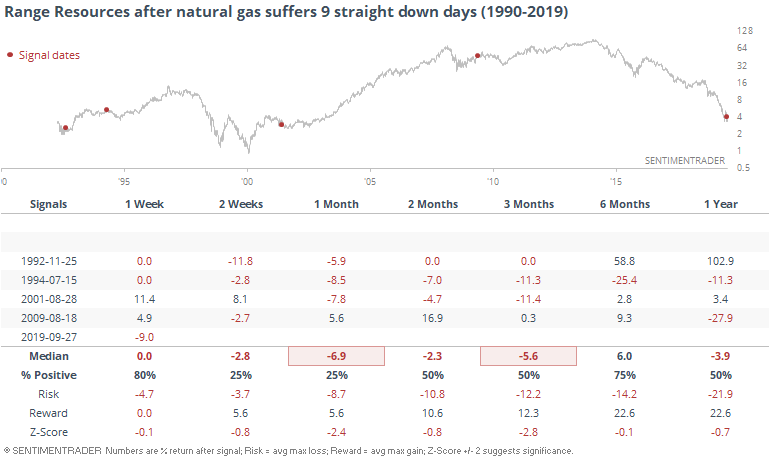
It was a mixed-to-positive sign for energy stocks in general.
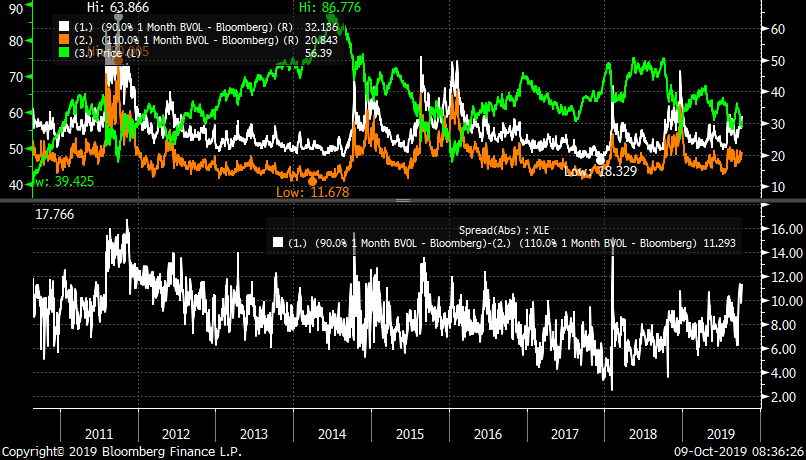
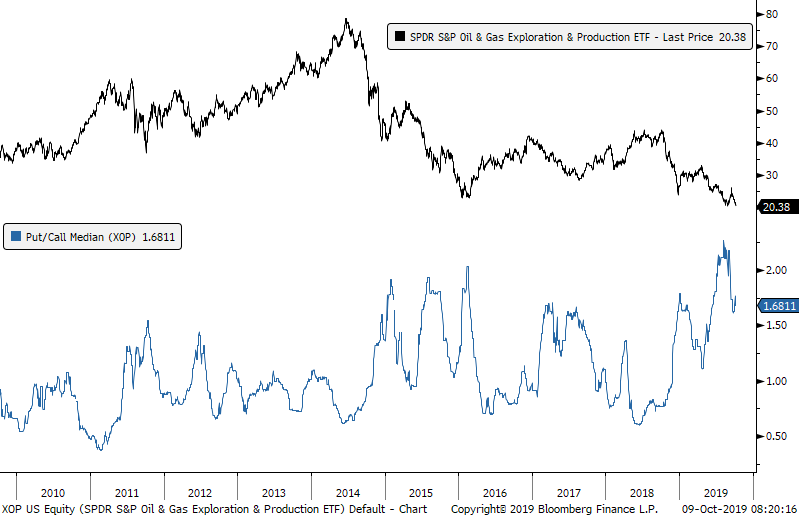
Over the past 50 days, the put premiums being paid on funds like XOP reached a decade-long high relative to call premiums (via Erlanger Research), one hint that sentiment is at or near extreme pessimism.
There is also the first hints of fear being priced into options on XLE. Puts are becoming the most expensive relative to calls since the early summer of 2016.
This is a really ugly chart, but when the skew (in white) becomes high, XLE (in green) has tended to rally.