
Wednesday Color - FOMC Bias, Emerging Recovery, Japan, Fund Flow

Here's what's piquing my interest as markets await the Fed's latest guidance.
Fed Fade
The FOMC chairman will announce their decision on interest rates and present a statement, which will be the obsession of traders this afternoon. For whatever reason, stocks have not reacted all that well on FOMC decision days since Chairman Powell took over.
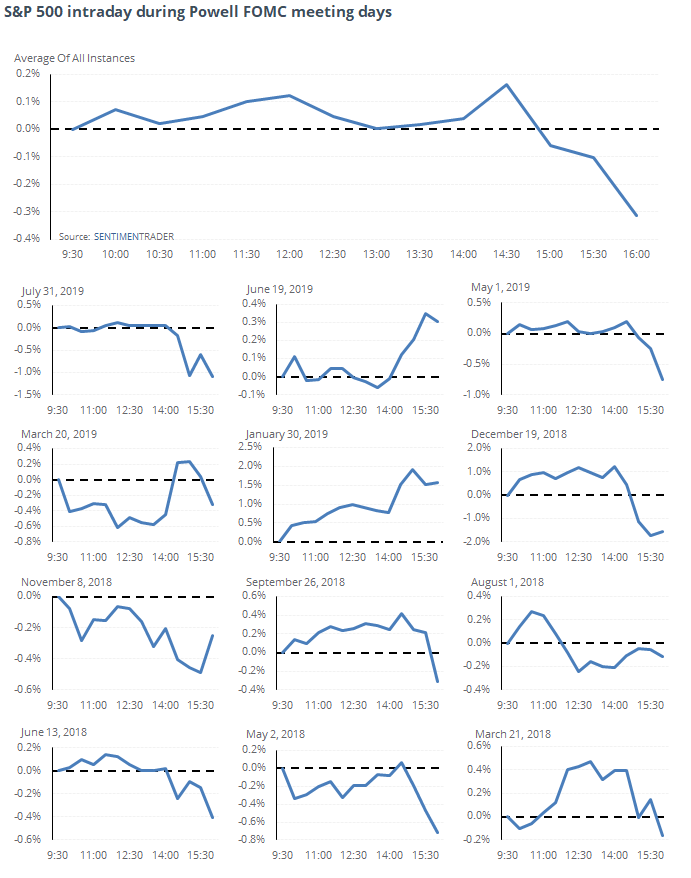
If we break it down by time frame, most of the weakness occurred near the end of the sessions.
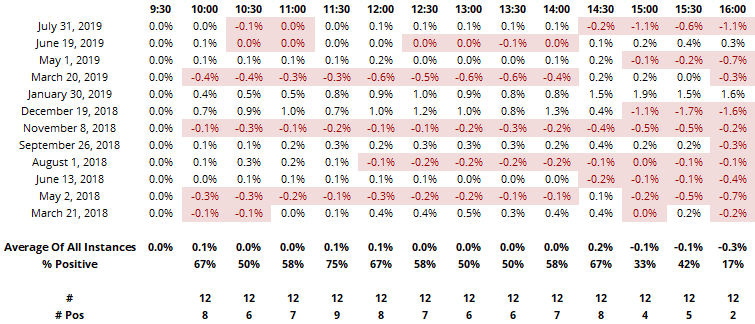
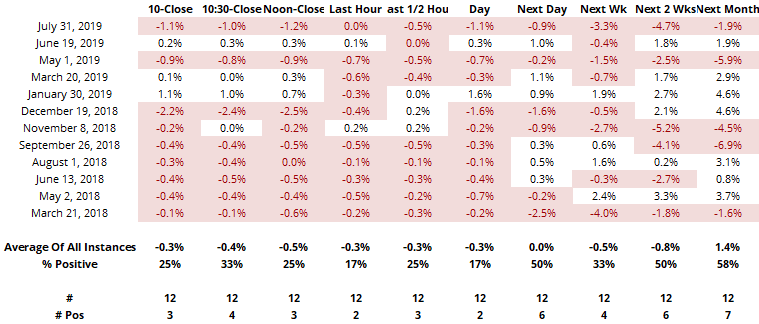
Looking at specific time frames, the worst was the last hour, with only 2 wins out of 12 attempts.
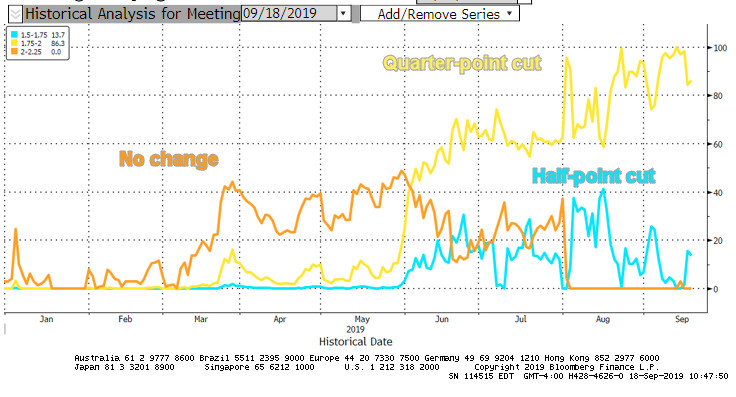
For the record, Bloomberg is estimating a high probability of a cut at this meeting.
Emerging Recovery
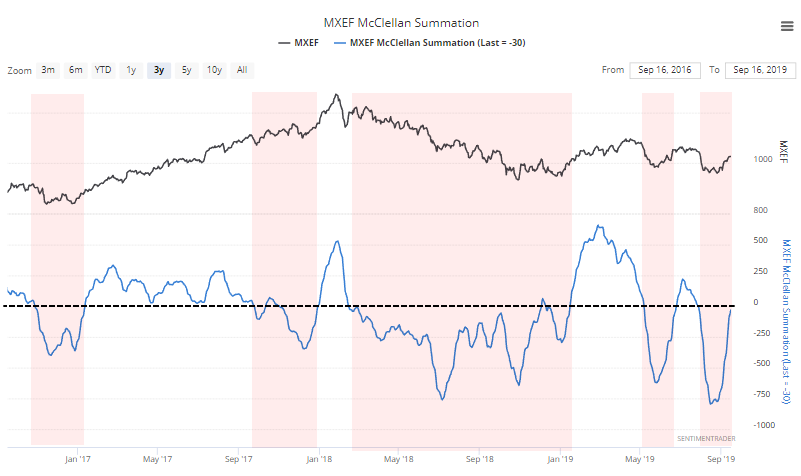
We saw in yesterday's report that several major market indexes are showing improved long-term momentum in their underlying breadth metrics. It's pushing the McClellan Summation Indexes above recent highs or outside of extreme thresholds.
For most U.S. indexes and sectors, that tends to be a bit of a short-term negative (overbought markets) but longer-term positive (momentum tends to keep going). For overseas indexes, it's more mixed, usually with a downside bias.
Investors tend to have a keen focus on emerging markets, and the Summation Index for the MSCI Emerging Markets Index is poised to turn positive for the first time in over a month. When it's negative, those stocks have had great trouble holding gains, so a move to positive territory seems like it should be a positive development.
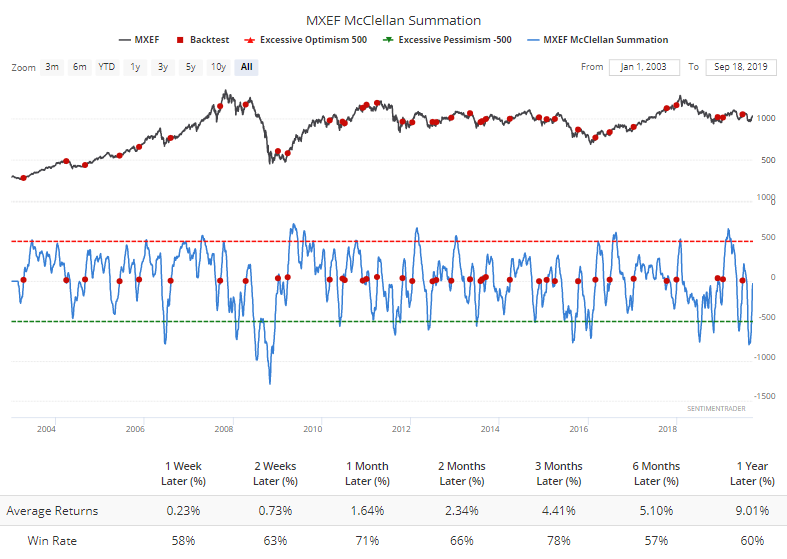
Using the Backtest Engine, anytime it crosses above 0, emerging markets typically have shown gains going forward, especially over the next 1-3 months.
If we add some context and only look at those times it crossed above 0 after having been below -750 in the past few months, then it gets shaky over the shorter-term.
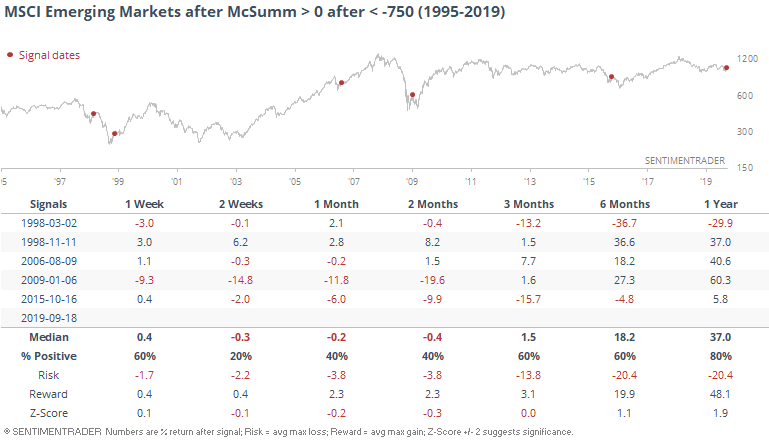
There were only 5 signals, and a few of the losses were severe, but four of them ended up leading to long-term gains, explosively so in three of the cases.
Japan Rising
We looked at the thrust in Japanese stocks a week ago, and they've managed to mostly hold the gains so far. Now the McClellan Oscillator for the Nikkei 225 has jumped to a near-record level.
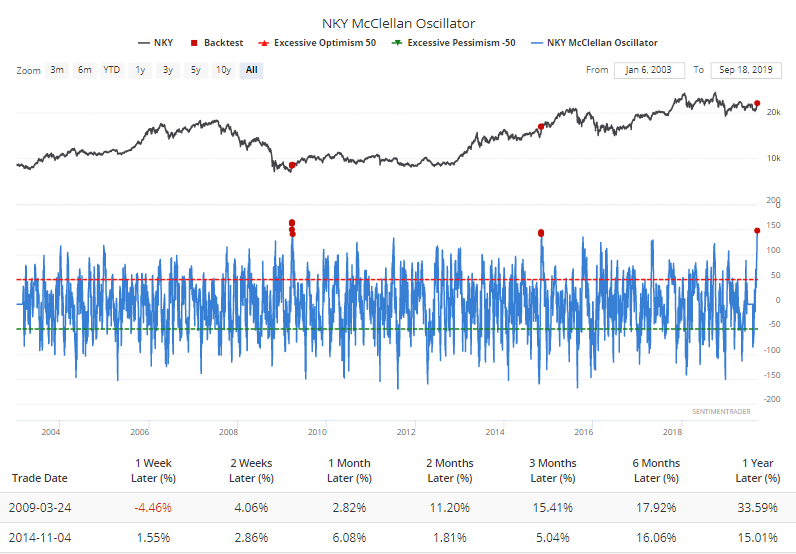
The only two other times it managed to rise close to this level marked important climbs out of a decline or basing period and the Nikkei rose more than 15% over the next 6 months both times.
Fund Flip
The ICI reports that last week, equity investors fled mutual funds, continuing a long streak of leaking assets. But it's not necessarily because they were pessimistic, as they poured almost twice as much money into equity ETFs.
This is the biggest shift from equity mutual funds to ETFs since last December.
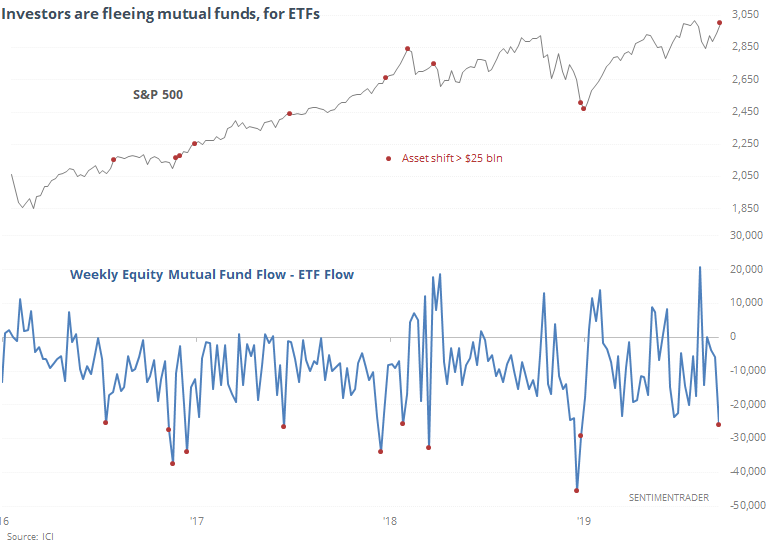
We can see from the chart above that such a big shift last December market the bottom, but it was not a consistent signal. The two prior to that market peaks. Generally, the S&P 500 rose in the weeks following these big asset shifts, but that seems mostly due to the steady uptrend over the past few years rather than any sentiment signal this might be giving.