
Wednesday Color - 1% losses, sensitive sectors to ISM data, no cash cushion, breadth anomolies

Here's what's piquing my interest as markets continue to suffer similar selling pressure to yesterday.
Bad Days
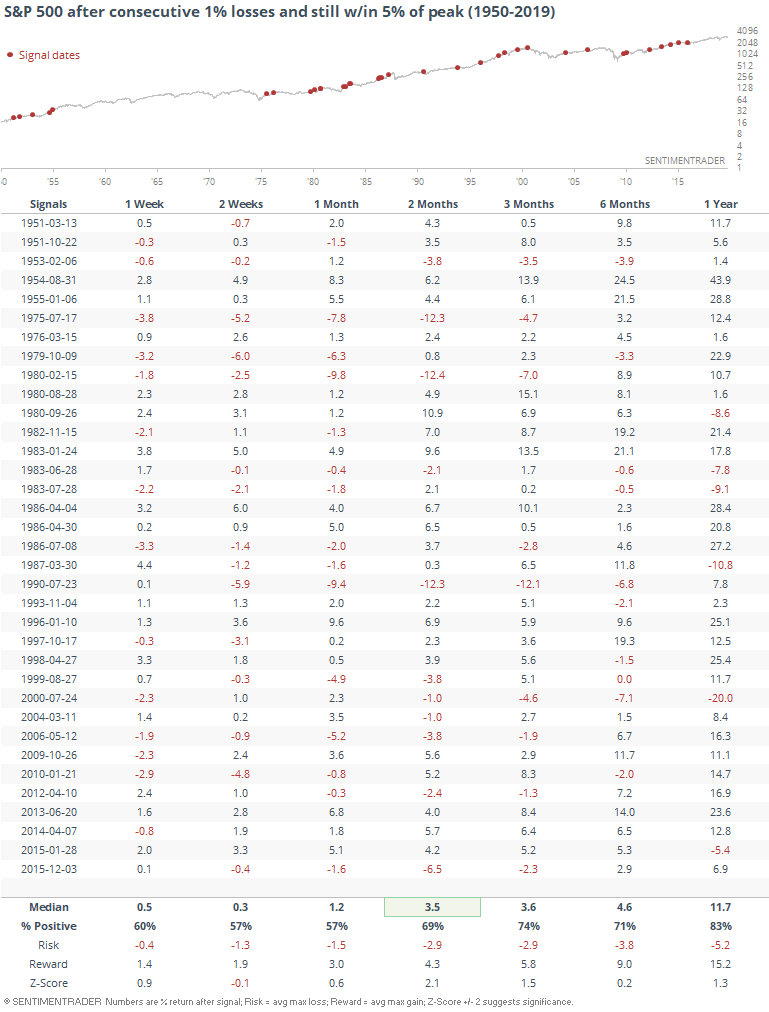
The S&P 500 is on track for another bad day, its first potential back-to-back 1% losses since last December. It's much less common to see this kind of concentrated selling pressure when the S&P is still within 5% of its peak over the past year, though.
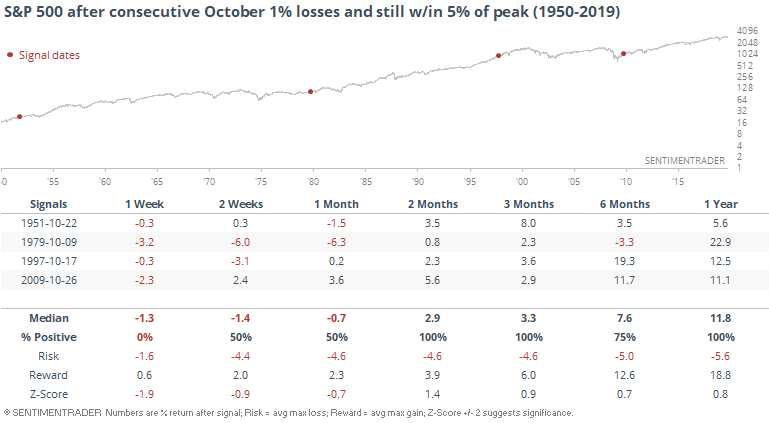
Only a few of them triggered in October.
If we ignore the market environment and just look at consecutive 1% losses in any October, we get the following.
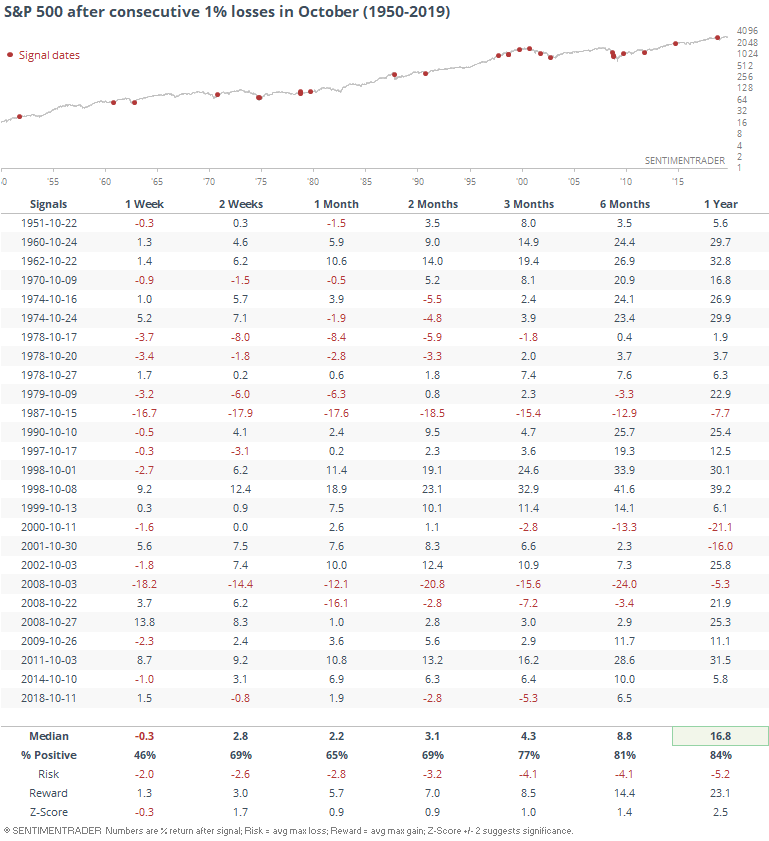
That's a bit weaker shorter-term, but more positive in the medium- to longer-term.
If we take a less strict view of the environment and instead of filtering the selloffs to times when the S&P was within 5% of its peak, we only look for times when it was at least above its 200-day average, then these October drops have led to even more selling every time over the next week.
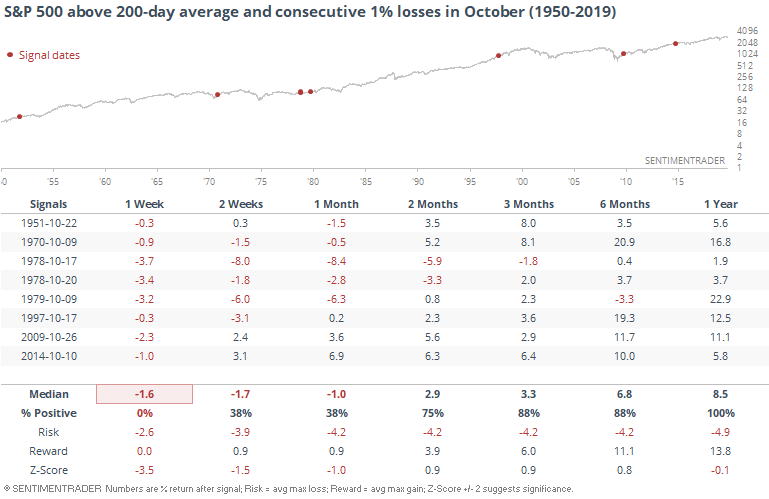
These stats are not market rules, they're just guides to how investors have behaved under similar conditions in the past. And generally, that has meant relatively rocky returns over the shorter-term, but few morphed into more serious declines.
Manufacturing Pessimism
After looking at various indexes, factors, and sectors after plunges to a low level in the ISM Manufacturing survey yesterday, we were asked to also look at a couple of areas that might be especially vulnerable - transportation stocks and industrial metals like copper.
First, transports.
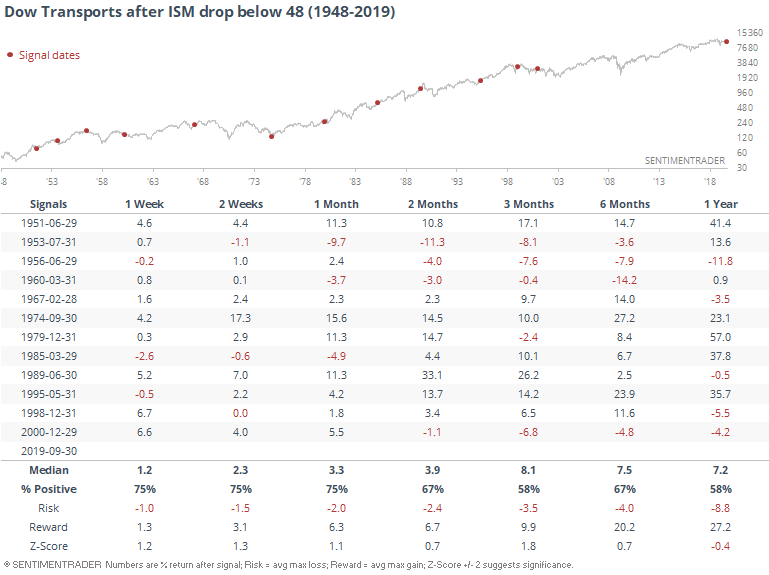
Returns here were weaker than we saw for the S&P or for most other sectors, especially over the next year. Returns in the S&P and most sectors were solidly higher in that time frame, but not so much for the Transports.
Copper is harder to read simply because the history is so short. There are really only four precedents over the past 30 years of history in copper futures.
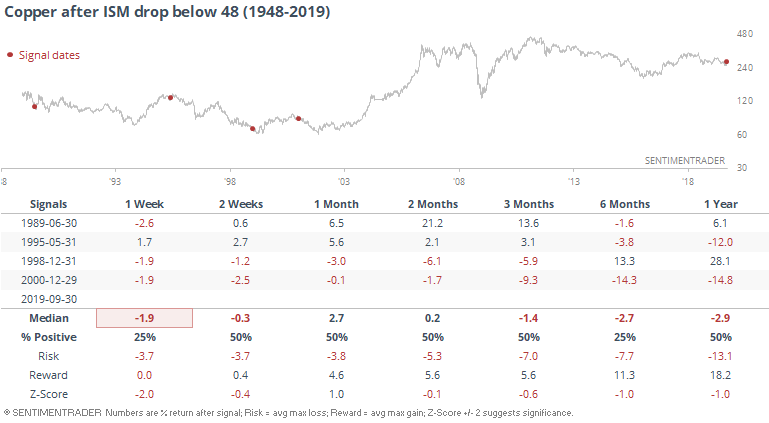
It was a mixed bag but with a negative skew. Over the next 6 months, there were 3 losses, and even the single winner had suffered losses during the first few months.
Cash Poor
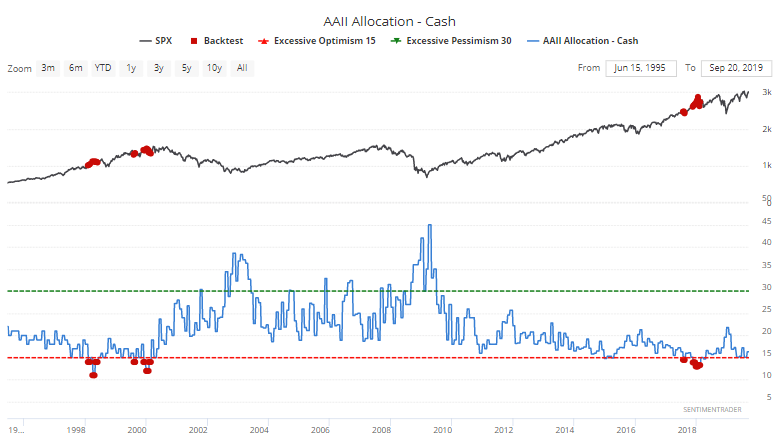
The latest AAII survey shows that individual investors in September reduced their cash cushion by quite a bit. They're now holding only 14.6% of their portfolios in liquid instruments, among the lowest in 30 years.
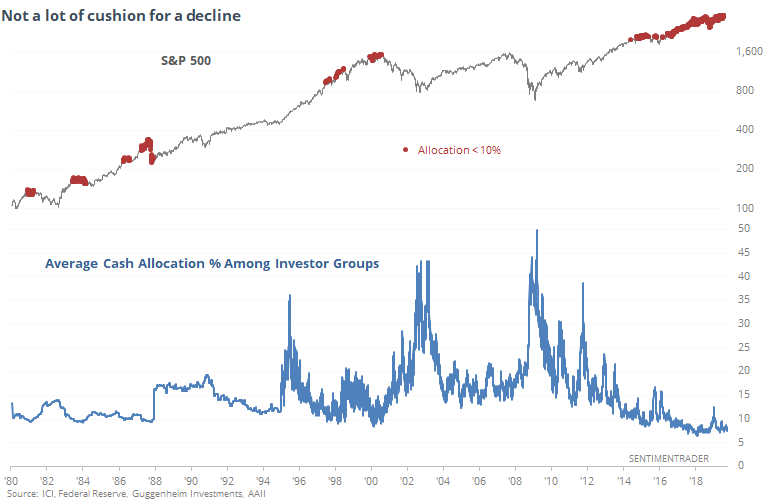
They're not the only ones. Looking at other market players, it's a consistent theme. Among mutual fund managers, retail investors, Rydex mutual fund timers, the AAII folks, and pension funds, the average cash balance is ticking near all-time lows.
If we zoom in on the past five years, it's not exactly a precise timing device.
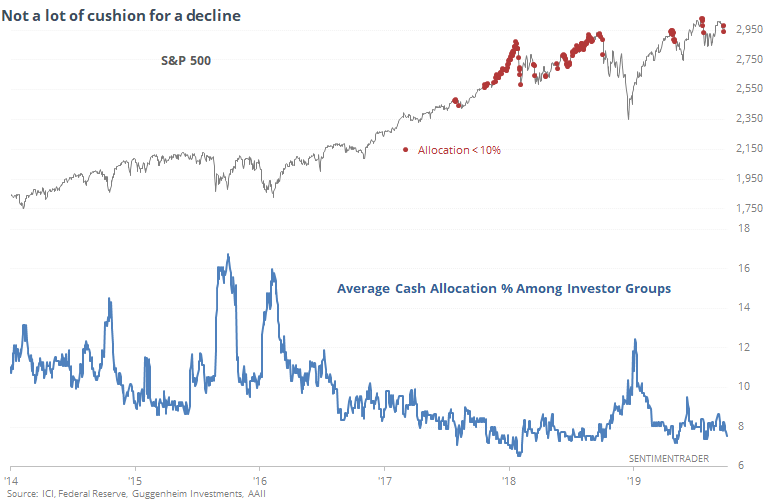
This is more of an environmental worry (investors may be forced to sell stocks instead of relying on a cash cushion during a protracted downtrend), but it's been a worry for years. On a short-term basis, it is not at all effective as a timing device.
Sector Breadth
There isn't any real guiding theme among the breadth metrics for indexes (domestic and overseas) and sectors. Generally, there is a positive bias with most of their advance/decline lines hitting new highs, but with waning momentum as the Summation Indexes are rolling over.
There are few extremes to note, but there are a few random observations that seem notable.
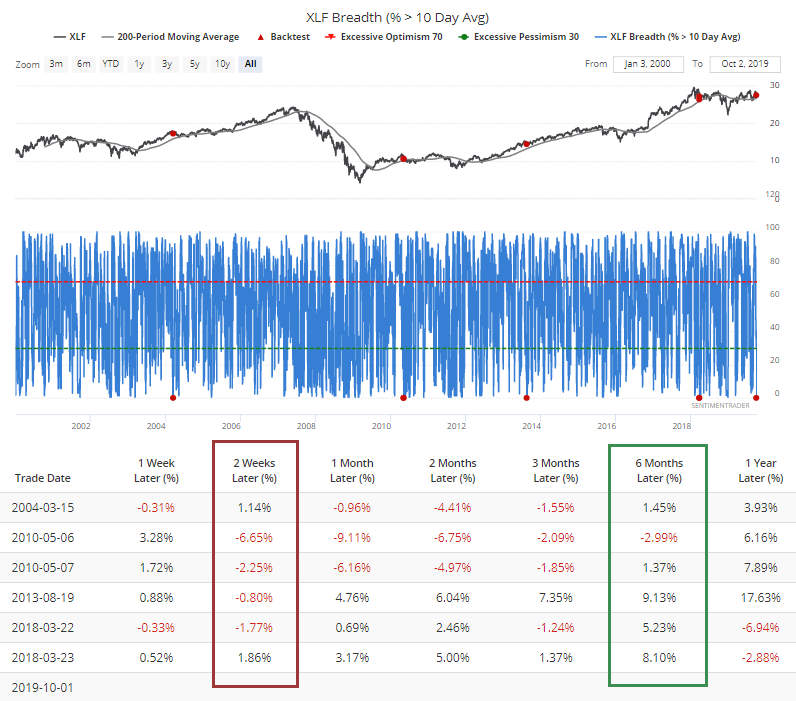
In financials, every stock fell below their 10-day moving average, even while XLF is holding above its 200-day average. That has preceded some short-term weakness but longer-term strength the few other times it triggered.
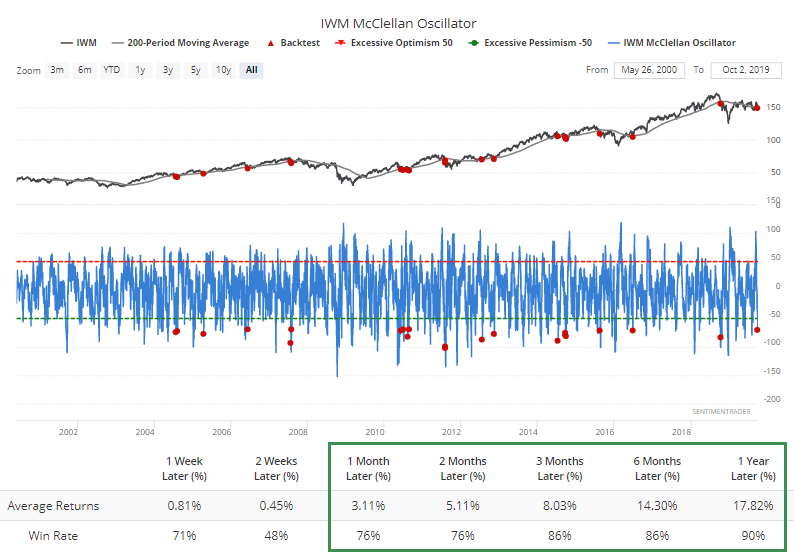
Selling pressure has been pretty heavy in small-cap shares again. The McClellan Oscillator for the Russell 2000 has fell to an extreme low. IWM has fallen below a rising 200-day moving average. This is a specific type of test, showing us times when selling pressure was fairly severe in the shorter-term as the fund was at risk of seeing a long-term uptrend end. It mostly led to higher returns, though.
One of the few pockets of positive momentum are overseas, especially in indexes like the Nikkei 225. There, the McClellan Summation Index has crossed above +900 for the first time in almost 2 years.
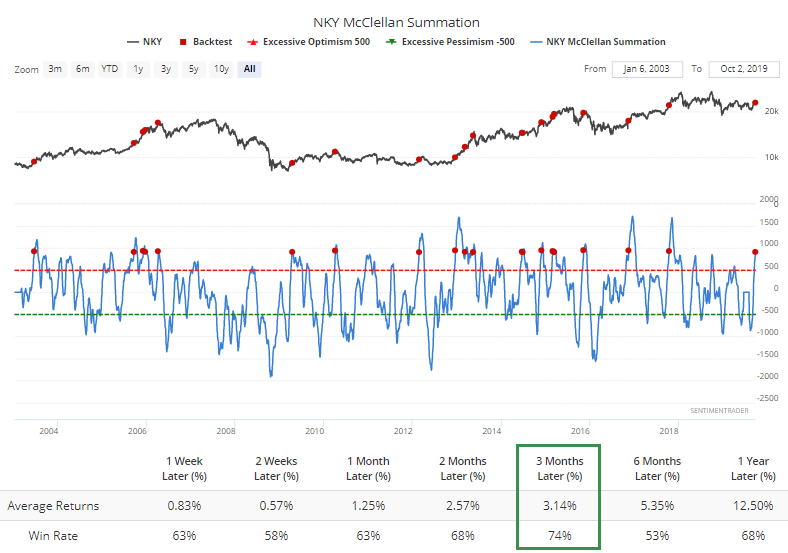
That didn't necessarily lead to gangbuster results, but for a market that has gone almost nowhere, the 3-month forward returns were decent.