
Wednesday Color - Gaps, Tuesday's Jump, Breadth Recovery, Bitcoin, Corn

Here's what's piquing my interest so far this morning. When there's a large or notable gap I prefer to get these out early, even if today's looks to be fading as we head into the open.
Gappy
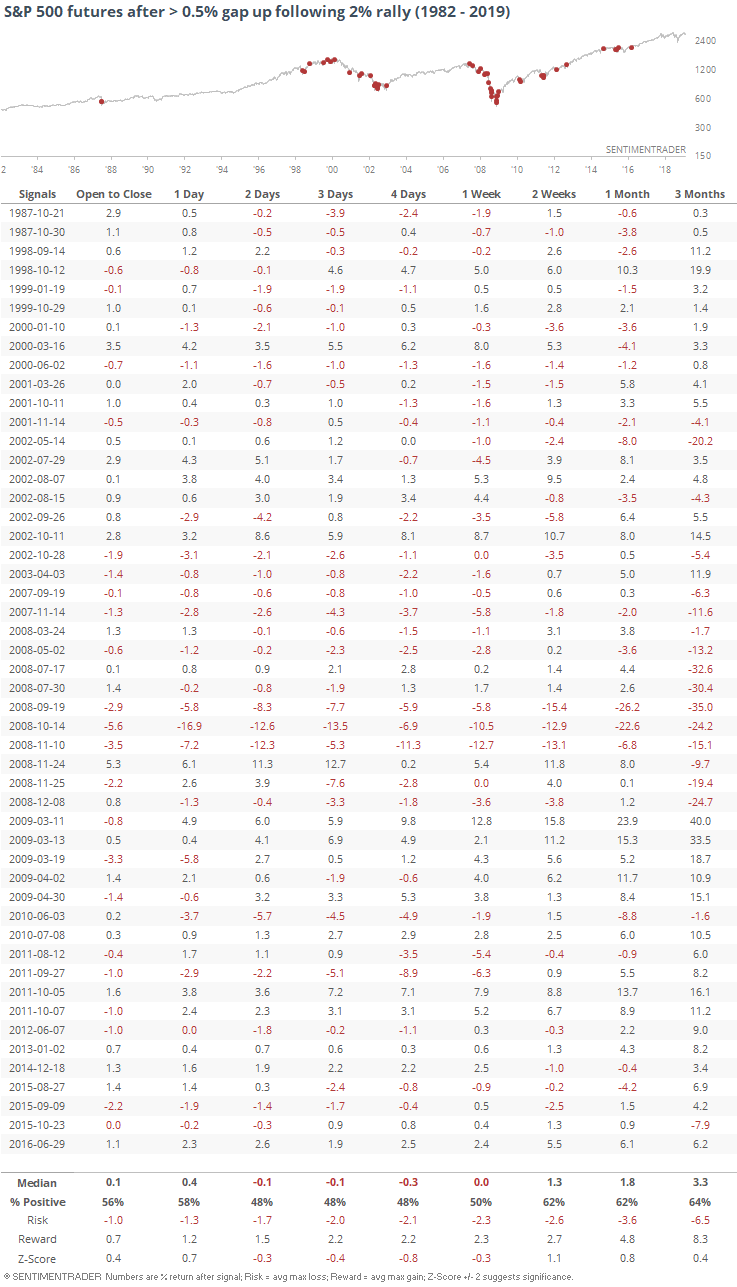
Stock futures are on track to show a relatively large positive gap up this morning as traders show some follow-through enthusiasm after Tuesday's surge. It has faded very recently but we'll keep these in for now, since slightly smaller gaps than indicated in the table led to mostly the same conclusions.
There have been more than 50 times when S&P futures jumped this much at the open following at least a 2% rally the prior day. Most of them came during bear markets and risk/reward over the next few days was not great.
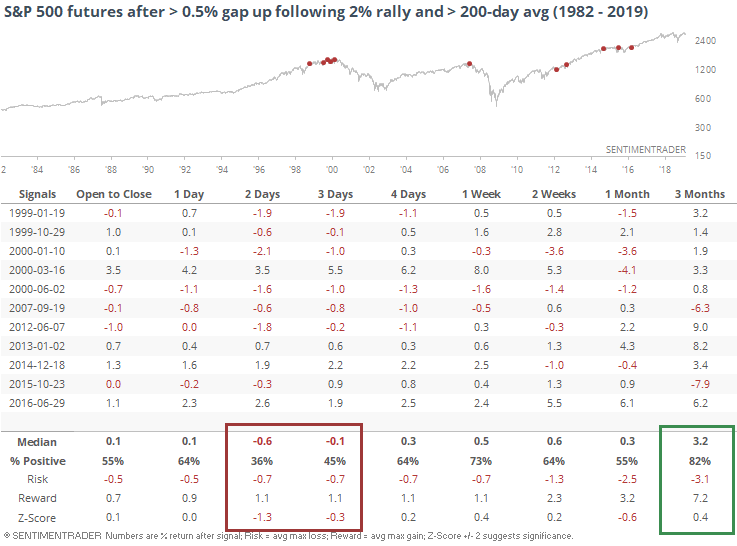
If we only include times when the S&P was above its 200-day average at the time, returns actually got worse in the very short-term but had a better risk/reward longer-term.
There have been only a handful of these setups coming off of at least a 50-day low. The only ones that didn't trigger in the midst of major panics or financial meltdowns were in 2011 and 2016, both of course leading to further upside.
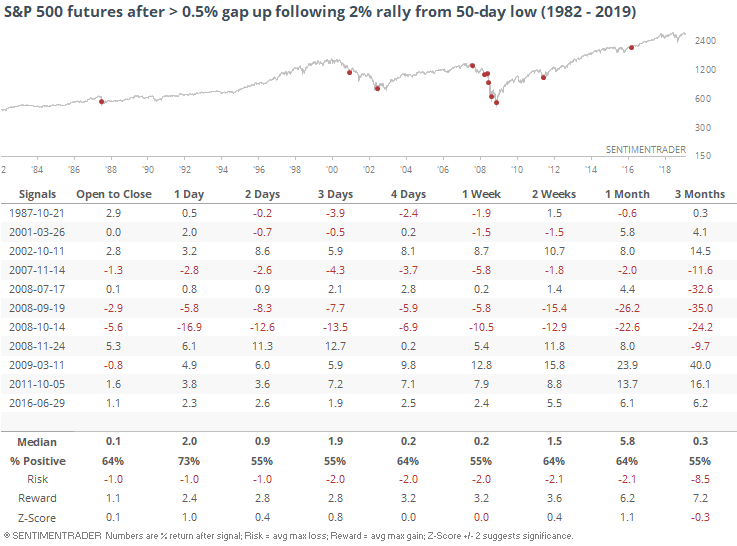
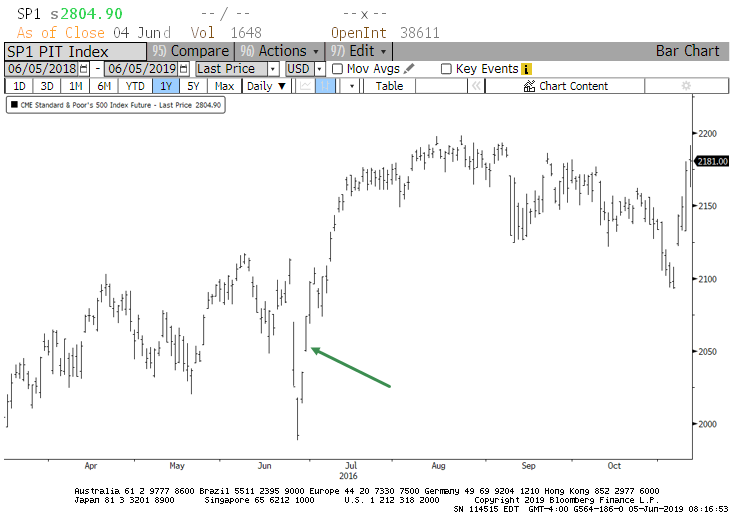
When we combine most of these factors, the only comparable date since 1982 was the one from June 29, 2016.
Tuesday
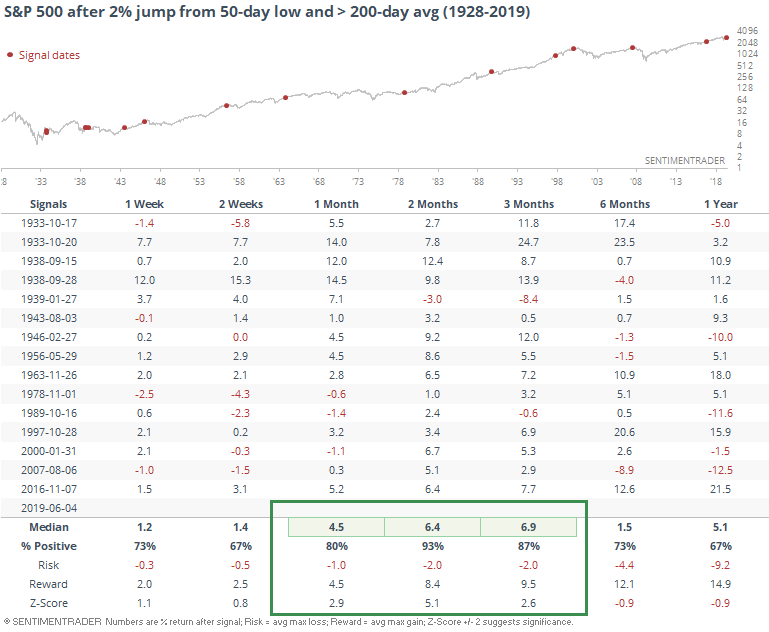
Forgetting about this morning's gap up, if we just look at yesterday's performance we can go back a lot further. Tuesday saw an intense change in buying interest, with the S&P 500 going from a 50-day low to a more than 2% gain on the day, and trading above its 200-day average. This has been an exceptional signal for the next 1-3 months.
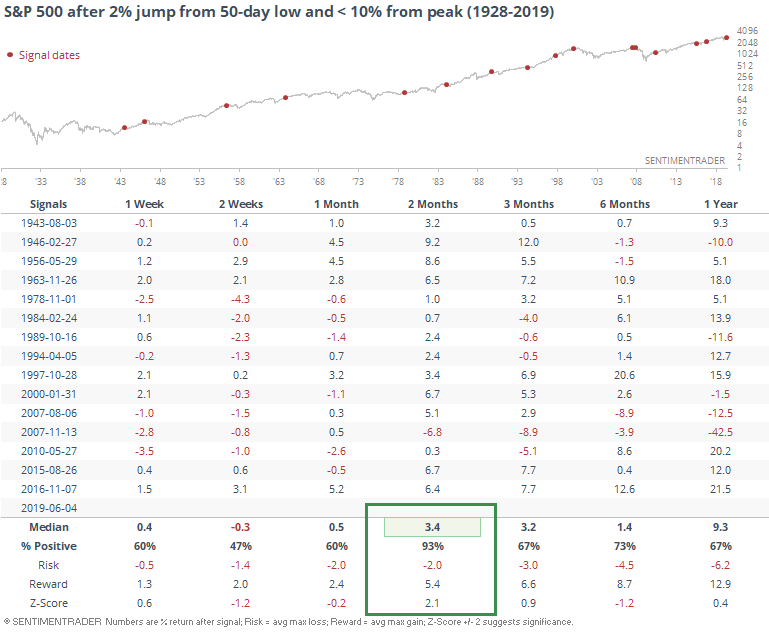
It has also been good when these sudden buying thrusts occur when the S&P was at least not in a correction. There is some overlap here but gives a few different dates.
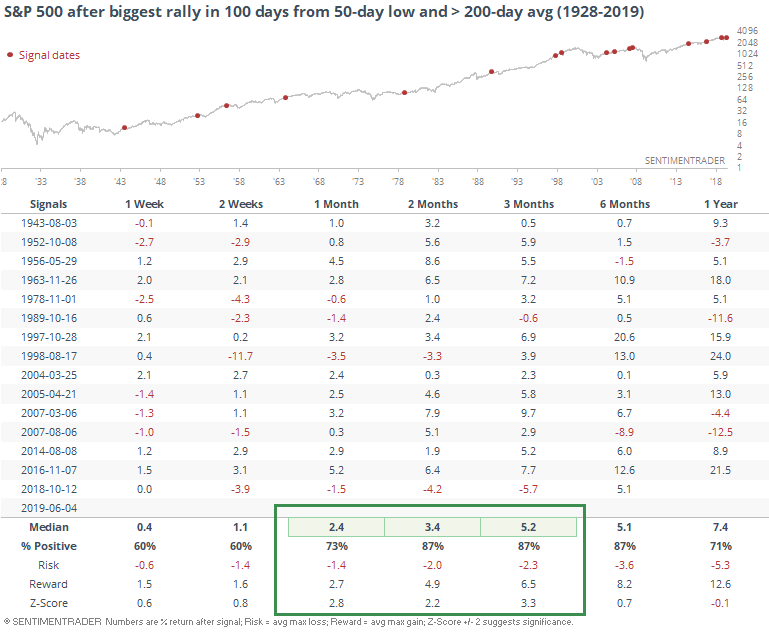
If we ignore the 2% gain, which doesn't take the market's volatility into account, we can look for times when the S&P was in a similar condition and then enjoyed its largest up day in at least 100 sessions. Again, some overlap but also some different dates in lower-volatility environments.
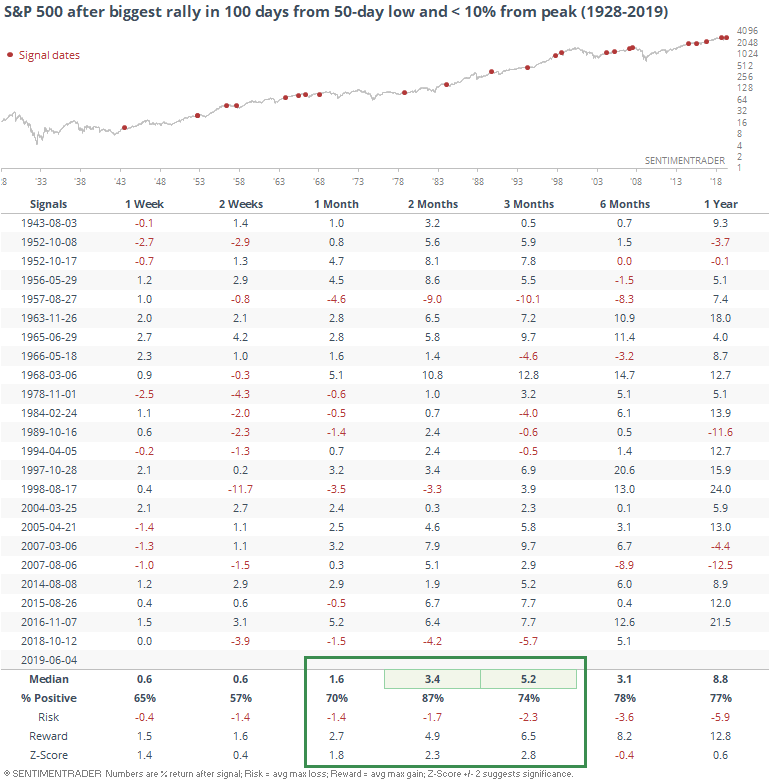
Because this is a relative measure (biggest gain in 100 days instead of a 2% gain), there were more instances in calmer markets, even if the S&P wasn't necessarily trading above its 200-day average at the time. This triggered 23 times when the S&P was within 10% of its peak, again with the same conclusion.
Breadth Review
Tuesday served to reverse some of the extremes we've looked at over the past several sessions, so there weren't really any extremes to note. The most notable development is the recovery in some sectors and markets, with breadth momentum flipping to positive after a long time in negative territory.
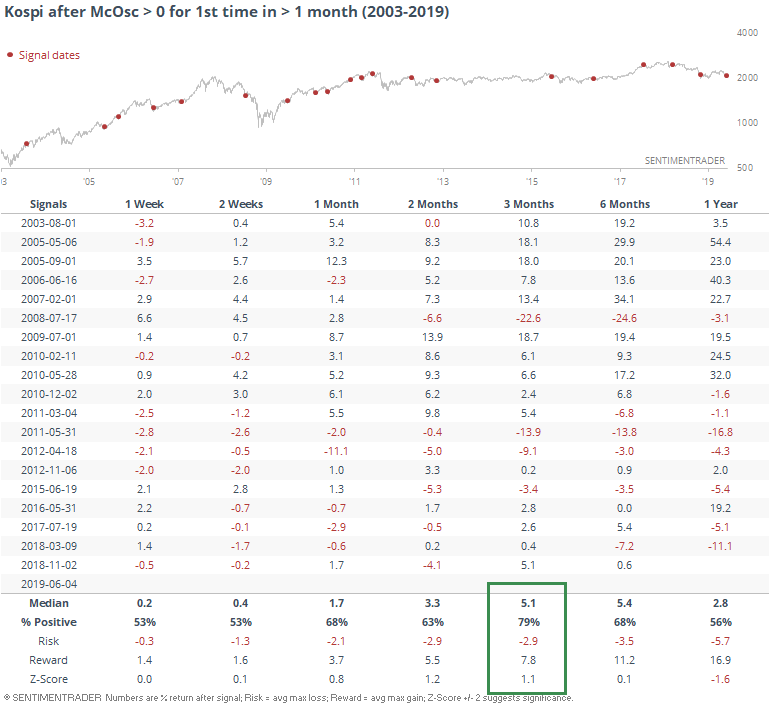
In Korean stocks, the McClellan Oscillator for the Kospi popped above 0 for the first time in more than a month.
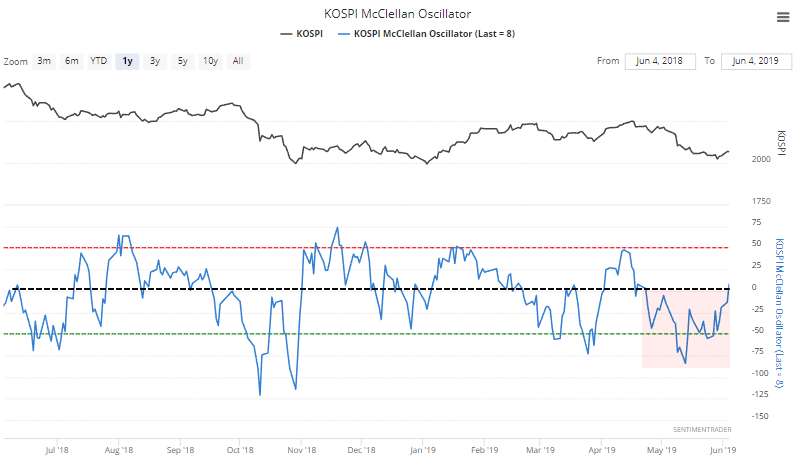
That's been a good sign, but with a few large failures.
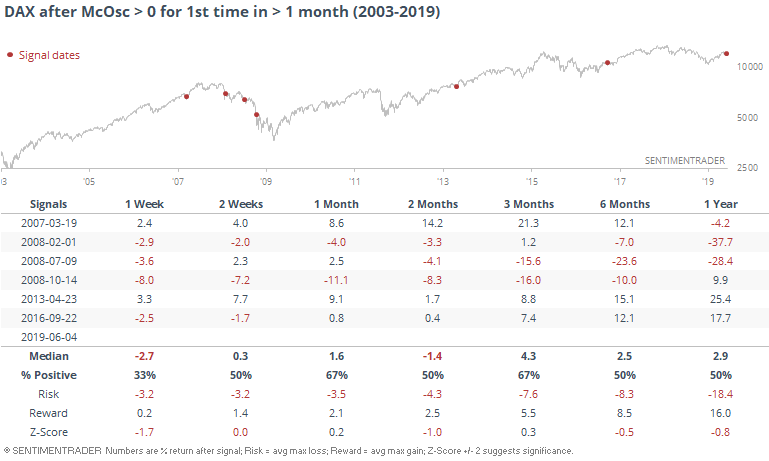
The German DAX has popped above 0 for the first time in more than a month as well.
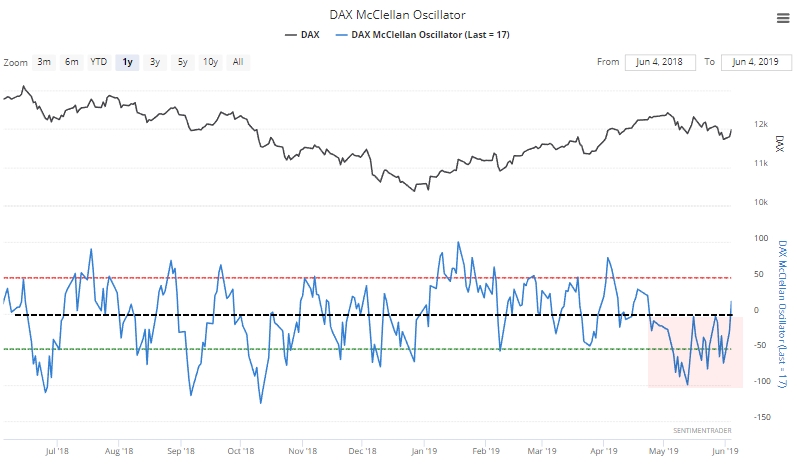
It has been rarer to see that market suppressed for this long, but surprisingly it wasn't a great sign going forward because of 2008.
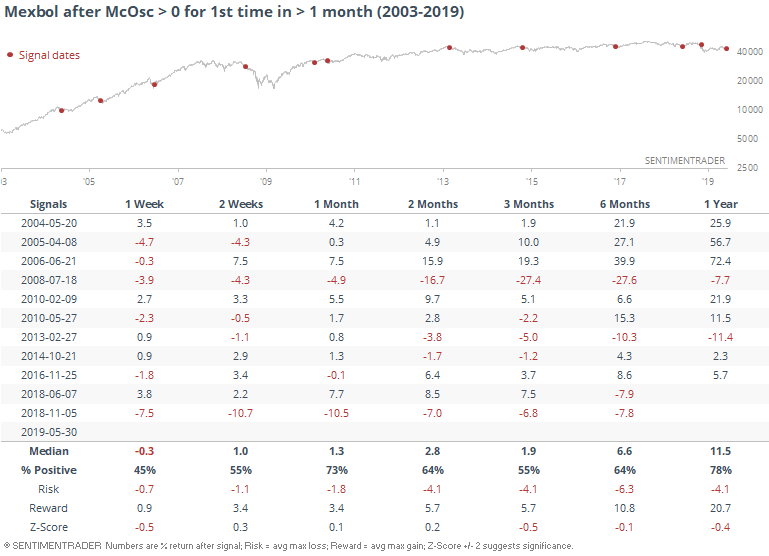
It was basically the same story for Mexican stocks, where the Mexbol's Oscillator moved above 0 a few days ago after a long stretch below.
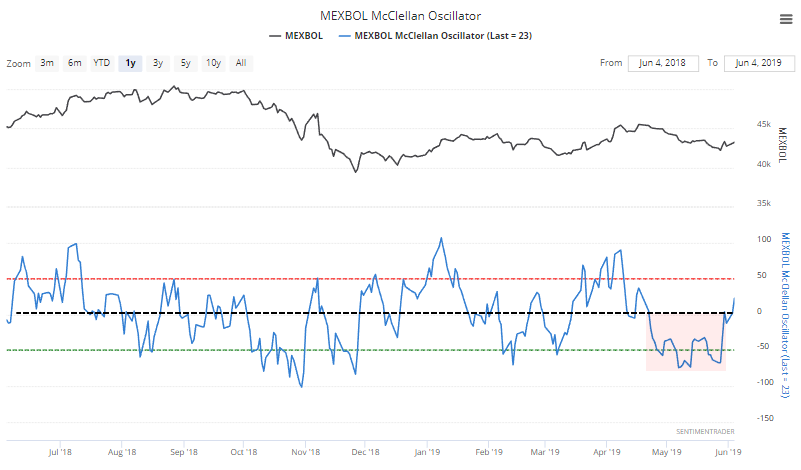
This was decent for the next month, but otherwise lackluster.
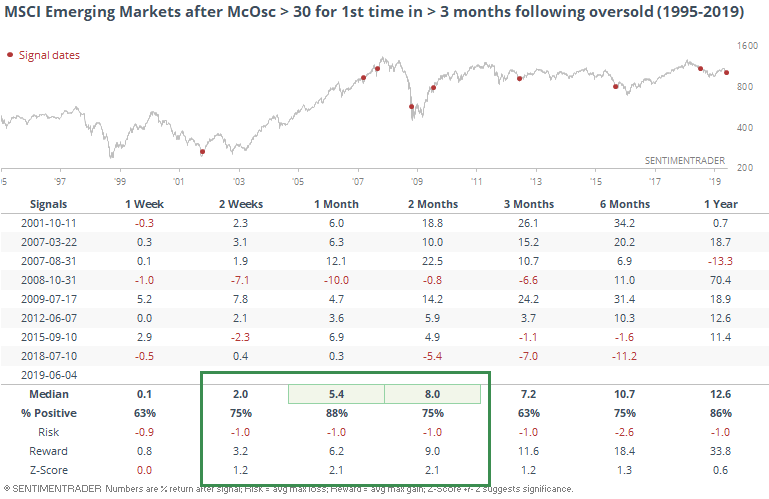
For emerging markets, there has been a cycle from an extremely low Oscillator to the first reading above 30 in more than three months.
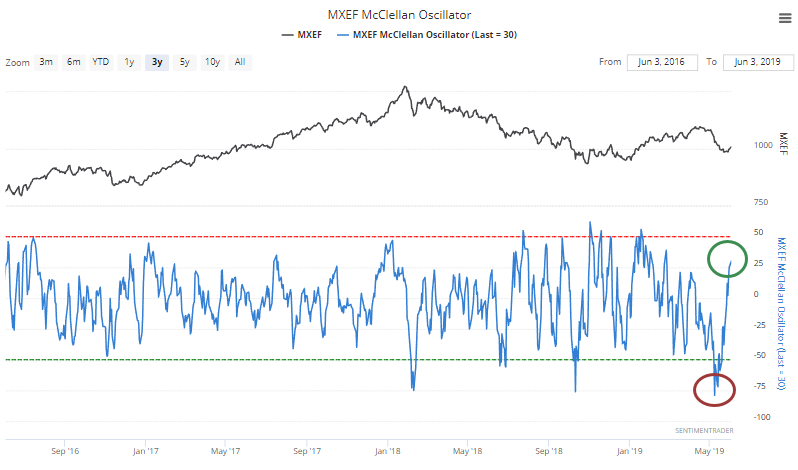
This kind of change in momentum has been a good sign for these markets.
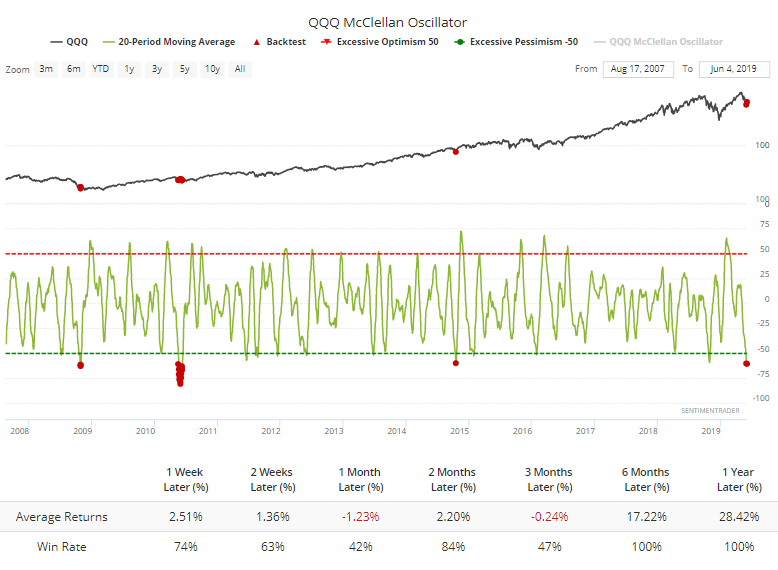
While the Oscillator for tech stocks here in the U.S. is still negative, it's remarkable that over the past 20 days it has averaged less than a -60 reading on the Nasdaq 100. In that fund's history, it has been this low, for this long of a period, only a few times.
Bitcoin
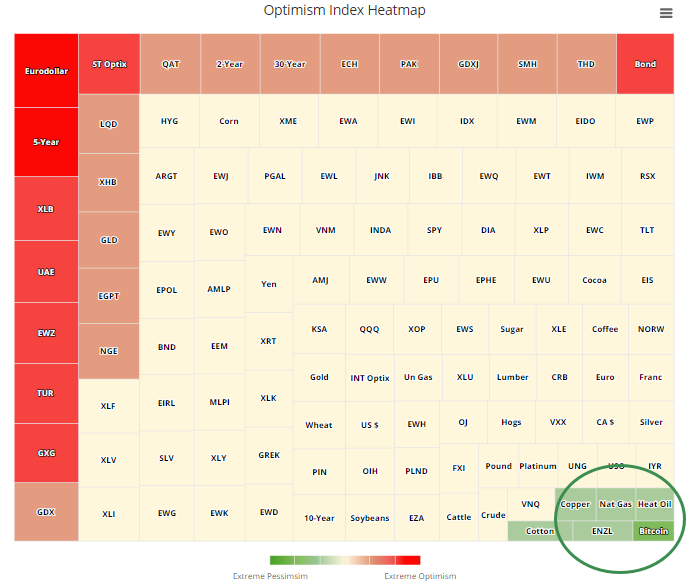
I don't touch coins, but it was at least interesting that the Heatmap shows Bitcoin has having the lowest Optimism Index reading. Haven't seen that in a while.
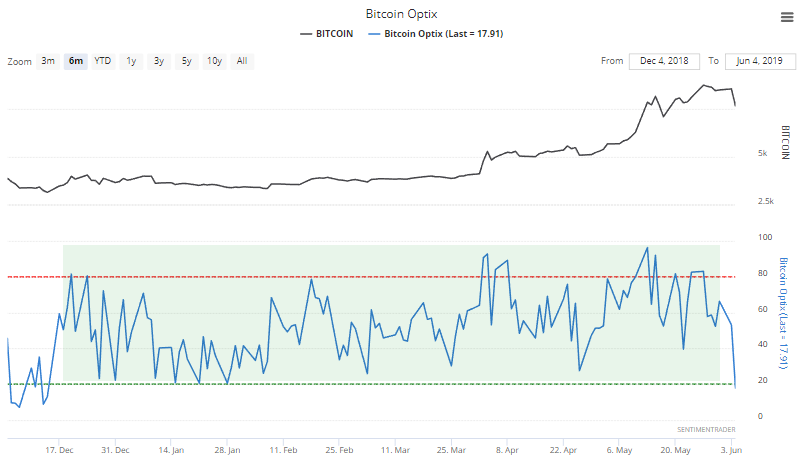
We haven't seen pessimism there for months. All year, basically.
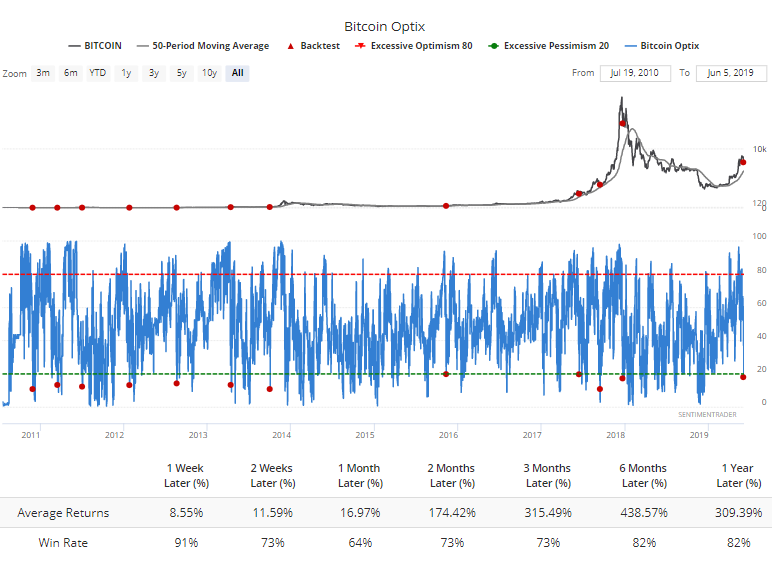
The Backtest Engine shows that when it drops below 20 and Bitcoin is still trading above its 50-day average at the time, it has typically rebounded. FWIW.
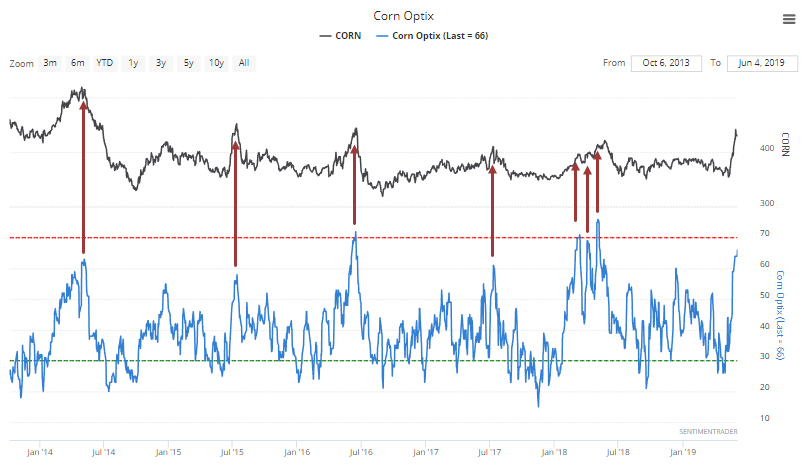
Corn Hole
I've been favoring commodities, especially grains, for a while, and now that they've actually moved, the big test is looming. Optimism has rebounded strongly in corn, and that has not been a good sign over the past five years.
Especially because we're about to head into this:
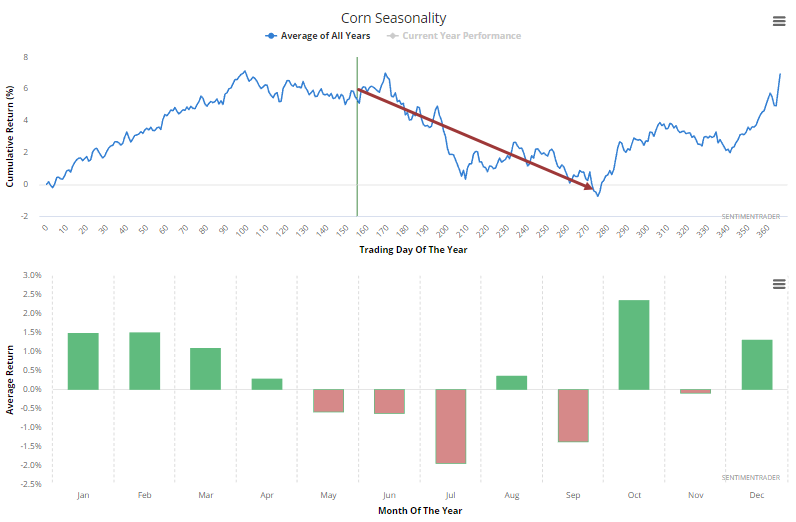
Fundamental factors can more easily overwhelm sentiment in commodity markets than others, and there are definitely some factors that could (should) drive grains higher longer-term. A local farmer I know sent me this last week:
It has been so wet we have 28 out of 450 acres of corn in.
Hard to be too bearish after repeated messages like that.