
Website update

Over the weekend, we'll be making some changes to the site and the research reports. Below is a summary of the changes.
We know that whenever there is a change, no matter how small, it can be a bit jarring to your daily workflow but we think these changes will ultimately make things easier, quicker, and more convenient. With markets so volatile, it's not the best time to make a change, but these will allow us to be more responsive and make better use of your time.
WHAT WE'RE DOING
Menu structure of the website
We've put a pause on adding indicators to the site in recent months because for many users it's already overwhelming, it can be hard to find things, and some of the longer menus get cut off at the bottom of the screen. The revamped site places less emphasis on hover menus and more on search and tables.
Daily Report
Starting the week of March 23, we're moving away from using PDF for the Daily Report. Going forward, they will be in HTML format with the option to download a PDF version for reading offline.
WHY WE'RE DOING IT
Site changes
- Better use of screen space
- Easier to find more indicators
- Less overwhelming in certain sections
- Better to guide those who might not know where to look
- Faster for many users
Daily Report changes
- Able to use filters to find the content most applicable to you
- MUCH better search capabilities
- Better delivery rates
- Can be more quickly and flexibly sent via email instead of messing with formatting and software issues to convert to PDF
- Fewer issues with PDF readability in certain email clients and browsers
WHAT IT MEANS FOR YOU
Nothing on the site is going away. Everything that has been there will continue to be.
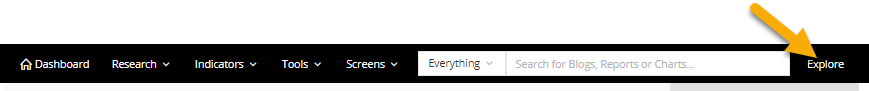
When you first go to the site, the Dashboard will be the same as it was. The menus at the top are slightly different and should be self-explanatory. They'll give quick access to the most-used links to research, indicators, tools, and screens.
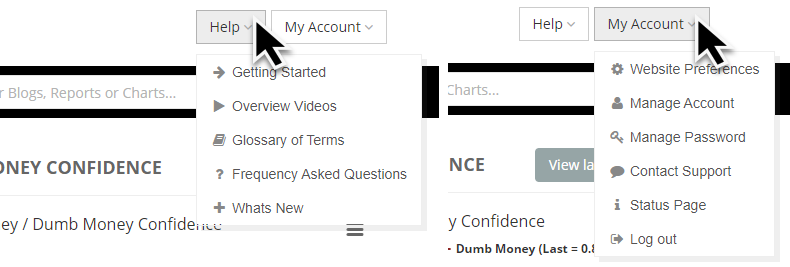
At the top, you'll see boxes for the Help section, and My Account where you can update your preference and personal information.
You'll notice a new section named Explore.
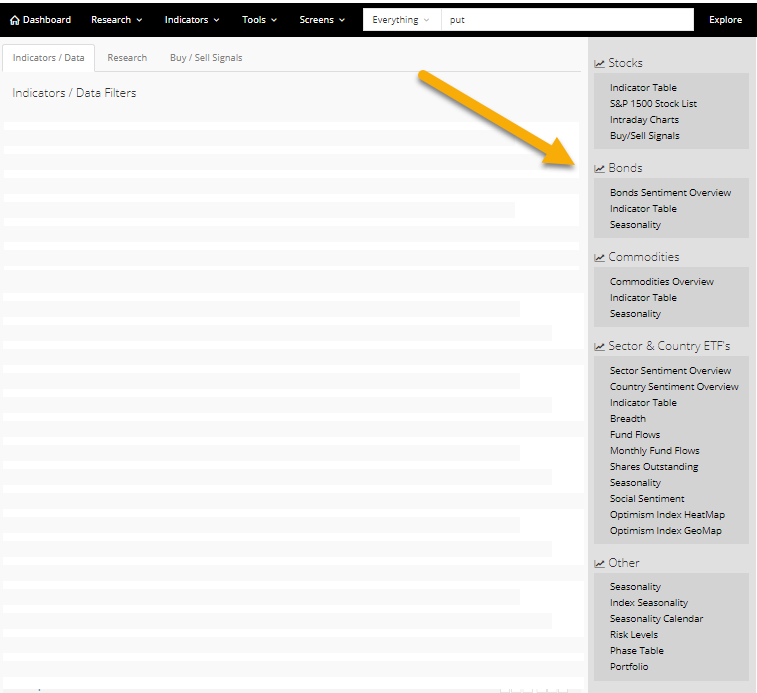
The right-hand side of that page will show quick links to the main sections of the site. Clicking any one of them will pull up the appropriate page (e.g. to see all of the indicators for an asset, like Stocks, click the Indicator Table link in that section).
The middle section will give you a quick and flexible look at indicators and research that might be the most useful to you.
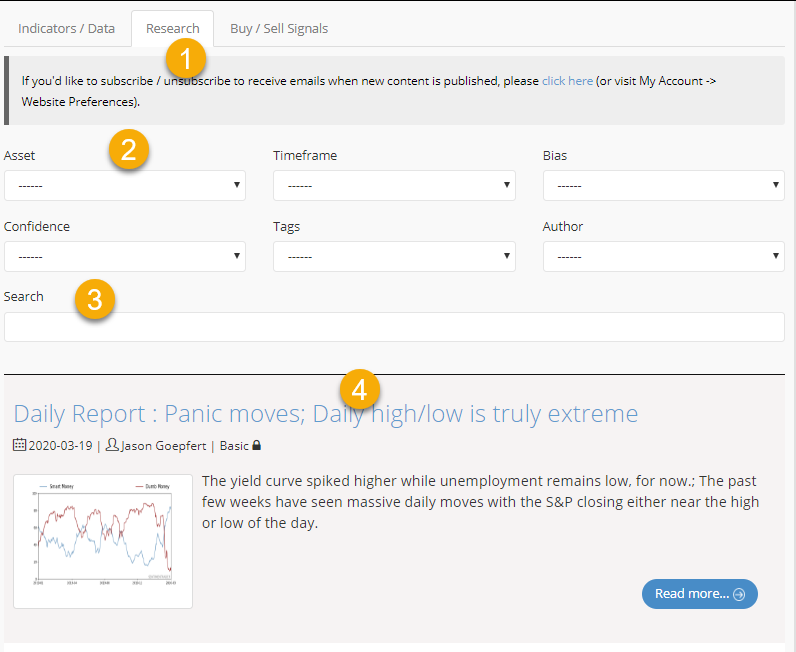
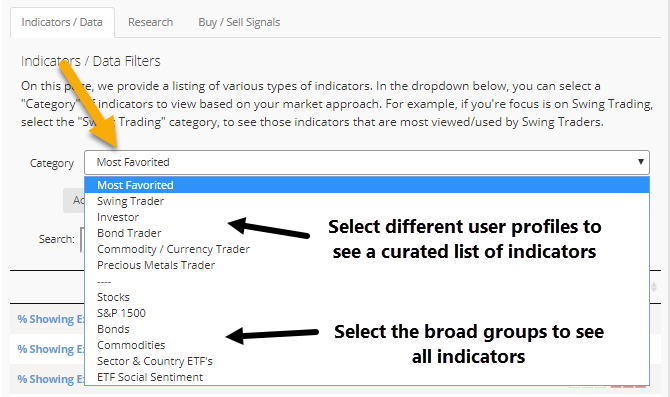
1. The tabs at the top allow you to switch your view between Indicators, Research, and Buy/Sell Signals. Clicking the Indicators tab will pull up a table of the Most Favorited indicators. The drop-down box will change the table to show a curated list of indicators based on different user profiles, or you can click the broader groups near the bottom to see all indicators for stocks, bonds, etc. You can always save indicators to your Favorites and only view that list by going to Tools > Your Favorites.
2. In the Research tab, you can now filter the reports based on what you'd like to see. If you only invest in stocks and don't care to see any research about bonds, then you can select Stocks from that drop-down box and you'll only see research related to stocks. If you don't care to see anything about short-term gyrations, then you can also click the Timeframe box to only see research tagged as longer-term. All of these are meant to show you only the research you might care about.
3. The Search bar allows you to quickly search through all the research to only show you posts that pertain to what you're looking for. You can use this combined with or instead of the drop-down boxes.
4. The bottom panel shows all the research relevant to you based on your drop-down choices or anything typed in the Search bar.
EMAIL DELIVERY
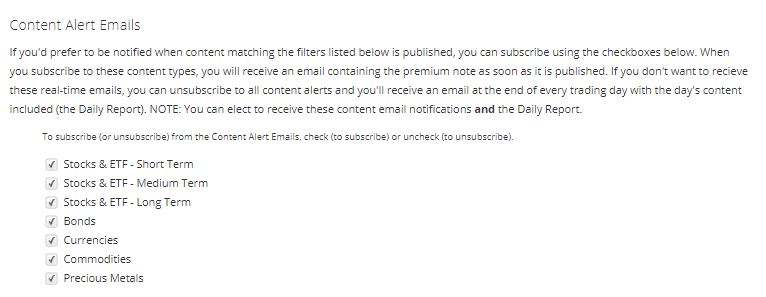
This format allows us to publish research on a real-time basis instead of waiting for a once-a-day digest. For premium users, you can go to My Account > Website Preferences and select what kind of Research you'd prefer to receive via email. You'll get the research delivered to you as soon as it's posted, or you can prefer to just receive a daily digest at the end of the day.
Also, you can choose what you want to receive. If you don't want to receive anything about bonds, for example, just un-click that box and you won't get any emails tagged with "bonds."
DAILY REPORT
The daily digest report is going to look different, even though all of the content will still be there. There are pluses and minuses to this, but we feel that overall it will be a benefit. It's not as "pretty" as using PDF, but using that format has its own downsides.
Basic users will still receive an end-of-day notice giving a list of content posted that day, with links to the appropriate reports. Just click the link to view the report, or the links for the individual basic reports in the email.
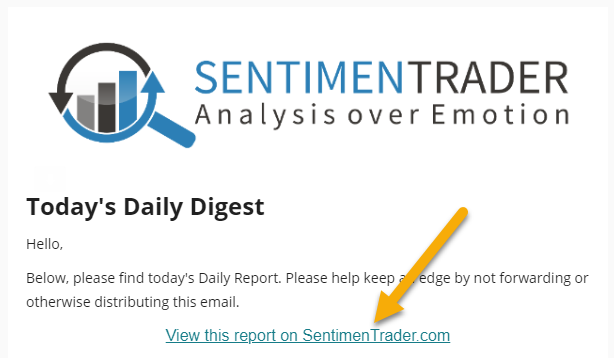
Premium users will get the report delivered to them in HTML format. Some email clients won't show images by default, so you might have to click a link to show them.
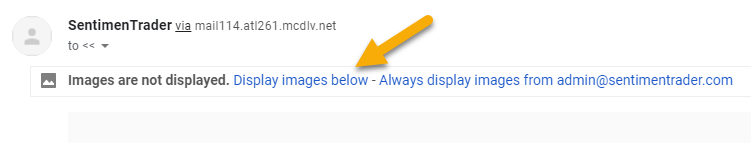
Also, depending on your email, it might cut off the report. Near the bottom, you might see an option to expand the email, like this.
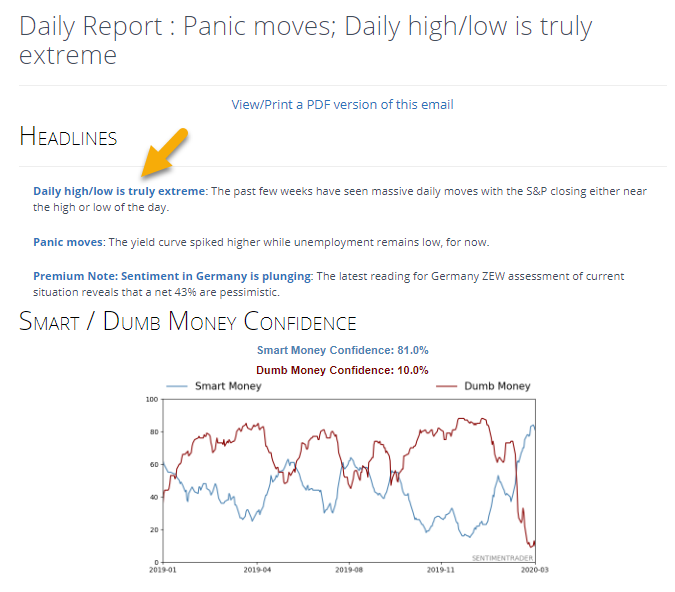
Once you view the report on the website, all the same content is there, just in a different format to optimize viewing in all browsers, including mobile.
The Headlines will show links to all content posted during the day. Click the link to view the report itself.
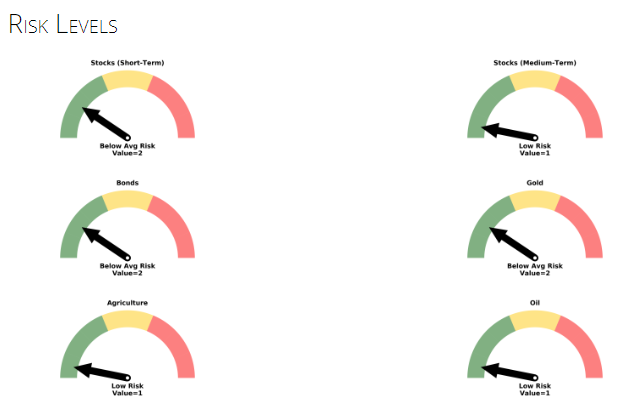
The Risk Levels will be shown as gauges, with a tag to show the current level and description.
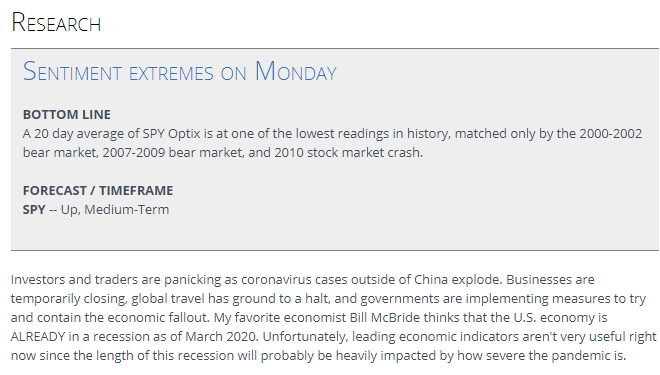
The research posts will follow that. You can click the link to view the research on its own (better for printing), along with the bottom line and a forecast and market if one is appropriate.
Following the research is a summary of other aspects of the site, including:
- Active Studies
- Indicators At Extremes (with hyperlinks to the indicators)
- Portfolio
- Phases and Ranks tables
- Geo-Map
- Optimism Index thumbnail charts
We realize that if trying to print the entire report, it's not optimized. The vast majority of users, if printing anything, print the reports and not the other pieces. It's still possible, but will take more sheets of paper.
We're looking forward to these changes because it will allow us to make the site more comprehensive, responsive, and customizable to you. It will also enable us to publish research on a much more timely basis, while giving you the flexibility to see and receive only those pieces that are most relevant to you.
As always, we welcome feedback and ways to help make the service more useful to you. You can reach me directly at jason "at" sentimentrader "dot" com.