Watch Wheat

While corn and soybeans remain mired in periods of seasonal weakness, wheat is entering a period of seasonal strength.
The chart below displays the Annual Seasonal Trend for wheat.
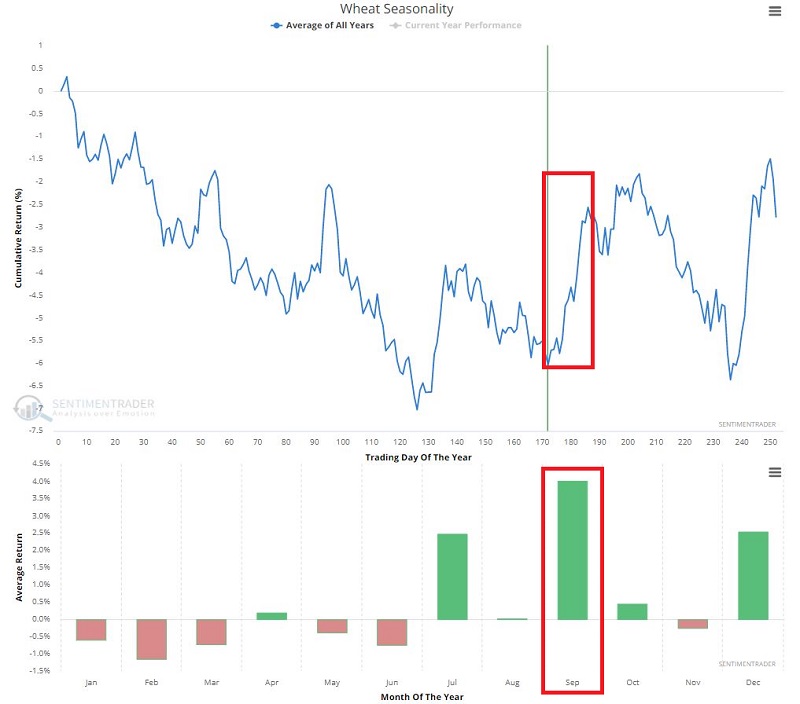
TRADING DAY OF YEAR #172 THROUGH #186
Let's focus on the period highlighted in the red box in the chart above - which extends:
- From the close of TDY #172
- Through the close of TDY #186
The chart below displays:
- The gain or loss in dollar value for wheat futures
- During this period
- Since 1959
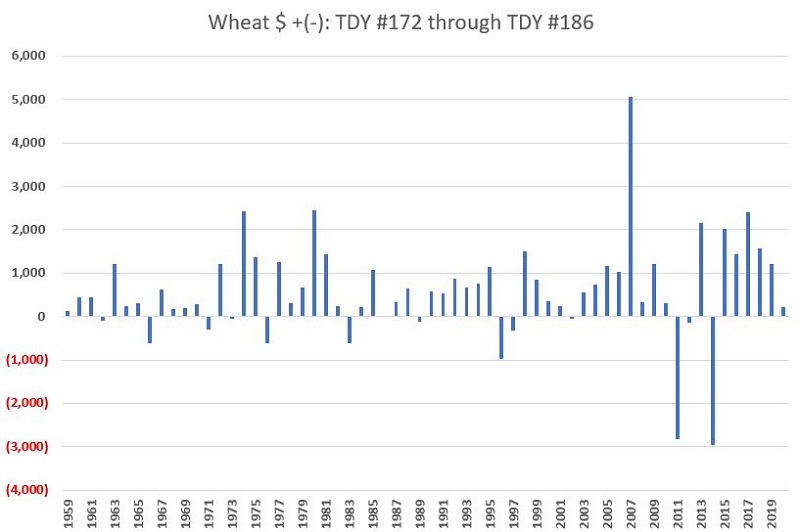
As you can see in the chart above, wheat:
- Was a model of consistency during this period for many decades
- Took two large hits during this period in the past decade
- Has returned to consistency in recent years, showing gains during this period in each of the last 6 years
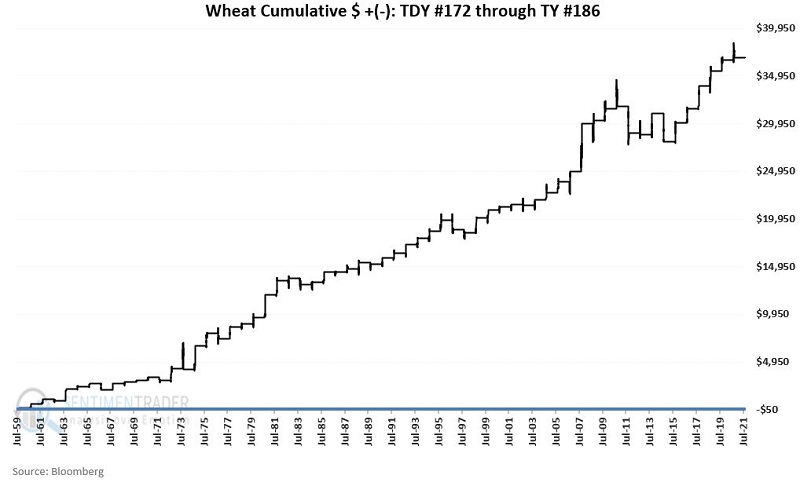
The chart below displays:
- The cumulative gain or loss achieved by wheat futures
- ONLY during this seasonally favorable period
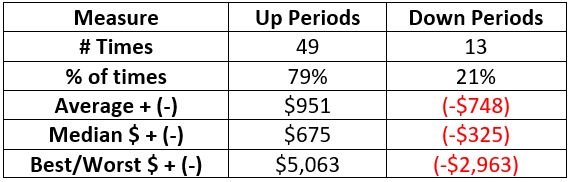
The table below displays the relevant facts and figures regarding wheat performance during this period.