Data &
Technology
Research
Reports
Report Solutions
Reports Library
Actionable
Strategies
Free
Resources
Simple Backtest Calculator
Simple Seasonality Calculator
The Kelly Criterion Calculator
Sentiment Geo Map
Public Research Reports
Free Webinar
Pricing
Company
About
Meet Our Team
In the News
Testimonials
Client Success Stories
Contact
Log inLoginSign up
< BACK TO ALL REPORTS

Wall Street strategists stay put as index roars

Jason Goepfert
2021-04-15
Wall Street strategists haven't been raising their year-end price targets on the S&P 500 fast enough. The index is now trading above the median estimate for where the index will end the year.

Earlier this week, we saw that as companies start to report Q1 earnings results in earnest, Wall Street analysts have been busy upgrading their estimates and price targets.

Analysts tend to work from the bottom up (fundamental earnings outlooks, company management quality, etc.), while strategists on the Street tend to work from the top down (macroeconomic principles, fiscal and monetary analysis, etc.). And those top-down outlooks haven't been able to keep up with stocks' torrid pace.

The S&P 500 is now above the median strategist year-end price target...and it's only April.

We've looked at this many times over the years, with the best opportunities coming when the S&P was 20% or more undervalued relative to strategists' price targets. When it gets more than 5% overvalued, then it has tended to pause and let strategists catch up. 

We're not there yet, as the index is only about 1% above its average target price. This level of excess has led to an annualized return about in line with random, even a bit above.

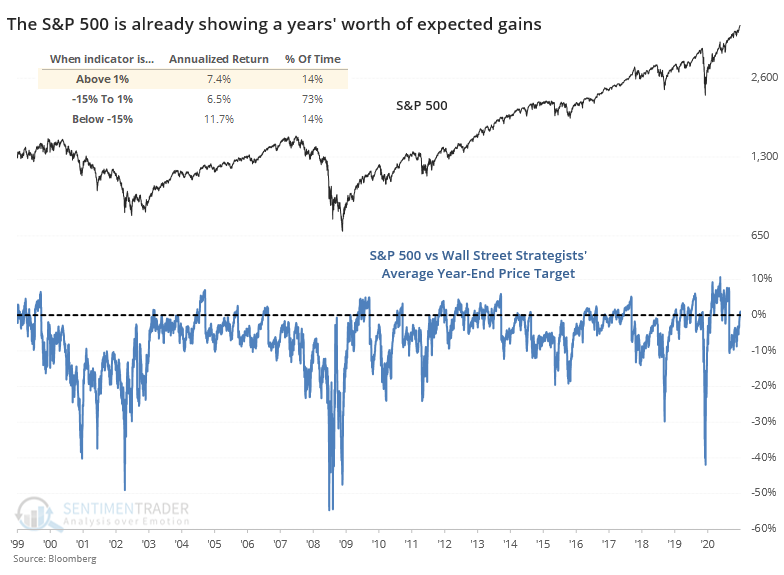
The more this travels above 0, the harder it gets to reach an even greater extreme, because strategists are more likely to upgrade their price targets the further the rally goes. That's why it cycles like it does, as professionals adjust their expectations based on current trends, much like the Economic Surprise Index.

The current minor overvaluation is coming after several months of the index trading below strategists' average price target. Below, we can see forward returns once it first exceeds its year-end price target after several months.

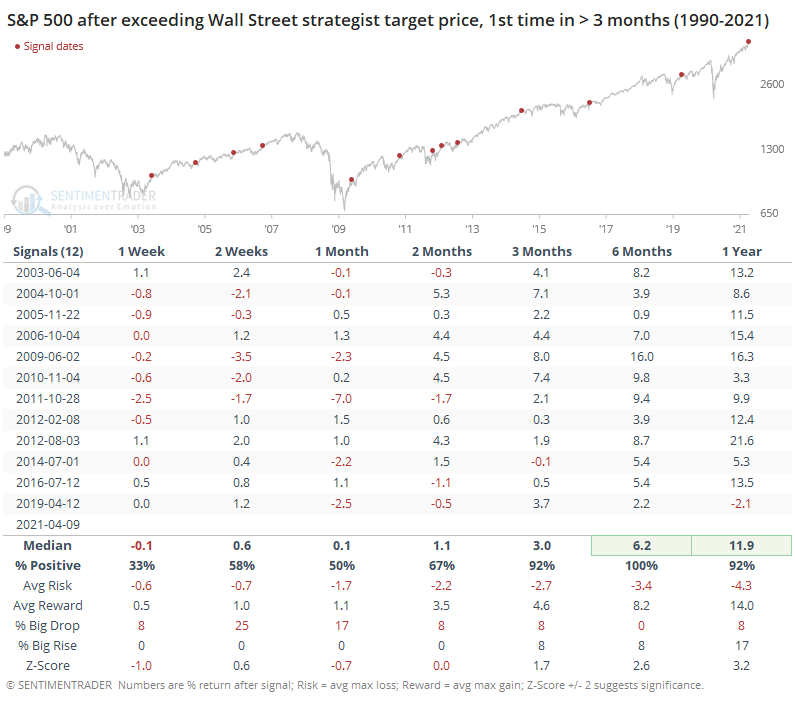
It's more common to see this happen later in the year. Only 2 out of the 12 signals triggered before June, not including the current one. The only other years when it triggered early in the year like this, in 2012 and 2019, the S&P had some trough holding its gains over the next 1-2 months. The usual caveats apply with such a tiny sample size.

Over the next 3-12 months, there were almost no losses and none of any consequence. This is not all that surprising given that it shows impressive momentum from the index, and impressive momentum tends to lead to positive medium- to long-term returns.

Shorter-term, it's more of a (minor) worry.

Sorry, you don't have access to this report

Upgrade your subscription plan to get access
Go to Dasboard
DATA &
TECHnologies
IndicatorEdge
‍
BackTestEdge
‍
Other Tools
‍
DataEdge API
RESEARCH
reports
Research Solution
‍
Reports Library
‍
actionable
Strategies
Trading Strategies
‍
Smart Stock Scanner
‍
FREE
RESOUrCES
Simple Backtest
Calculator
Simple Seasonality
Calculator
The Kelly Criterion
Calculator
Sentiment Geo Map
‍
Public Research Reports
‍
Free Webinar
COMPANY
‍
About
‍
Meet our Team
‍
In the News
‍
Testimonials
‍
Client Success Stories
Pricing
Bundle pricing
‍
Announcements
‍
FAQ
© 2024 Sundial Capital Research Inc. All rights reserved.
Setsail Marketing
TermsPrivacyAffiliate Program
Risk Disclosure: Futures and forex trading contains substantial risk and is not for every investor. An investor could potentially lose all or more than the initial investment. Risk capital is money that can be lost without jeopardizing ones’ financial security or life style. Only risk capital should be used for trading and only those with sufficient risk capital should consider trading. Past performance is not necessarily indicative of future results.

Hypothetical Performance Disclosure: Hypothetical performance results have many inherent limitations, some of which are described below. No representation is being made that any account will or is likely to achieve profits or losses similar to those shown; in fact, there are frequently sharp differences between hypothetical performance results and the actual results subsequently achieved by any particular trading program. One of the limitations of hypothetical performance results is that they are generally prepared with the benefit of hindsight. In addition, hypothetical trading does not involve financial risk, and no hypothetical trading record can completely account for the impact of financial risk of actual trading. for example, the ability to withstand losses or to adhere to a particular trading program in spite of trading losses are material points which can also adversely affect actual trading results. There are numerous other factors related to the markets in general or to the implementation of any specific trading program which cannot be fully accounted for in the preparation of hypothetical performance results and all which can adversely affect trading results.

Testimonial Disclosure: Testimonials appearing on this website may not be representative of other clients or customers and is not a guarantee of future performance or success.