Data &
Technology
Research
Reports
Report Solutions
Reports Library
Actionable
Strategies
Free
Resources
Simple Backtest Calculator
Simple Seasonality Calculator
The Kelly Criterion Calculator
Sentiment Geo Map
Public Research Reports
Free Webinar
Pricing
Company
About
Meet Our Team
In the News
Testimonials
Client Success Stories
Contact
Log inLoginSign up
< BACK TO ALL REPORTS

Volume pops as volatility drops

Jason Goepfert
2021-02-16
Volume and volatility usually go hand-in-hand, rising and falling together. Not now, as volume has spiked even as volatility has plunged.

Bloomberg notes an interesting divergence - volume across U.S. exchanges is soaring higher even while implied volatility ("fear") plunges. There is a very close positive correlation between the two, so this is highly unusual. 

If we look at each of them compared to their ranges over the past 200 days, they're at opposite extremes.

Volume is high while VIX volatility is low

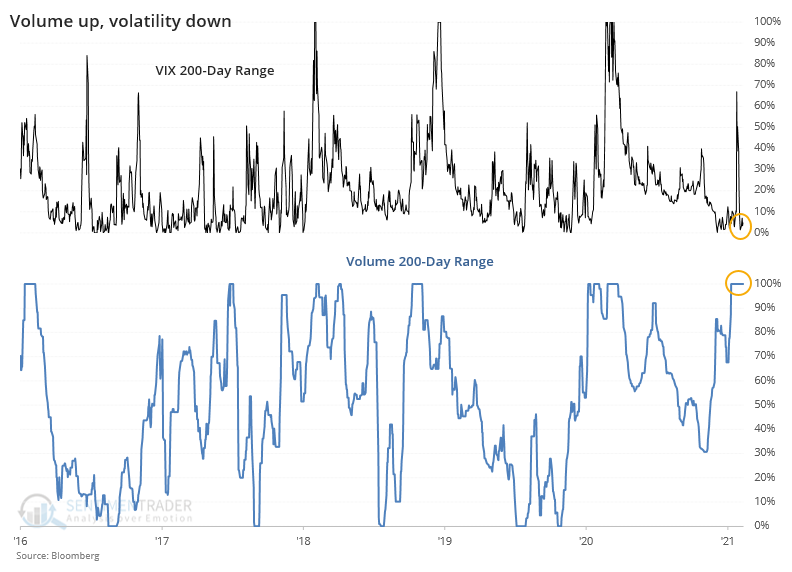
That means that the difference between them is nearly 100% (volume near 100% of its range and VIX near 0% of its range).  

This didn't mean much in 2017 as stocks went on to enjoy many months of a creeper uptrend. That wasn't so much the case with the other times this triggered, as most of them suffered losses over the next couple of months.


What else we're looking at

  • A more in-depth look at volatility versus volume
  • Another quirk with the 20-year cycle in stocks
  • What happens when there is a wide spread between optimistic and pessimistic indicators

Stat Box

On Friday, more than 50% of the core indicators we've tracked since 1999 were above their optimistic thresholds, while exactly 0% were below their pessimistic thresholds. This marks the first time since January 2020, and only the 9th day since 1999, when this has triggered.


Sentiment from other perspectives

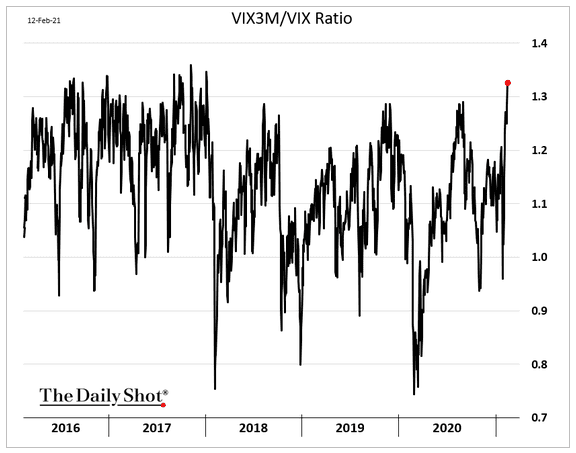
Volatility is a worry for later. Options traders are pricing in a larger probability of higher volatility 3 months from now versus volatility now. It's a sign of immediately complacency. Source: Daily Shot

vix futures curve

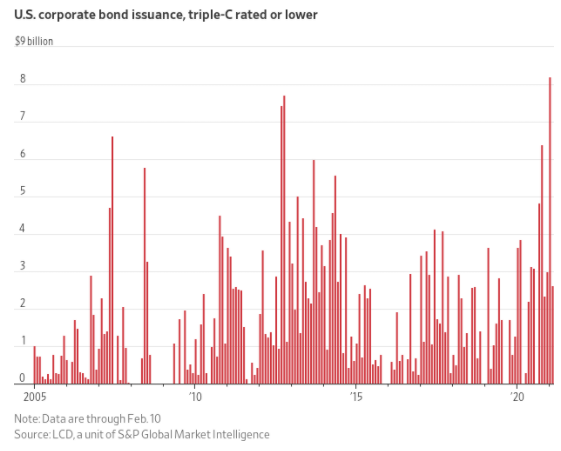
The riskiest investments get the most attention. Investors are in the part of the cycle where they're focusing heavily on trading the most speculative stocks and derivatives, and absorbing debt from the riskiest corporate borrowers. There has never before been such appetite to accept such low yields from such shaky borrowers. Source: Wall Street Journal

ccc rate debt issuance

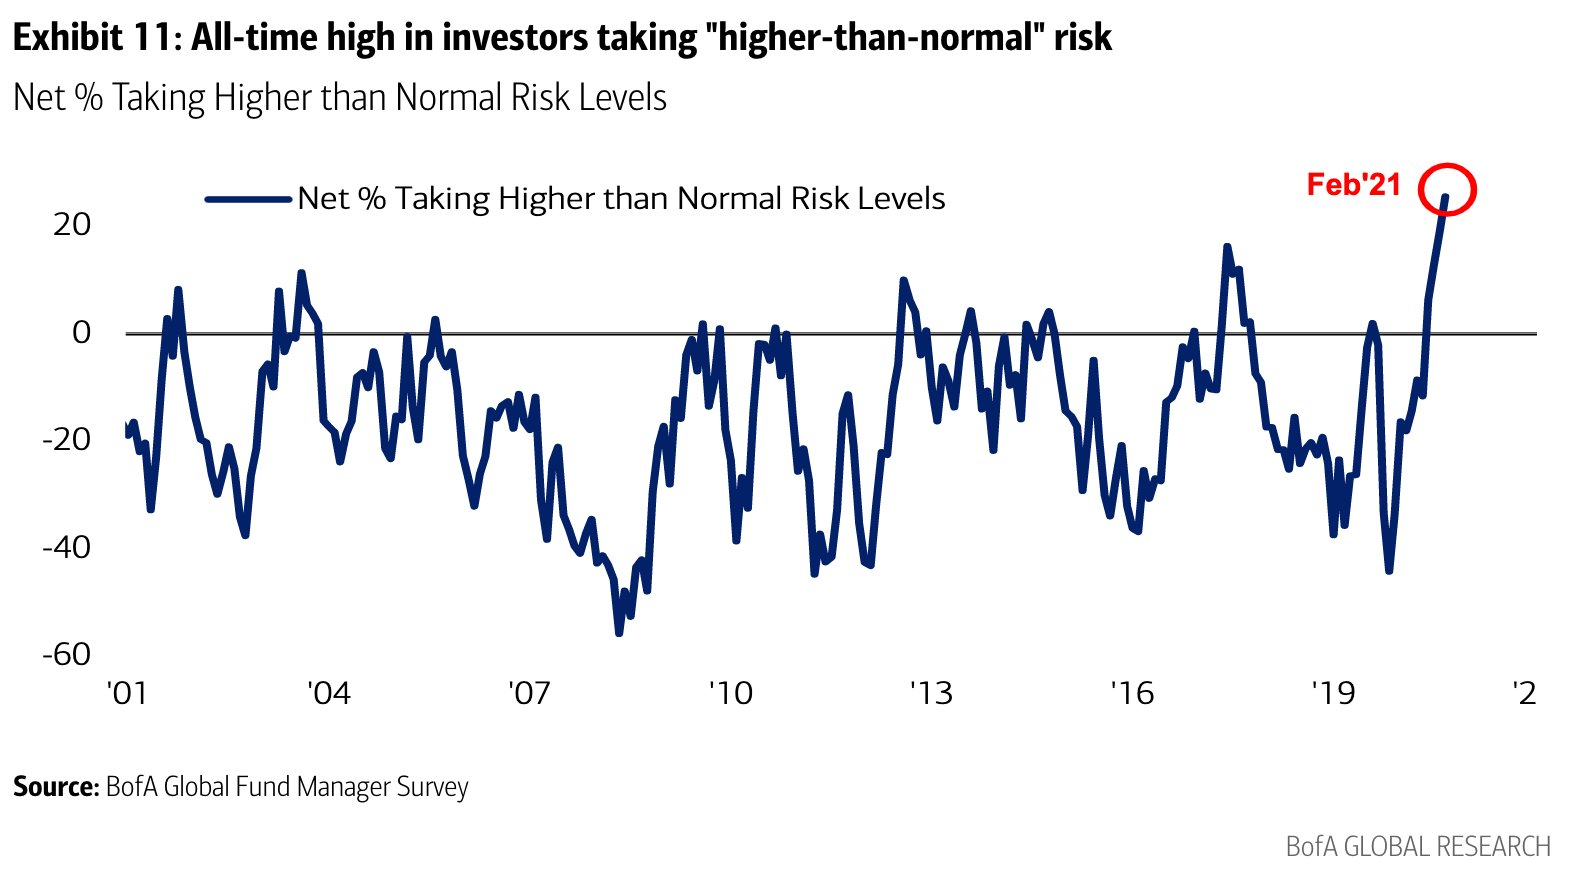
Even fund managers aren't immune. According to a monthly survey of big money managers from Bank of America, they've never been more willing to take risk. Source: BofA via Robin Wigglesworth

bank of america fund manager survey risk

DATA &
TECHnologies
IndicatorEdge
‍
BackTestEdge
‍
Other Tools
‍
DataEdge API
RESEARCH
reports
Research Solution
‍
Reports Library
‍
actionable
Strategies
Trading Strategies
‍
Smart Stock Scanner
‍
FREE
RESOUrCES
Simple Backtest
Calculator
Simple Seasonality
Calculator
The Kelly Criterion
Calculator
Sentiment Geo Map
‍
Public Research Reports
‍
Free Webinar
COMPANY
‍
About
‍
Meet our Team
‍
In the News
‍
Testimonials
‍
Client Success Stories
Pricing
Bundle pricing
‍
Announcements
‍
FAQ
© 2024 Sundial Capital Research Inc. All rights reserved.
Setsail Marketing
TermsPrivacyAffiliate Program
Risk Disclosure: Futures and forex trading contains substantial risk and is not for every investor. An investor could potentially lose all or more than the initial investment. Risk capital is money that can be lost without jeopardizing ones’ financial security or life style. Only risk capital should be used for trading and only those with sufficient risk capital should consider trading. Past performance is not necessarily indicative of future results.

Hypothetical Performance Disclosure: Hypothetical performance results have many inherent limitations, some of which are described below. No representation is being made that any account will or is likely to achieve profits or losses similar to those shown; in fact, there are frequently sharp differences between hypothetical performance results and the actual results subsequently achieved by any particular trading program. One of the limitations of hypothetical performance results is that they are generally prepared with the benefit of hindsight. In addition, hypothetical trading does not involve financial risk, and no hypothetical trading record can completely account for the impact of financial risk of actual trading. for example, the ability to withstand losses or to adhere to a particular trading program in spite of trading losses are material points which can also adversely affect actual trading results. There are numerous other factors related to the markets in general or to the implementation of any specific trading program which cannot be fully accounted for in the preparation of hypothetical performance results and all which can adversely affect trading results.

Testimonial Disclosure: Testimonials appearing on this website may not be representative of other clients or customers and is not a guarantee of future performance or success.