Data &
Technology
Research
Reports
Report Solutions
Reports Library
Actionable
Strategies
Free
Resources
Simple Backtest Calculator
Simple Seasonality Calculator
The Kelly Criterion Calculator
Sentiment Geo Map
Public Research Reports
Free Webinar
Pricing
Company
About
Meet Our Team
In the News
Testimonials
Client Success Stories
Contact
Log inLoginSign up
< BACK TO ALL REPORTS

Volatility Spikes as Stocks Gyrate Near Highs

Jason Goepfert
2021-10-12
Even though the S&P 500 hasn't suffered much of a pullback, it's the longest one of the year. And the index's volatility over the past 10 days is the highest in 90 days, suggesting the possibility of a new, more volatile, environment.

For those who were indoctrinated on technical analysis textbooks, we were taught that when stocks turn volatile during a bull market, then trouble is brewing.

Unfortunately, much of what passes for knowledge in that community is based on pretty pictures, unfounded heuristics, and cherry-picked examples. Almost nothing in the entire canon is consistently predictive.

The idea that it's bearish to see volatility after stocks make a big run is yet another one of those incorrect assumptions.

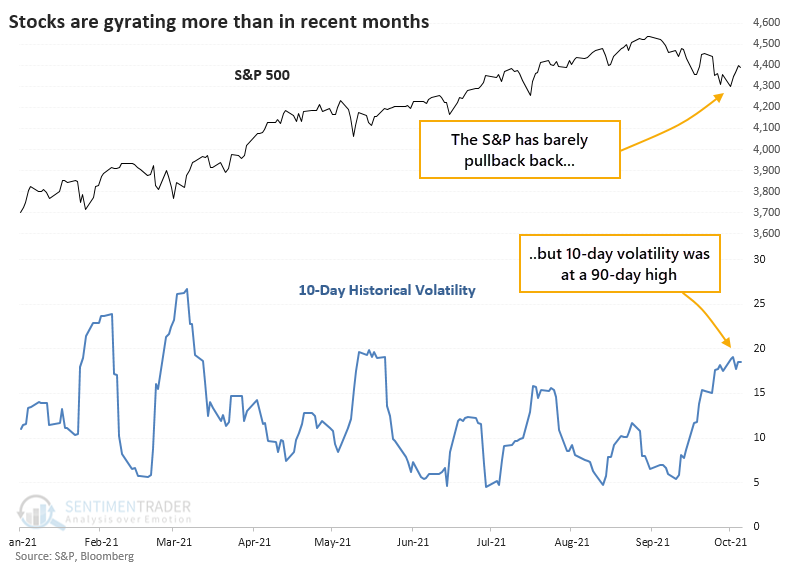
It's an issue now because the S&P 500 is mired in its longest pullback in a year. Despite a relatively shallow pullback, though, the index has been gyrating wildly, with over a week of days with 1% daily moves. That has pushed the index's 10-day realized volatility to a 90-day high.

Instead of reading tea leaves, let's look at the evidence. The table below shows every time when the S&P was within 30 days of a multi-year high, no more than 5% from its peak, and yet its 10-day volatility rose to a 90-day high.

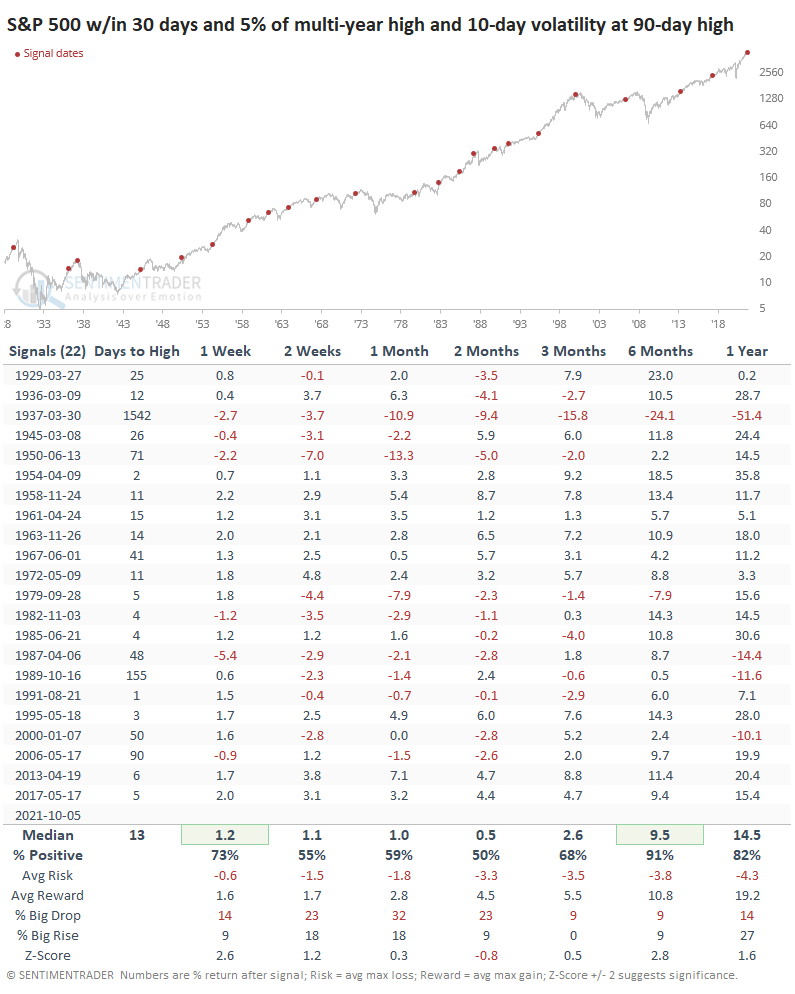
To be fair, the S&P's returns over the next two months were nothing special. It showed a positive return only half the time, with a median return well below random. But that was about it for the bearish side of things.

Over the next six months, the index rose after 20 out of 22 signals. More specifically, only one of the signals preceded an imminent bear market, which is what this heightened volatility was supposed to tip us off to. Granted, several of the other signals ultimately led to a protracted decline, but they were months if not years away.

On average, it took 13 trading days until the S&P recorded its next multi-year high. Out of the 22 signals, only 2 of them took longer than 90 days and 15 of them took fewer than 30 days.

As we head into earnings season, the uptick in volatility may be the tipping point before we finally suffer through an honest-to-goodness correction. We try hard to deal in probabilities instead of possibilities, though, and based solely on the rise in volatility, it's not a good reason in and of itself to batten the hatches just yet.

Sorry, you don't have access to this report

Upgrade your subscription plan to get access
Go to Dasboard
DATA &
TECHnologies
IndicatorEdge
‍
BackTestEdge
‍
Other Tools
‍
DataEdge API
RESEARCH
reports
Research Solution
‍
Reports Library
‍
actionable
Strategies
Trading Strategies
‍
Smart Stock Scanner
‍
FREE
RESOUrCES
Simple Backtest
Calculator
Simple Seasonality
Calculator
The Kelly Criterion
Calculator
Sentiment Geo Map
‍
Public Research Reports
‍
Free Webinar
COMPANY
‍
About
‍
Meet our Team
‍
In the News
‍
Testimonials
‍
Client Success Stories
Pricing
Bundle pricing
‍
Announcements
‍
FAQ
© 2024 Sundial Capital Research Inc. All rights reserved.
Setsail Marketing
TermsPrivacyAffiliate Program
Risk Disclosure: Futures and forex trading contains substantial risk and is not for every investor. An investor could potentially lose all or more than the initial investment. Risk capital is money that can be lost without jeopardizing ones’ financial security or life style. Only risk capital should be used for trading and only those with sufficient risk capital should consider trading. Past performance is not necessarily indicative of future results.

Hypothetical Performance Disclosure: Hypothetical performance results have many inherent limitations, some of which are described below. No representation is being made that any account will or is likely to achieve profits or losses similar to those shown; in fact, there are frequently sharp differences between hypothetical performance results and the actual results subsequently achieved by any particular trading program. One of the limitations of hypothetical performance results is that they are generally prepared with the benefit of hindsight. In addition, hypothetical trading does not involve financial risk, and no hypothetical trading record can completely account for the impact of financial risk of actual trading. for example, the ability to withstand losses or to adhere to a particular trading program in spite of trading losses are material points which can also adversely affect actual trading results. There are numerous other factors related to the markets in general or to the implementation of any specific trading program which cannot be fully accounted for in the preparation of hypothetical performance results and all which can adversely affect trading results.

Testimonial Disclosure: Testimonials appearing on this website may not be representative of other clients or customers and is not a guarantee of future performance or success.