Data &
Technology
Research
Reports
Report Solutions
Reports Library
Actionable
Strategies
Free
Resources
Simple Backtest Calculator
Simple Seasonality Calculator
The Kelly Criterion Calculator
Sentiment Geo Map
Public Research Reports
Free Webinar
Pricing
Company
About
Meet Our Team
In the News
Testimonials
Client Success Stories
Contact
Log inLoginSign up
< BACK TO ALL REPORTS

Volatility Spike - What Happens Next

Jason Goepfert
2019-08-12
null

One and done

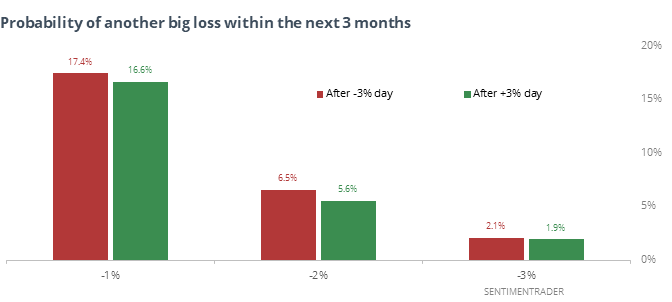
Monday’s session was notable for several reasons, mainly its shocking quality after investors became accustomed to much smaller moves. Wall Street generally believes this is not a “one and done” and there is more volatility to come.

Historically, the argument for that is not clear-cut. The probability of a big down day following a huge one-day loss is not that much greater than the probability of seeing one after a huge one-day gain.

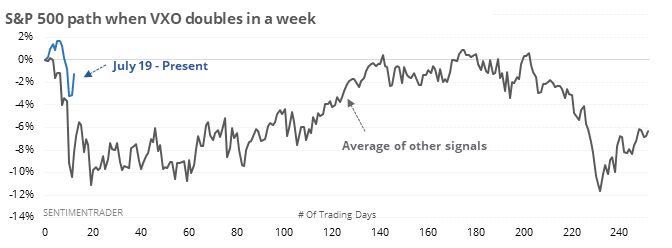
The jump in volatility has led traders to think volatility will get even more extreme in the weeks ahead. The old VIX calculation (VXO) has doubled in the past week. After other times that happened, the S&P's path was relatively consistent during the next 3-6 months.

Lows relax

The spike in 52-week lows among securities trading on the NYSE earlier this week was disturbing since it came so soon after the S&P 500 had been at a new high.

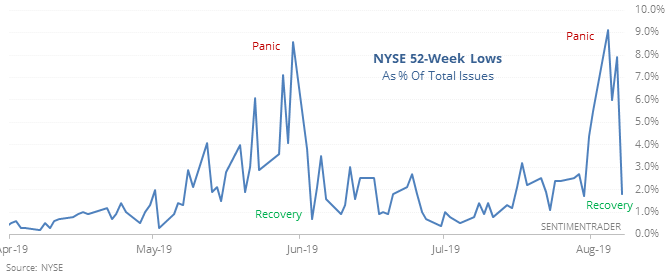
But the new low list has already collapsed, easing concerns that we were on the edge of a precipitous decline. When this happened previously, it didn’t eliminate shorter-term risk, but the S&P’s returns going forward were generally above average. The best performance was over the next six months, with only two losses, of them small.

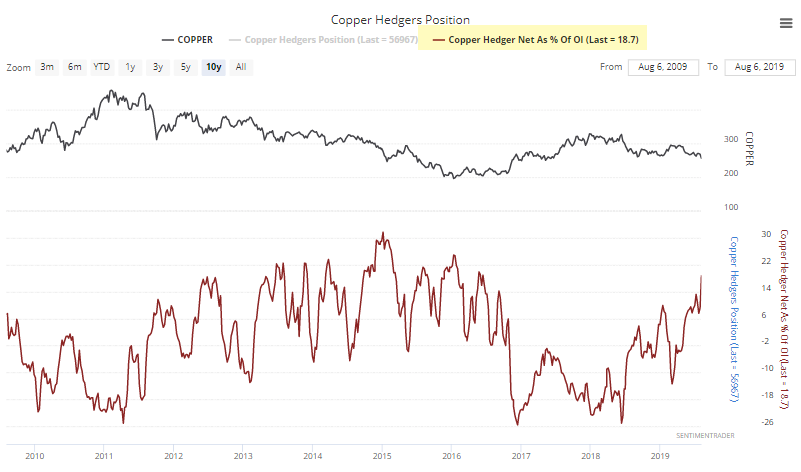
The latest Commitments of Traders report was released, covering positions through Tuesday

The 3-Year Min/Max Screen shows that smart-money hedgers moved to new multi-year highs in exposure to copper, cotton, and natural gas (and nearly the British pound), while selling Eurodollars. Their position in copper is now the largest in history at nearly 57,000 contracts. But it’s only 18.7% of open interest, well below prior extremes (you can see that by clicking the “Choose a Secondary indicator” drop-down box). Many of the sustained lows in the metal have come when hedgers held more than 25% of open interest net long.

They’re also now holding more than 50% of open interest in gold net short. Since the 2011 peak, this only happened in October – December 2012 and June – September 2016.

This post was an abridged version of our previous day's Daily Report. For full access, sign up for a 30-day free trial now.

DATA &
TECHnologies
IndicatorEdge
‍
BackTestEdge
‍
Other Tools
‍
DataEdge API
RESEARCH
reports
Research Solution
‍
Reports Library
‍
actionable
Strategies
Trading Strategies
‍
Smart Stock Scanner
‍
FREE
RESOUrCES
Simple Backtest
Calculator
Simple Seasonality
Calculator
The Kelly Criterion
Calculator
Sentiment Geo Map
‍
Public Research Reports
‍
Free Webinar
COMPANY
‍
About
‍
Meet our Team
‍
In the News
‍
Testimonials
‍
Client Success Stories
Pricing
Bundle pricing
‍
Announcements
‍
FAQ
© 2024 Sundial Capital Research Inc. All rights reserved.
Setsail Marketing
TermsPrivacyAffiliate Program
Risk Disclosure: Futures and forex trading contains substantial risk and is not for every investor. An investor could potentially lose all or more than the initial investment. Risk capital is money that can be lost without jeopardizing ones’ financial security or life style. Only risk capital should be used for trading and only those with sufficient risk capital should consider trading. Past performance is not necessarily indicative of future results.

Hypothetical Performance Disclosure: Hypothetical performance results have many inherent limitations, some of which are described below. No representation is being made that any account will or is likely to achieve profits or losses similar to those shown; in fact, there are frequently sharp differences between hypothetical performance results and the actual results subsequently achieved by any particular trading program. One of the limitations of hypothetical performance results is that they are generally prepared with the benefit of hindsight. In addition, hypothetical trading does not involve financial risk, and no hypothetical trading record can completely account for the impact of financial risk of actual trading. for example, the ability to withstand losses or to adhere to a particular trading program in spite of trading losses are material points which can also adversely affect actual trading results. There are numerous other factors related to the markets in general or to the implementation of any specific trading program which cannot be fully accounted for in the preparation of hypothetical performance results and all which can adversely affect trading results.

Testimonial Disclosure: Testimonials appearing on this website may not be representative of other clients or customers and is not a guarantee of future performance or success.