
VIX Drops With S&P; Friday-Monday Declines

We've been asked quite a bit about the VIX today. It's currently down more than 7% despite the S&P being lower by nearly 2%. There is a strong inverse correlation between the VIX and S&P. On average when the S&P is down by more than 2%, the VIX is higher by 15%.
So clearly today's move is highly unusual, and there is almost certainly "something" going on with S&P 500 options that is causing this. As we discussed several times over the past week, trading in volatility-related products has been exceptionally heavy and fund flows have been extreme in some cases. We could be seeing the tail wagging the dog to some extent, with traders' positions in VIX futures, options and ETF influencing how they are trading S&P 500 options, which would then impact the pricing of the VIX.
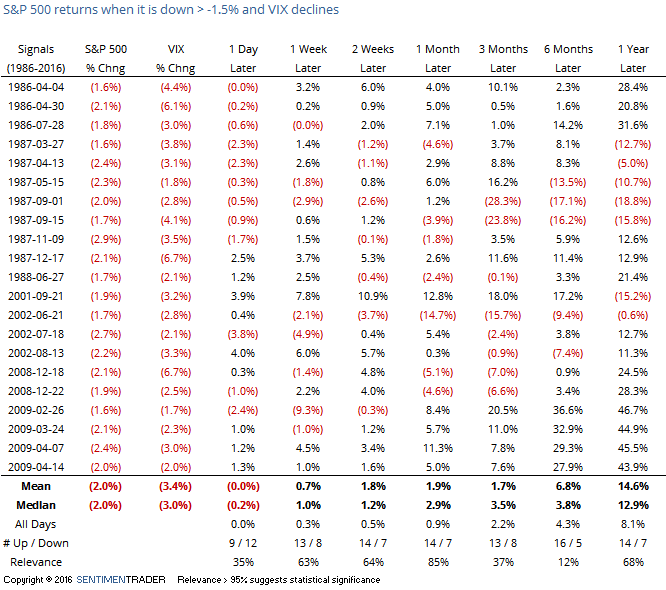
Just taking the price changes at face value, this would be one of the largest declines in the S&P 500 on a day the VIX also declined by any amount. The following table shows every date since 1986 that the VIX dropped on a day the S&P declined by 1.5% or more.
VIX data is more reliable after 1990, and from then through 2000, there wasn't a single occurrence. All of them post-1990 occurred during the 2001-2002 or 2007-2009 bear markets.
Prior to 1990, these moves led to short-term weakness almost every time. After 1990, they mostly led to gains, with the best returns two weeks later. Even though all of them occurred during bear markets, two weeks later the S&P was higher 8 out of 10 times.
Each of those times, the VIX was higher than 40 versus 25 currently, so that's another unusual wrinkle related today's activity. We're not reading a whole lot into this due to the extreme volume unusual trading in volatility products over the past week or so.
With early buyers not having success in propping up the S&P, it's on track for back-to-back 2% declines on a Friday-Monday, though it's coming back a bit at the moment. This is often a sign of panicked behavior bleeding over into a new week that is a sign of exhaustive selling pressure as we can see from the table below.
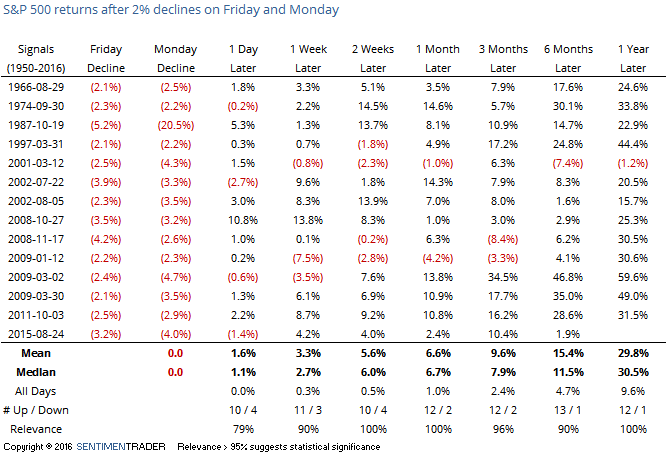
It has happened twice during this bull market, both leading to rallies of more than 4% over the next week. Prior to that, it most led to higher prices but there were some failures in there as well (January 2009 most painfully). The S&P's one-year returns were exceptional, but we don't put a lot of weight on long-term results stemming from short-term price patterns. We'd put the most weight on returns from 1 day through 3 months and not much beyond that.
Based on the prior Notes, the highest probability given Monday's decline is a bounce into Tuesday/Wednesday but also some testing (at least) of any potential low in the weeks ahead.