
VIX drops below 50-day average

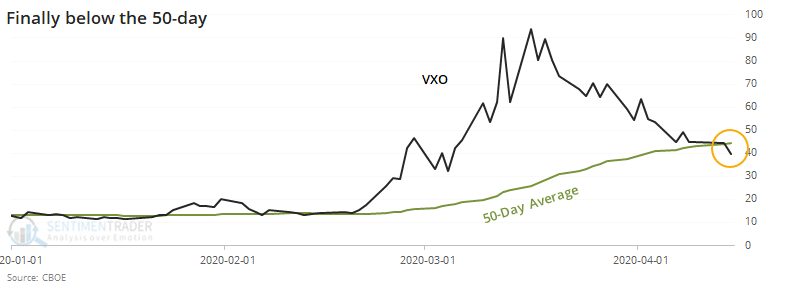
Volatility continues to seep lower, and the VIX "fear gauge" has shown signs of reversing its medium-term trend. For the first time in nearly two months, it has closed below its 50-day moving average, suggesting a regime of lower volatility ahead.
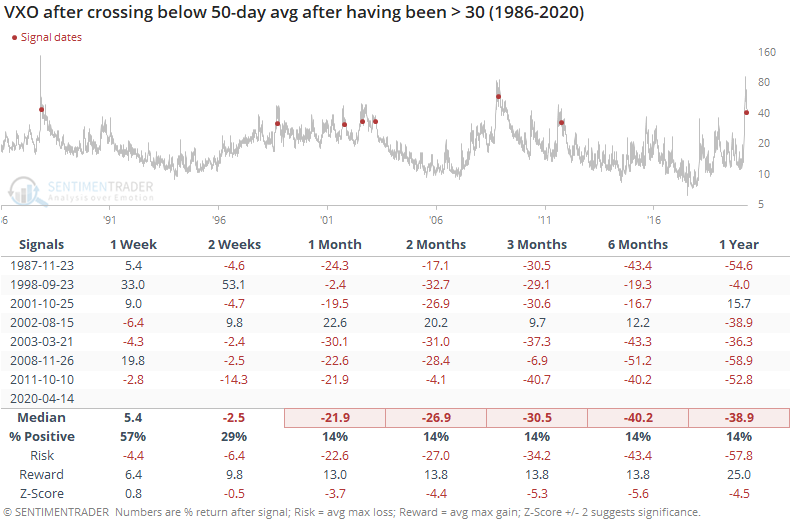
To get more history, we use the old VIX calculation (VXO).
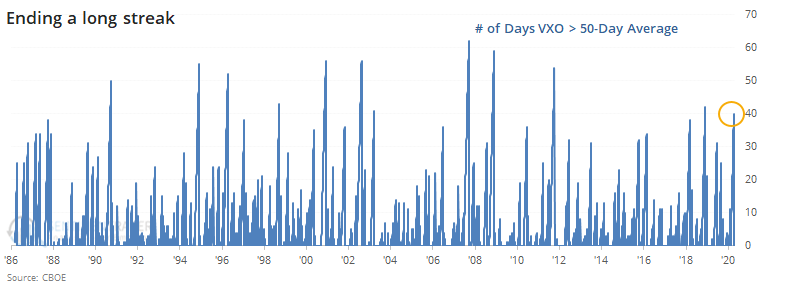
This ends one of the longer streaks above its 50-day average since 1986.
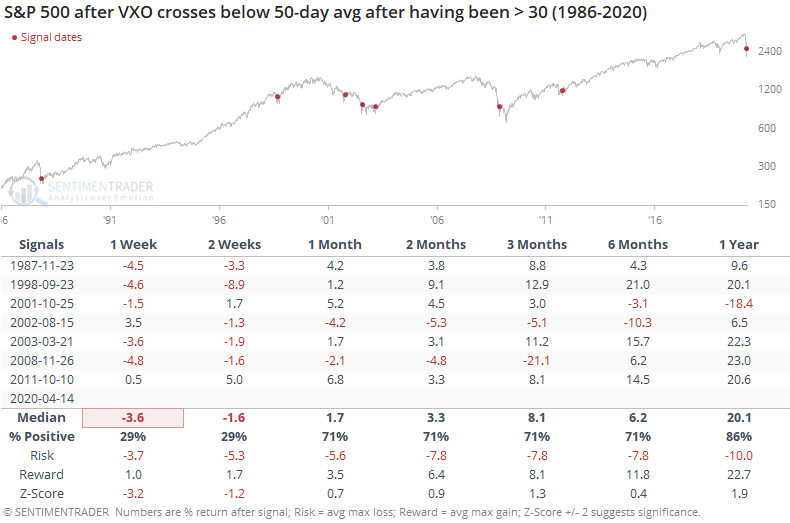
One the VXO has dropped below its 50-day after having been above it for at least 30 days, with a high of at least 30 during its streak, the S&P 500 has usually struggled in the short-term, with some big swings. But it was typically a sign that the most of the losses were behind.
The thumbnail charts show just how volatile the next few weeks tended to be, with almost immediate losses, then a recovery.
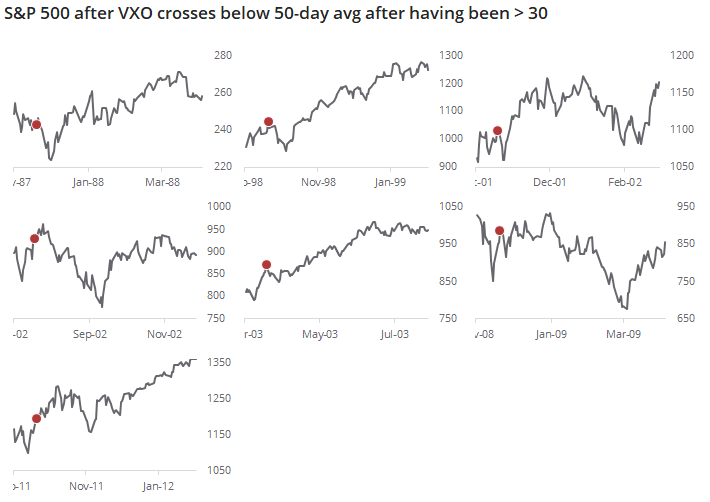
For the VXO itself, it was mostly the opposite pattern, with a jump during the next week, then solid losses.
This is further sign of a lasting recovery, but doesn't say much about the near-term risk to those who are just now trying to jump in.