
Value over growth still looks good

Key points:
- Domestic sector and industry relative trend scores favor value and resource-oriented groups
- On a worldwide basis, emerging market countries have the highest relative trend scores
- From a regional perspective, South America ranks high, and Asia-Pacific looks unfavorable
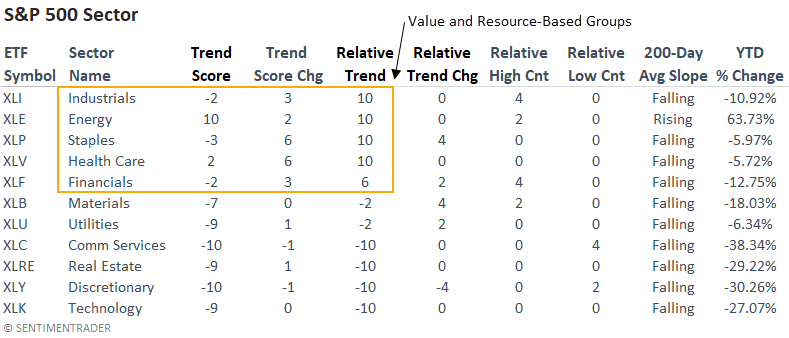
Value and resource-based sectors and industries score the highest on a relative basis
While it's not a surprise to see defensive sectors like Consumer Staples and Health Care with high relative scores, the rankings for value and resource-based sectors, like Industrials, Energy, and Financials, are interesting, especially Industrials. One has to go back to March 2001 (Dotcom bust) to find the last time industrials had a relative trend score of 10, with the S&P 500 down a like amount from the high.
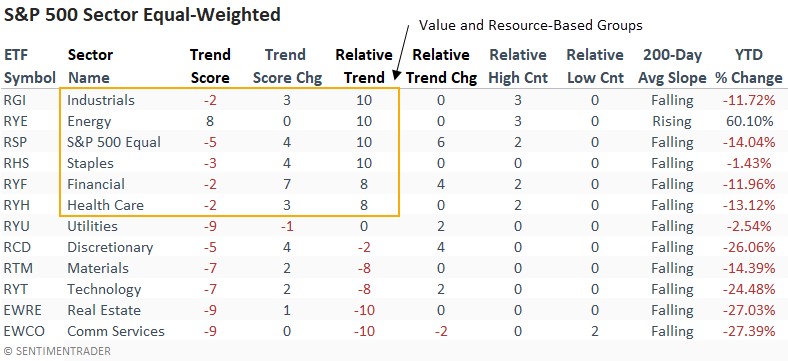
The equal-weighted relative scores, which provide an unbiased assessment of trends, confirm the value and resourced-based strength in the cap-weighted rankings.
A perfect relative score for the S&P 500 equal-weighted ETF indicates that the average stock is doing better than the cap-weighted S&P 500.
Mega-cap Technology and Communication Services stocks are weighing on S&P 500 performance.
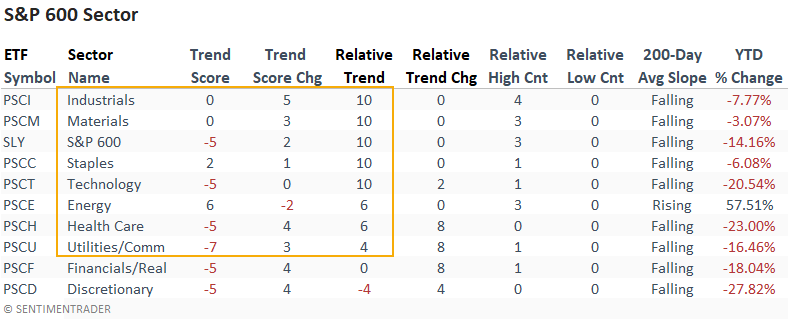
Small-caps, including Technology, show strong relative trend scores versus the S&P 500. As with large-caps, Industrials have a perfect relative score and registered a 21-day relative high versus the S&P 500 in 4 out of 5 sessions.
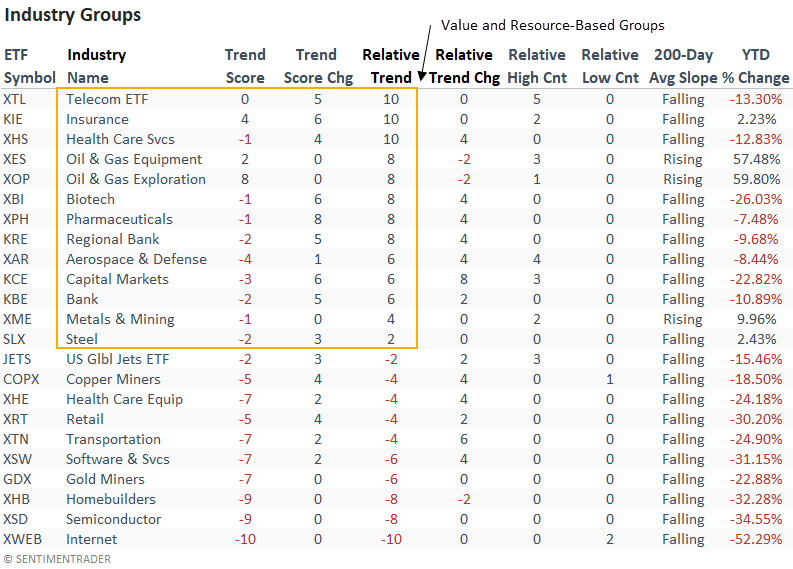
Industry ETF rankings, which are influenced more by small-cap stocks, provide a similar message to the sector rankings. The one outlier in the value-dominated rankings is the equal-weighted Biotech ETF (XBI).
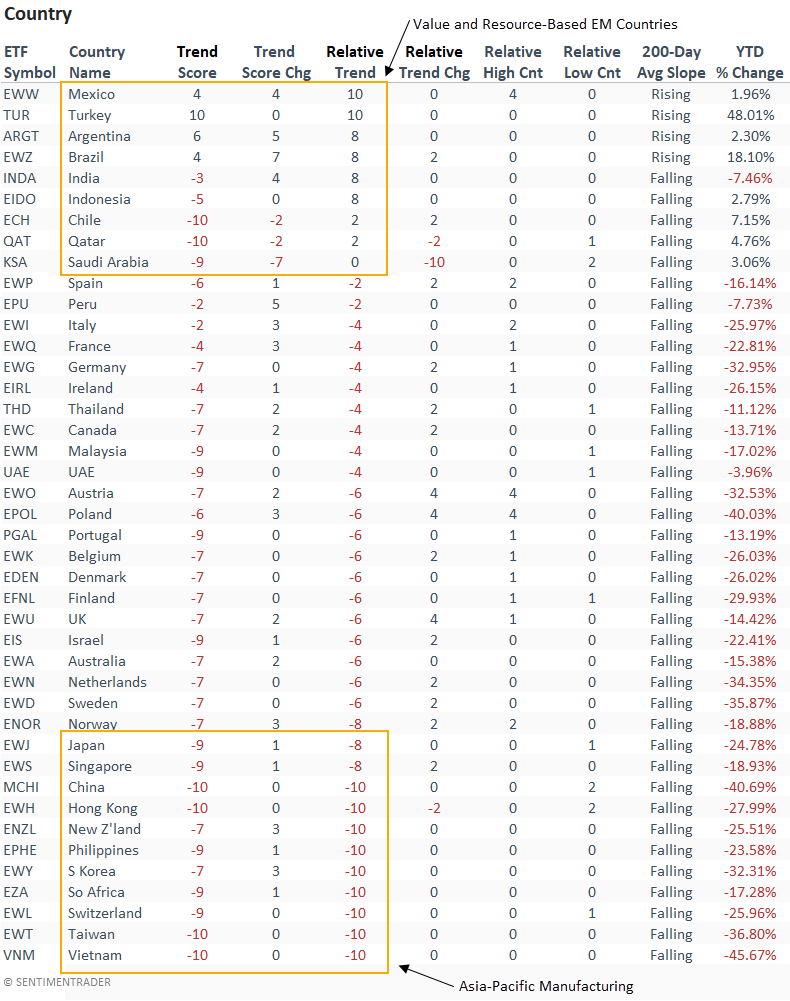
Emerging market country ETFs with a value or resource-based weighting look the best
Whether the strong dollar, war or Covid related issues in China, opportunities around the globe have been few and far between. However, several emerging market countries show strong relative trend scores versus the S&P 500. Remember, an emerging market ETF like EEM contains a considerable allocation to China, which currently ranks -10 on an absolute and relative basis.
It would be best if you drilled down to individual countries for opportunities.
From a regional perspective, South America looks constructive. At the same time, the manufacturing/export-driven Asia-Pacific area contains several countries with unfavorable rankings.
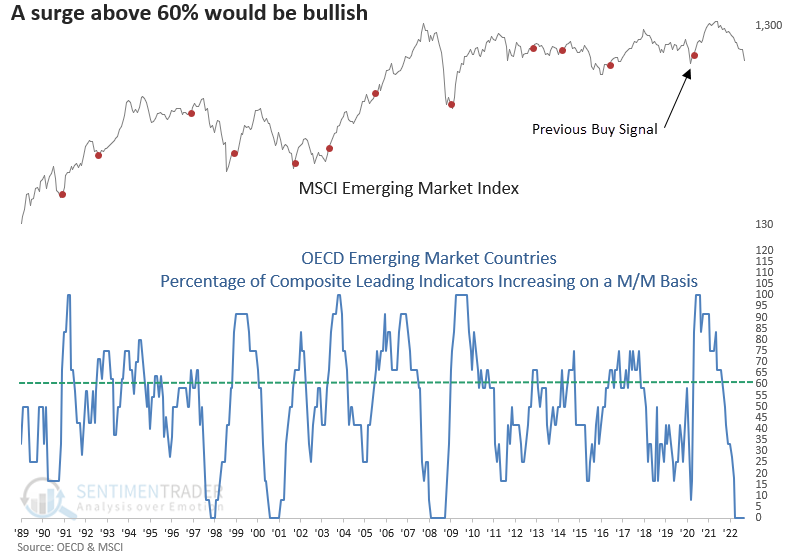
What would get me excited about emerging markets
The Composite Leading Indicators (CLI) from the Organization for Economic Co-Operation and Development (OECD) is an excellent time series for identifying a trough in the economic cycle. I monitor an LEI diffusion index for all countries and one for emerging markets. With the diffusion index pinned at zero, the next buy signal will occur when the indicator surges above 60%. Stay tuned.
What the research tells us...
Domestic sector and industry ETFs exhibiting the highest relative trend scores maintain heavier weightings toward value and natural resource-based stocks. As we've seen of late, especially during earnings season, Technology and Consumer Discretionary members are weighing on S&P 500 performance. While the value and resource trend can continue, an economic contraction would likely be a game changer. Remember how Energy was the last man standing in 2008? On a global basis, several emerging market countries look constructive on a relative basis, especially ones in South America. The severe underperformance in the Asia-Pacific region appears to have no end in sight. I would wait for Composite Leading Indicators to turn up from depressed levels before considering an allocation to that region.
Absolute and relative trend column definitions
- Absolute Trend Count Score - The absolute trend model contains ten indicators to assess absolute trends across several durations.
- Absolute Trend 5-Day Change - This indicator measures the 5-day net change in the absolute trend model.
- Relative Trend Count Score - The relative trend model contains ten indicators to assess relative trends vs. the S&P across durations.
- Relative Trend 5-Day Change - This indicator measures the 5-day net change in the relative trend model.
- Relative High Count - This indicator measures the number of 21-day relative highs vs. the S&P 500 in the last five days.
- Relative Low Count - This indicator measures the number of 21-day relative lows vs. the S&P 500 in the last five days.
- 200-Day Avg Slope - This indicator measures whether the 200-day moving average is rising or falling.
- Absolute and Relative Trend Scores range from 10 (Best) to -10 (Worst)
Please click here for a note with details on the construction of the composite trend model.