Data &
Technology
Research
Reports
Report Solutions
Reports Library
Actionable
Strategies
Free
Resources
Simple Backtest Calculator
Simple Seasonality Calculator
The Kelly Criterion Calculator
Sentiment Geo Map
Public Research Reports
Free Webinar
Pricing
Company
About
Meet Our Team
In the News
Testimonials
Client Success Stories
Contact
Log inLoginSign up
< BACK TO ALL REPORTS

Utilities strength

Troy Bombardia
2020-10-07
Utility stocks have rallied in recent days, accompanied by a surge in breadth. ETF traders have been fleeing, but corporate insiders have never had fewer sales among companies in the sector. These kinds of developments have usually been a shorter-term negative and longer-term positive.

NOTE: This was originally published earlier by Troy. I have added to the post at the end with the tag [Jason].

The past few days have seen U.S. stocks chop up and down. One of the few exceptions has been the utilities sector, which on a total return basis reached the highest level since the March crash:

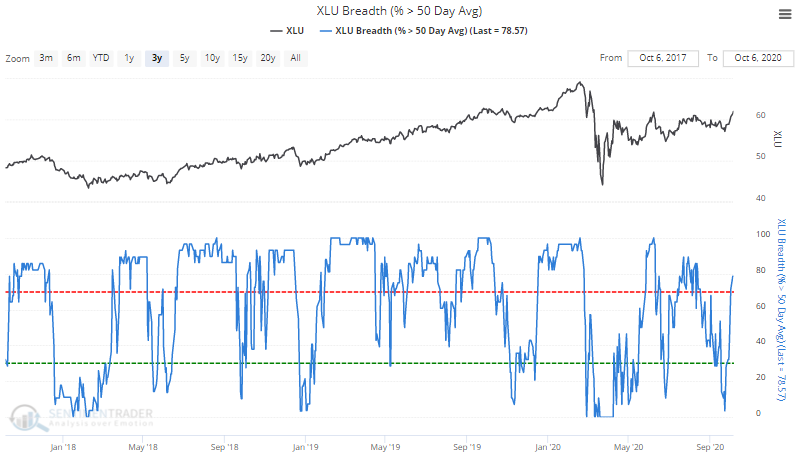
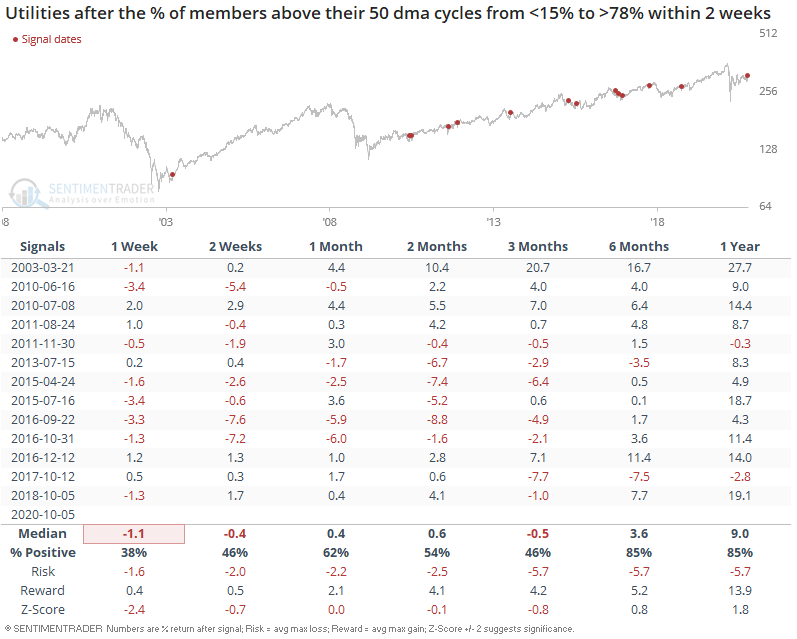
As a result, the % of utilities stocks above their 50 dma surged from less than 15% to greater than 78% within 2 weeks. When the utilities sector rebounded this quickly in the past, it usually took a breather over the next 1-2 weeks:

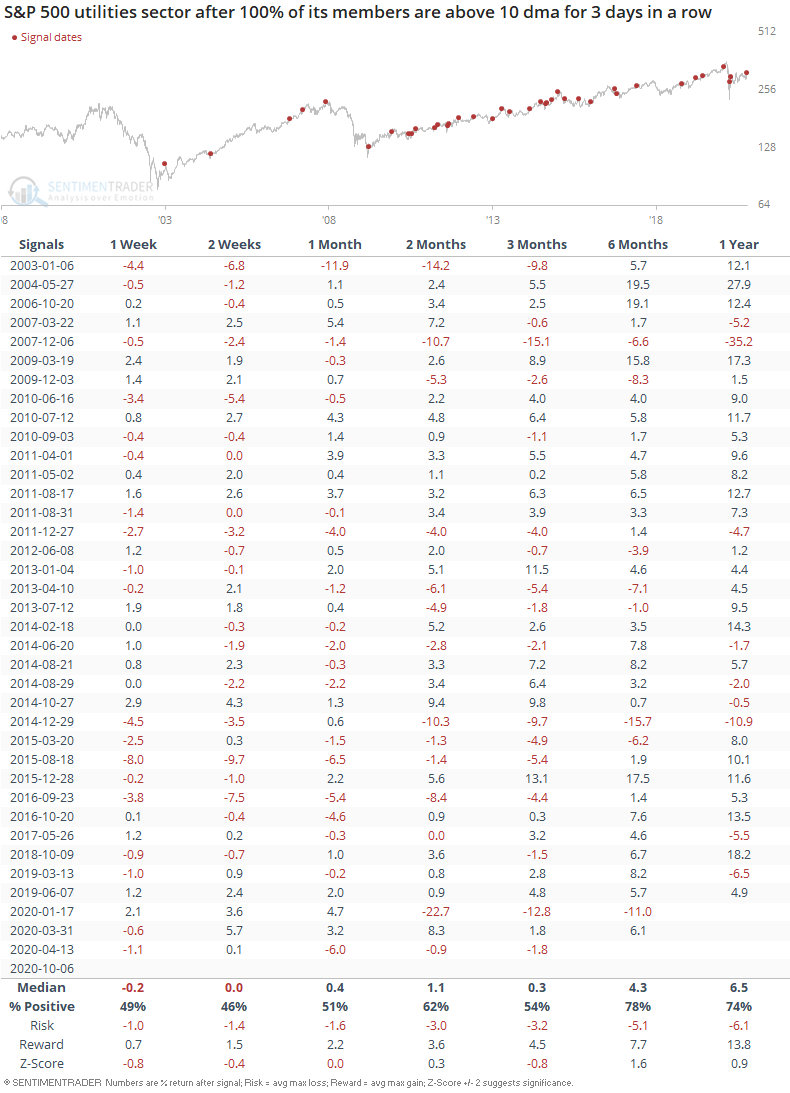
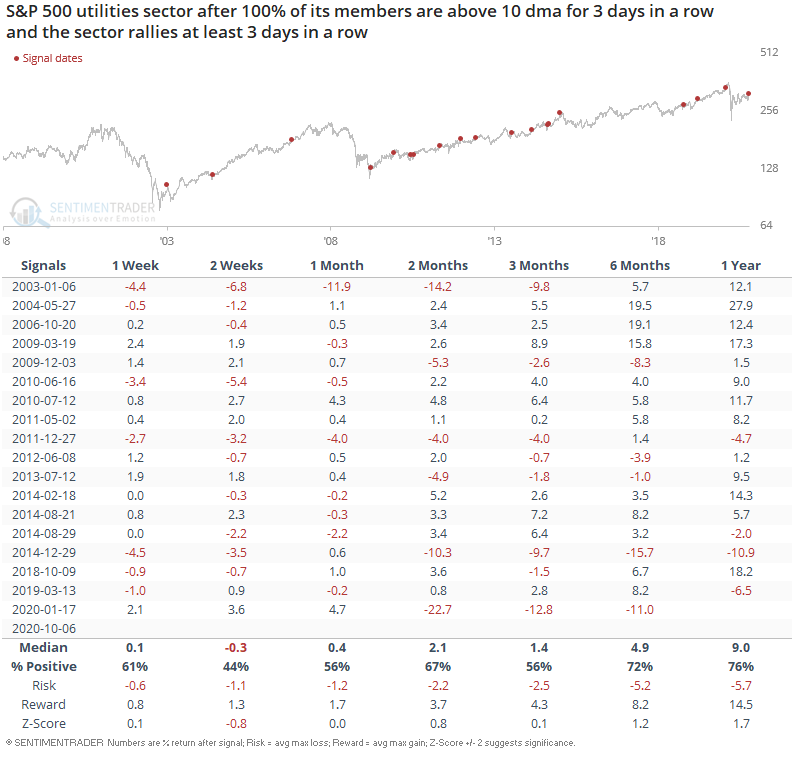
The recent strength in utilities saw 3 consecutive days in which all utilities stocks were above their 10 dma:

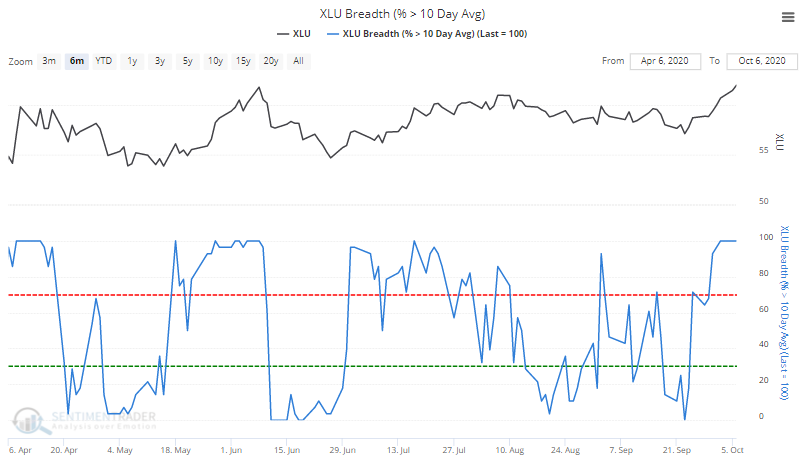
On its own, this is a bit of a mixed signal:

But when combined with the fact that utilities are up 5 days in a row, such a strong show of momentum usually saw the utilities sector rally further over the next year:

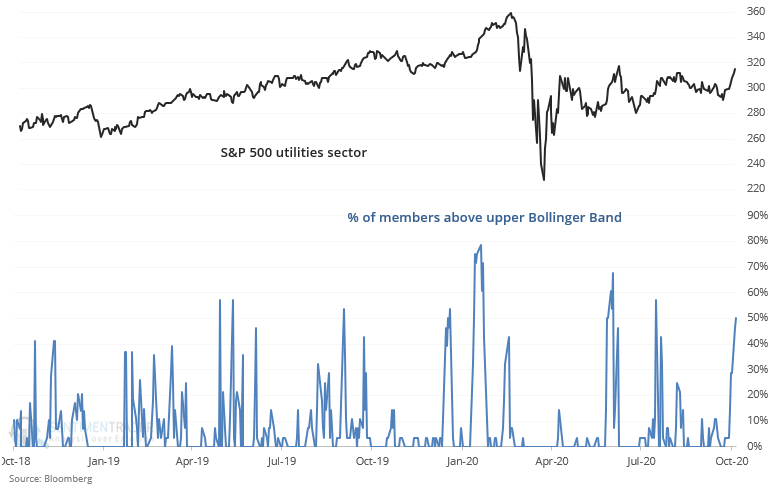
And lastly, half of the utilities sector are above their upper Bollinger Band. 

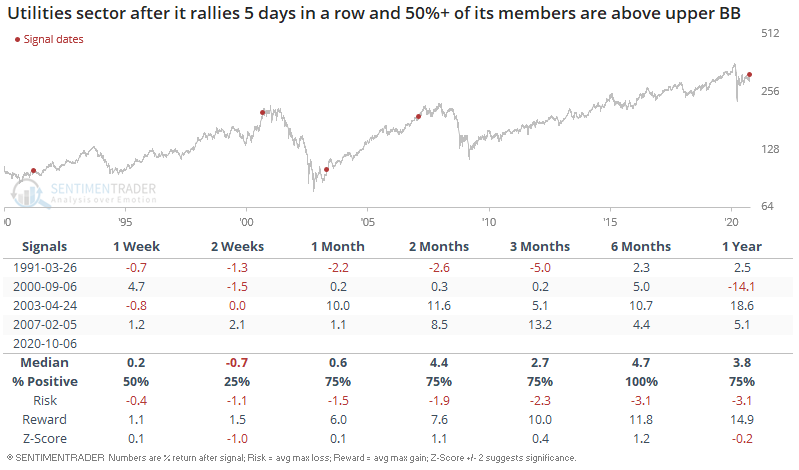
When this happened while the utilities sector rallied 5 days in a row, 3 out of 4 historical cases saw weakness over the next 1-2 weeks:

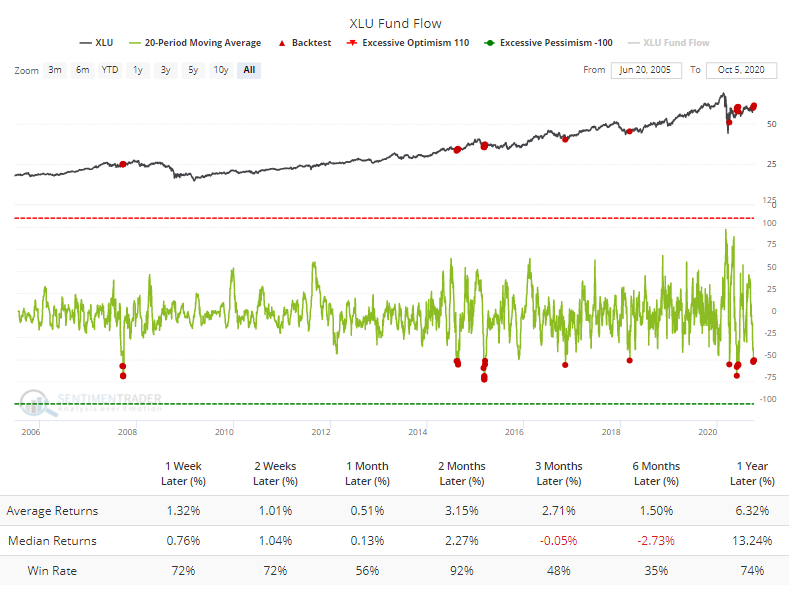
[Jason] Despite the mostly impressive performance of these stocks, ETF traders have been pulling out. The XLU fund has seen an average of more than $50 million per day leaving the fund over the past month. The Backtest Engine shows this was typically a contrary indicator, though the 3-6 month time frame was sketchy.

Among corporate insiders at utility companies, buying transactions have tapered off, but sales have trailed even more and have never been fewer over a 6-month time frame. That means the Buy/Sell Ratio is still historically high.

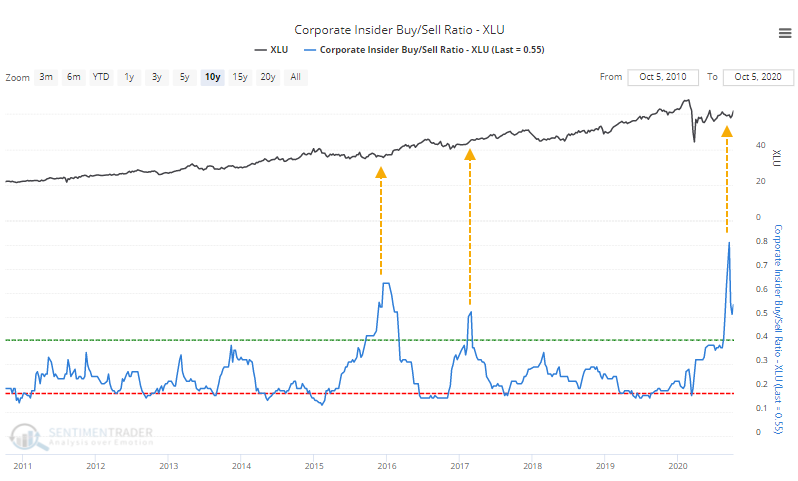
The swift decline in the ratio means that Velocity is extremely negative, but it has not been effective at preceding lower returns, unlike that measure for the broader market.

We've seen repeatedly in the past that a staid sector like utilities does not tend to do well in the short-term after big bouts of positive momentum. There are some signs of that here, and shorter-term returns have been mostly weak as noted above. Longer-term, however, the bias was solidly higher.

Sorry, you don't have access to this report

Upgrade your subscription plan to get access
Go to Dasboard
DATA &
TECHnologies
IndicatorEdge
‍
BackTestEdge
‍
Other Tools
‍
DataEdge API
RESEARCH
reports
Research Solution
‍
Reports Library
‍
actionable
Strategies
Trading Strategies
‍
Smart Stock Scanner
‍
FREE
RESOUrCES
Simple Backtest
Calculator
Simple Seasonality
Calculator
The Kelly Criterion
Calculator
Sentiment Geo Map
‍
Public Research Reports
‍
Free Webinar
COMPANY
‍
About
‍
Meet our Team
‍
In the News
‍
Testimonials
‍
Client Success Stories
Pricing
Bundle pricing
‍
Announcements
‍
FAQ
© 2024 Sundial Capital Research Inc. All rights reserved.
Setsail Marketing
TermsPrivacyAffiliate Program
Risk Disclosure: Futures and forex trading contains substantial risk and is not for every investor. An investor could potentially lose all or more than the initial investment. Risk capital is money that can be lost without jeopardizing ones’ financial security or life style. Only risk capital should be used for trading and only those with sufficient risk capital should consider trading. Past performance is not necessarily indicative of future results.

Hypothetical Performance Disclosure: Hypothetical performance results have many inherent limitations, some of which are described below. No representation is being made that any account will or is likely to achieve profits or losses similar to those shown; in fact, there are frequently sharp differences between hypothetical performance results and the actual results subsequently achieved by any particular trading program. One of the limitations of hypothetical performance results is that they are generally prepared with the benefit of hindsight. In addition, hypothetical trading does not involve financial risk, and no hypothetical trading record can completely account for the impact of financial risk of actual trading. for example, the ability to withstand losses or to adhere to a particular trading program in spite of trading losses are material points which can also adversely affect actual trading results. There are numerous other factors related to the markets in general or to the implementation of any specific trading program which cannot be fully accounted for in the preparation of hypothetical performance results and all which can adversely affect trading results.

Testimonial Disclosure: Testimonials appearing on this website may not be representative of other clients or customers and is not a guarantee of future performance or success.