Data &
Technology
Research
Reports
Report Solutions
Reports Library
Actionable
Strategies
Free
Resources
Simple Backtest Calculator
Simple Seasonality Calculator
The Kelly Criterion Calculator
Sentiment Geo Map
Public Research Reports
Free Webinar
Pricing
Company
About
Meet Our Team
In the News
Testimonials
Client Success Stories
Contact
Log inLoginSign up
< BACK TO ALL REPORTS

Utilities as a risk-on indicator

Dean Christians
2021-08-26
Let's review how we can use the S&P 500 Utility sector to identify a risk-on market environment.

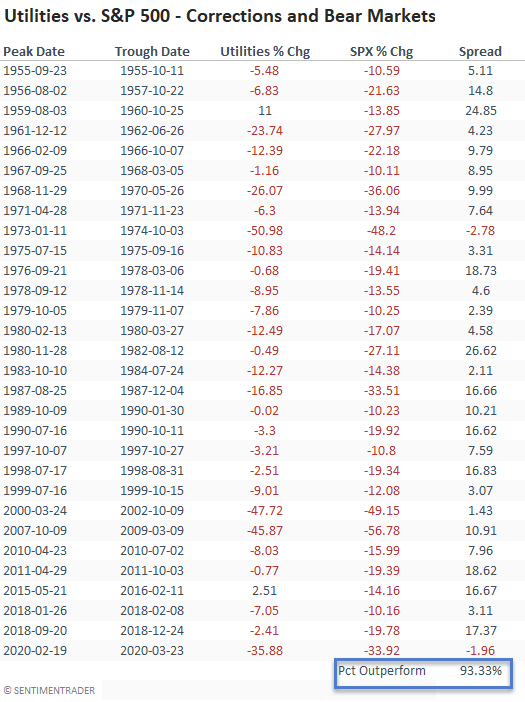
During periods of market stress, utilities are one of the go-to sectors for investors as they seek a more defensive portfolio allocation to minimize drawdowns. Since 1955, utilities have outperformed the S&P 500 index during correction and bear market periods 93% of the time.

Conversely, during bull market phases, utilities typically underperform the broad market as investors seek to allocate to sectors with a more high octane offensive tilt.

Today's note aims to share a concept that identifies when utilities reverse from a period of outperformance to underperformance that is typically associated with a bearish to bullish transition in the market.

COMPONENTS

  1. Percentage of S&P 500 utility members outperforming the S&P 500 index on a rolling 21-day basis.
  2. Percentage of S&P 500 members outperforming the S&P 500 index on a rolling 21-day basis.

The trading signal is based on the following formula.

PERCENTAGE OUTPERFORMING SPREAD

Spread = Percentage Outperforming Utilities - Percentage Outperforming S&P 500.

THE CONCEPT

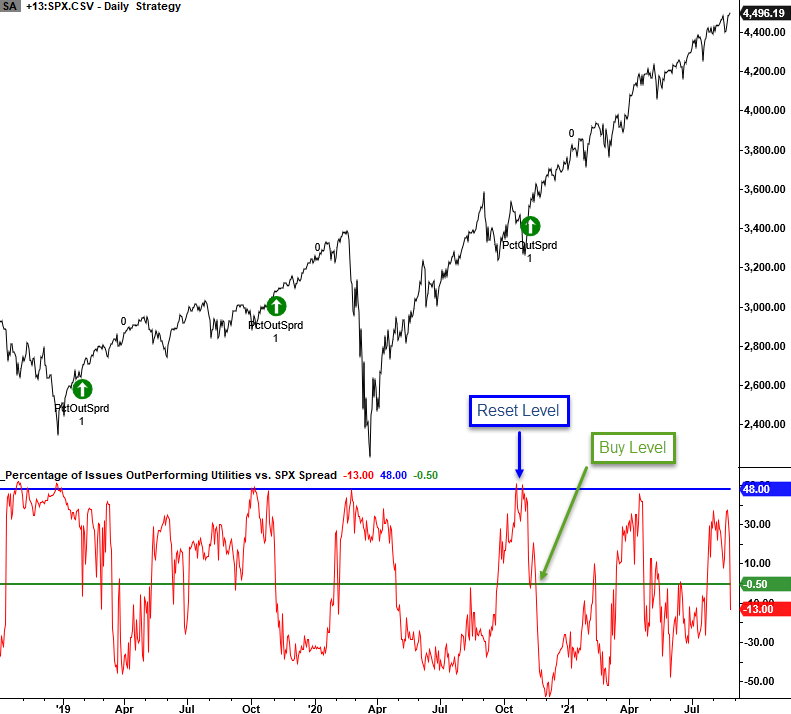
The utilities outperforming spread signal identifies when the percentage of members outperforming spread between utilities and the S&P 500 increases above a user-defined threshold and reverses lower to cross below a user-defined buy level. i.e., the broad market is transitioning from a risk-off phase to a risk-on phase. The model will issue an alert based upon the following conditions.

SIGNAL CRITERIA

  1. If the spread crosses above 48%, the reset condition is true.
  2. If condition 1 and the spread crosses below the buy level threshold of -0.50%, then buy.

CHART EXAMPLE

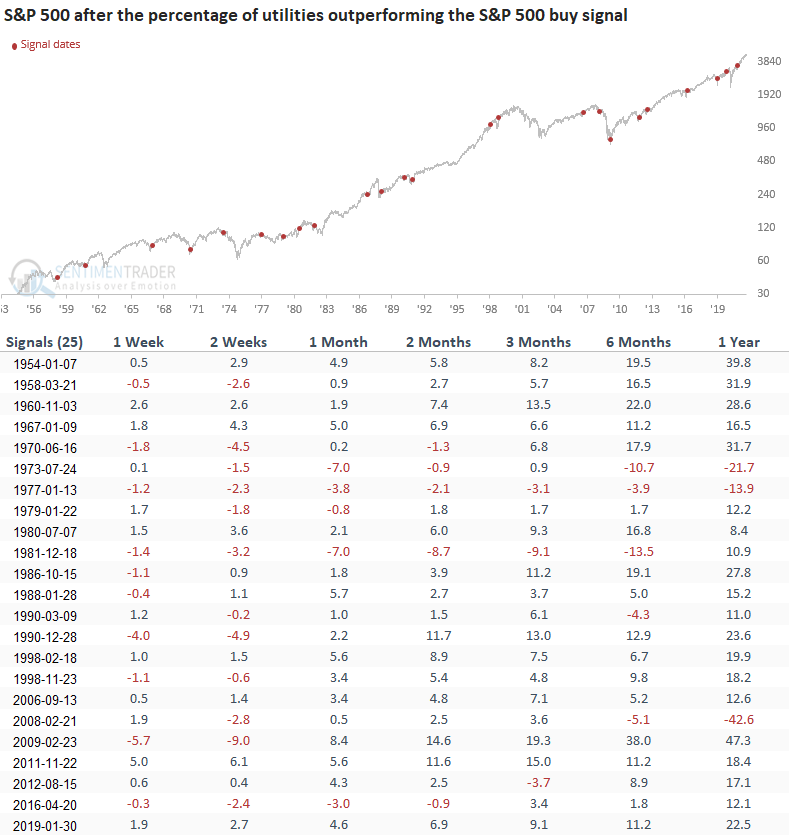
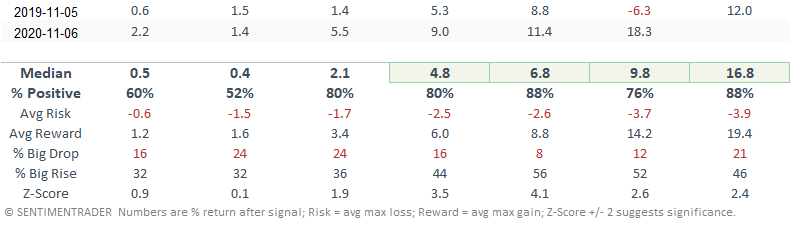
HOW THE SIGNAL PERFORMED

Results look excellent starting in the 1-month timeframe with several notable z-scores. Given that the signal is typically associated with a market transition from a period of stress, it's not a surprise to see somewhat lackluster results in the first two weeks.

Sorry, you don't have access to this report

Upgrade your subscription plan to get access
Go to Dasboard
DATA &
TECHnologies
IndicatorEdge
‍
BackTestEdge
‍
Other Tools
‍
DataEdge API
RESEARCH
reports
Research Solution
‍
Reports Library
‍
actionable
Strategies
Trading Strategies
‍
Smart Stock Scanner
‍
FREE
RESOUrCES
Simple Backtest
Calculator
Simple Seasonality
Calculator
The Kelly Criterion
Calculator
Sentiment Geo Map
‍
Public Research Reports
‍
Free Webinar
COMPANY
‍
About
‍
Meet our Team
‍
In the News
‍
Testimonials
‍
Client Success Stories
Pricing
Bundle pricing
‍
Announcements
‍
FAQ
© 2024 Sundial Capital Research Inc. All rights reserved.
Setsail Marketing
TermsPrivacyAffiliate Program
Risk Disclosure: Futures and forex trading contains substantial risk and is not for every investor. An investor could potentially lose all or more than the initial investment. Risk capital is money that can be lost without jeopardizing ones’ financial security or life style. Only risk capital should be used for trading and only those with sufficient risk capital should consider trading. Past performance is not necessarily indicative of future results.

Hypothetical Performance Disclosure: Hypothetical performance results have many inherent limitations, some of which are described below. No representation is being made that any account will or is likely to achieve profits or losses similar to those shown; in fact, there are frequently sharp differences between hypothetical performance results and the actual results subsequently achieved by any particular trading program. One of the limitations of hypothetical performance results is that they are generally prepared with the benefit of hindsight. In addition, hypothetical trading does not involve financial risk, and no hypothetical trading record can completely account for the impact of financial risk of actual trading. for example, the ability to withstand losses or to adhere to a particular trading program in spite of trading losses are material points which can also adversely affect actual trading results. There are numerous other factors related to the markets in general or to the implementation of any specific trading program which cannot be fully accounted for in the preparation of hypothetical performance results and all which can adversely affect trading results.

Testimonial Disclosure: Testimonials appearing on this website may not be representative of other clients or customers and is not a guarantee of future performance or success.