
Using the dollar to track commodities

Key points
- It is well-established that commodity prices, in general, tend to trend opposite to the U.S. Dollar
- Is there a way to use this information to trade commodities?
- We attempt to answer that question below
Commodity prices versus the U.S. Dollar
For testing, we will use the Bloomberg Commodity Spot Price Index (BCOMSP) and the U.S. Dollar Index (USD). Our test started on December 31st, 1970, and encompasses almost 54 years of history.
The chart below displays the two indexes together.
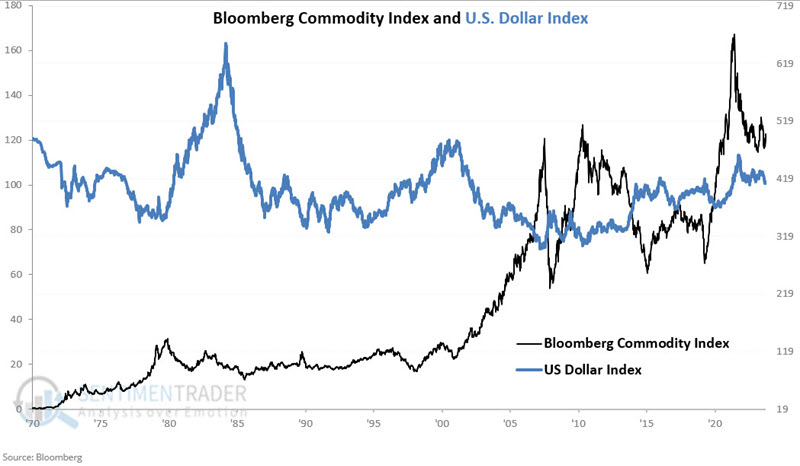
Just by eyeballing the chart above, it is possible to observe the generally inverse relationship - i.e., when USD rises, BCOMSP tends to fall, and vice versa. We find a correlation coefficient of -0.38 when we run the numbers using weekly data. This tells us that there is a strong inverse relationship but that they are by no means the mirror image of one another.
Let's look at one way to use the U.S. Dollar to time movements in commodity prices as an asset class.
Introducing The JK Commodity/Dollar Oscillator
We will employ the following variables:
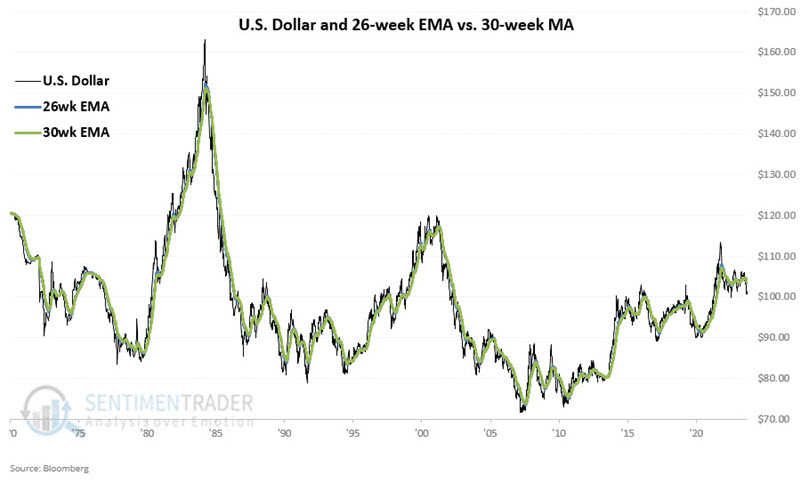
- A = The 26-week exponential moving average (EMA) for the U.S. Dollar Index
- B = The 30-week exponential moving average (EMA) for the U.S. Dollar Index
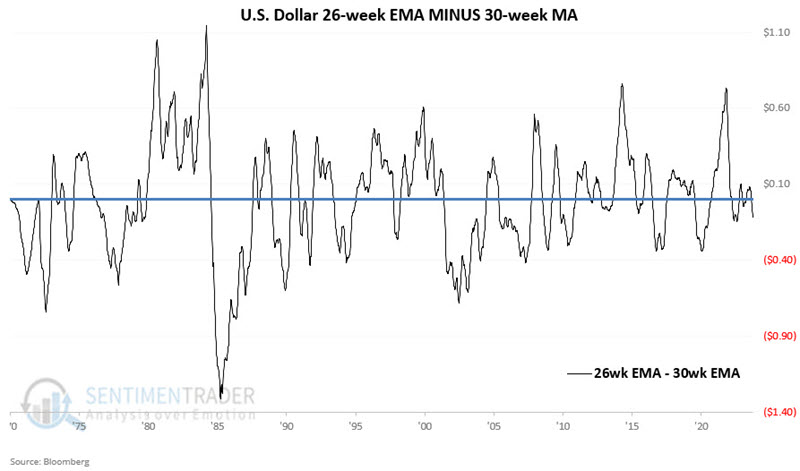
- C = A - B
Variable C reports the difference between the two EMAs at the end of each week.
- When Variable C is positive, it means that the USD is in an uptrend - which, theoretically, should be unfavorable for commodities
- When Variable C is negative, it means that the USD is in a downtrend - which, theoretically, should be favorable for commodities
The chart below displays the U.S. Dollar and Variables A and B (i.e., the 26-week and 30-week EMAs).
 The chart below displays Variable C (i.e., the difference between Variables A and B, which I self-aggrandizingly refer to as the JK Commodity/Dollar Oscillator, for reasons we will get to in a moment). Remember, negative values are purportedly favorable for commodities and vice versa.
How well does reality match theory? Let's look at the results, and you can make your own decisions.
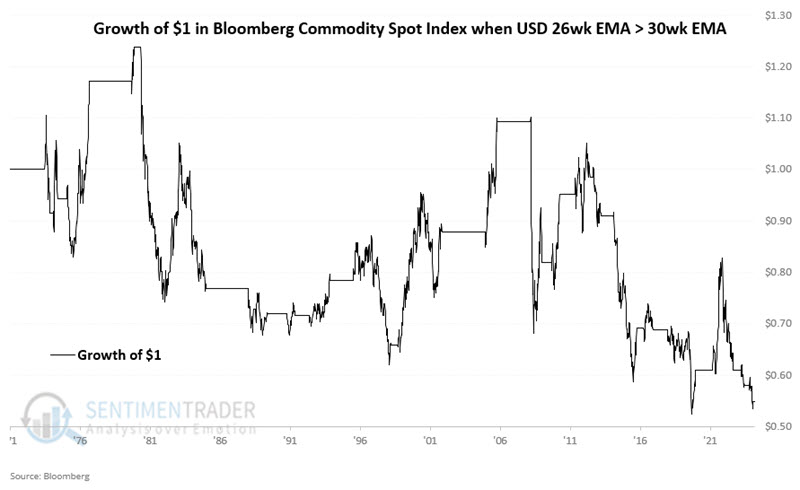
When the JK Commodity/Dollar Oscillator is negative
The chart below displays the hypothetical growth of $1 invested in the Bloomberg Commodity Spot Price Index only during those weeks when Variable C detailed above ended the previous week in negative territory.
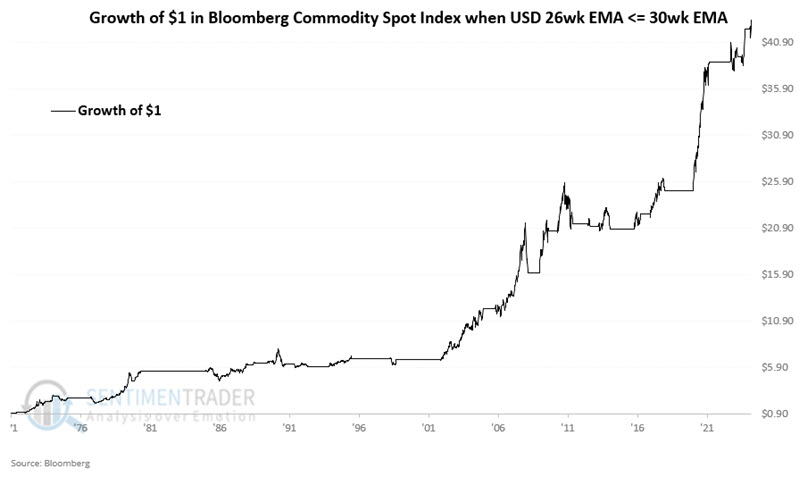
The hypothetical results saw $1 grow to $43.32 through 2024-09-20.
When the JK Commodity/Dollar Oscillator is positive
The chart below displays the hypothetical growth of $1 invested in the Bloomberg Commodity Spot Price Index only during those weeks when Variable C detailed above ended the previous week in positive territory.
The hypothetical results saw $1.00 decline to $0.55 through 2024-09-20.
Where we are now and a real-world application
The JK Commodity/Dollar Oscillator has been negative since 2024-08-16. Since that time, BCOMSP has advanced roughly +5.6%.
For our next test, we will use the Invesco DB Commodity Index Tracking Fund ETF (ticker DBC, which is generally the most actively traded "basket of commodities" ETF) as our vehicle for trading "commodities as an asset class." DBC started trading in 2006. The chart below displays the hypothetical growth of $1 invested in ticker DBC only during those weeks when Variable C detailed above ended the previous week in negative territory.
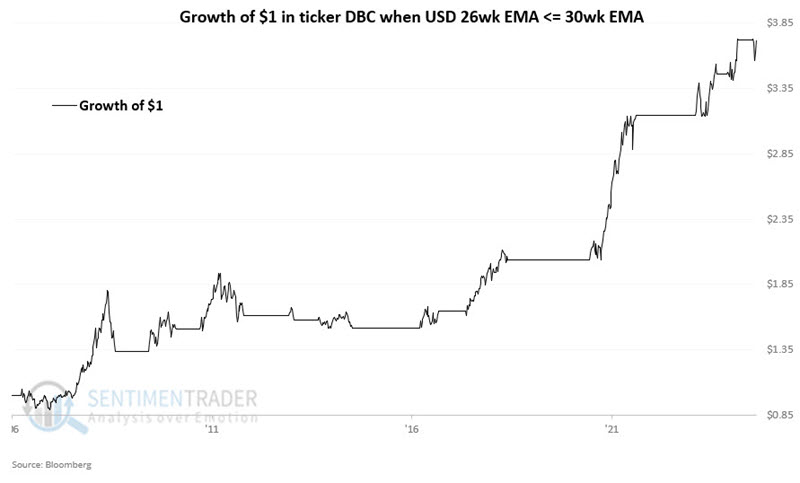
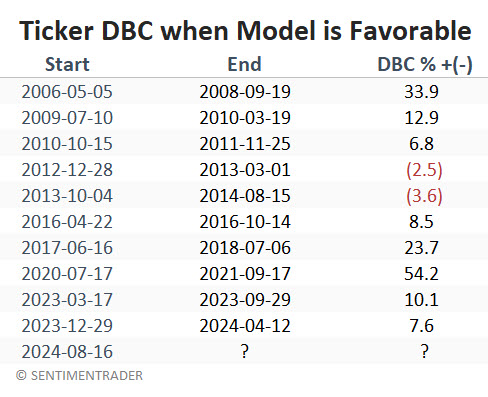
The hypothetical results saw $1 grow to $3.72 through 2024-09-20. The table below displays the hypothetical percentage gain or loss for DBC for each favorable period.
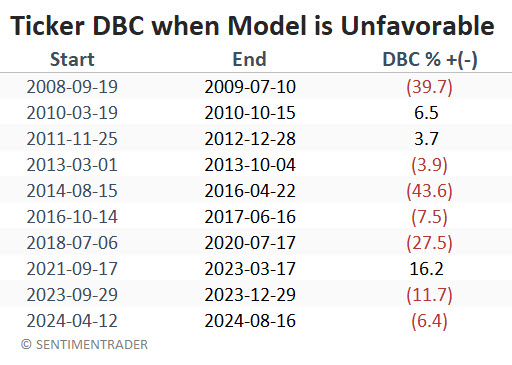
The chart below displays the hypothetical growth of $1 invested in ticker DBC only during those weeks when Variable C detailed above ended the previous week in positive territory.
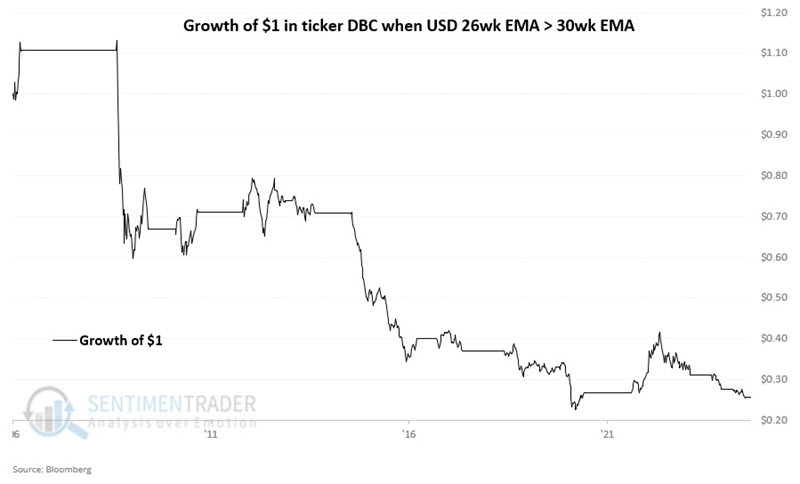
The hypothetical results saw $1.00 decline to $0.26 through 2024-09-20. The table below displays the hypothetical percentage gain or loss for DBC for each unfavorable period.
What the research tells us…
The message in the price is not that traders should automatically buy or sell commodities based solely on the trend of the U.S. Dollar. The results above are hypothetical; as always, past performance does not guarantee future results. The real message is that paying close attention to the trend of the U.S. Dollar may afford traders a valuable "edge" when investing in commodities as an asset class.