
Using Metals to Trade Bonds

Sometimes things in the financial markets are pretty obvious if one is willing to see them. But sometimes, things happen "under the surface" and typically get missed completely. For example, the ratio between the price of gold and the price of copper is useful in identifying the trend in interest rates.
No, seriously.
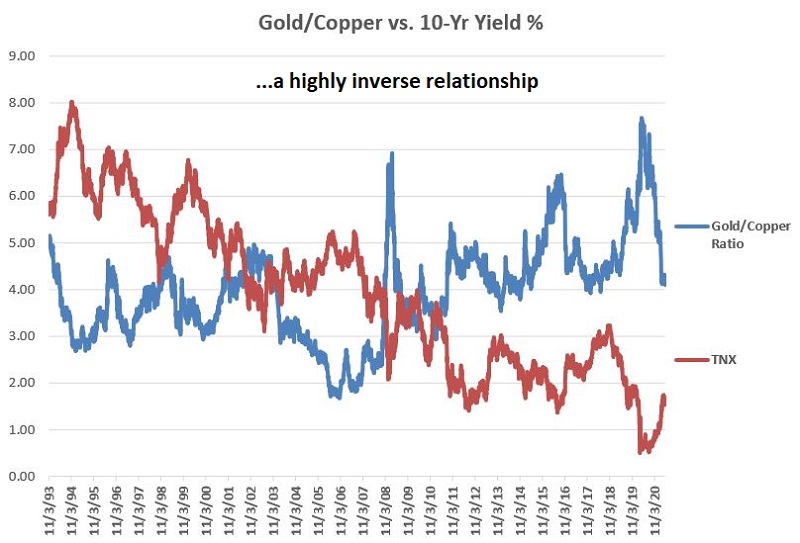
GOLD/COPPER RATIO VERSUS 10-YR. TREASURY YIELDS
- The blue line in the chart below displays the price of gold divided by the price of copper since 1993.
- The red line displays ticker TNX - an index that tracks the yield on 10-yr. Treasury notes.
Notice anything about these two lines?
The phrase "quantitative analyst types" use to describe this type of relationship is "inversely correlated." According to my version of Excel, the correlation between these two lines is -0.62. For reference, in Excel, a reading of +1.00 means perfectly correlated and a reading of -1.00 means perfectly inversely correlated.
In plain English, this means that your eyes are not deceiving you and that, yes, there is a strong inverse correction between the gold/copper ratio and 10-yr. Treasury yields.
So here is the theory:
- Bonds prices move inversely to yields (i.e., as yields rise, bonds prices fall, and vice versa)
- Therefore, if the gold/copper ratio is inversely correlated to 10-yr, yields, then the gold/copper ratio should be highly correlated to 10-yr. bond prices
- Therefore, a rising gold/copper ratio should (in theory) be accompanied by a higher 10-yr. bond price and vice versa
USING GOLD/COPPER RATIO TO TRADE BONDS
For the record, what follows should NOT be considered a "trading system" that guarantees profits, nor am I recommending that anyone use the method described next to trade. It is strictly a thought experiment designed to enlighten people that there are many ways to play this game we call trading.
Alright, with all of that firmly in mind, the calculations are:
A = Gold price divided by Copper price
B = 30-day simple moving average of A
C = 80-day simple moving average of A
D = (B - C)
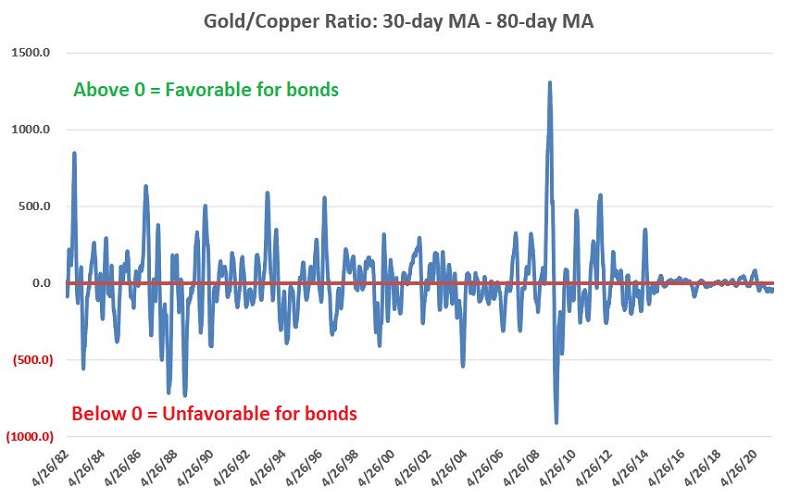
In sum, Variable D represents the 30-day moving average of the gold/copper ratio minus the 80-day moving average of the gold/copper ratio.
The chart below displays the value for variable D above - i.e., the 30-day MA minus the 80-day MA.
Note that:
- This value fluctuates above and below 0
- Positive values for D should be bullish for bond prices
- Negative values for D should be bearish for bond prices
Now let's test the theory.
TRADING RULES
- Use a 1-day lag (i.e., a "buy signal" or "sell signal" issued at the close one day is acted upon at the close of trading on the next trading day)
- If Variable D is greater than or equal to 0, then hold 10-year treasury notes
- If Variable D is less than 0, then DO NOT hold the 10-year treasury note (an aggressive trader could consider a short position in 10-year Treasury notes)
For testing purposes, we use the daily dollar value change for the nearest 10-year treasury note futures contract traded at the CBOT. Each 1-point movement in the futures contract price equals $1,000 (stock-based traders can consider shares of the ETF ticker IEF that tracks 7-10-year notes).
The chart below displays the hypothetical growth of equity achieved by holding a long position in 10-year treasury futures depending on whether the gold/copper ratio (using the 30-day/80-day averages mentioned above) is positive (blue line) or negative (red line).
- Blueline = $ P/L long 10-year note futures if on a "buy" signal
- Redline = $ P/L long 10-year note futures if on a "sell" signal
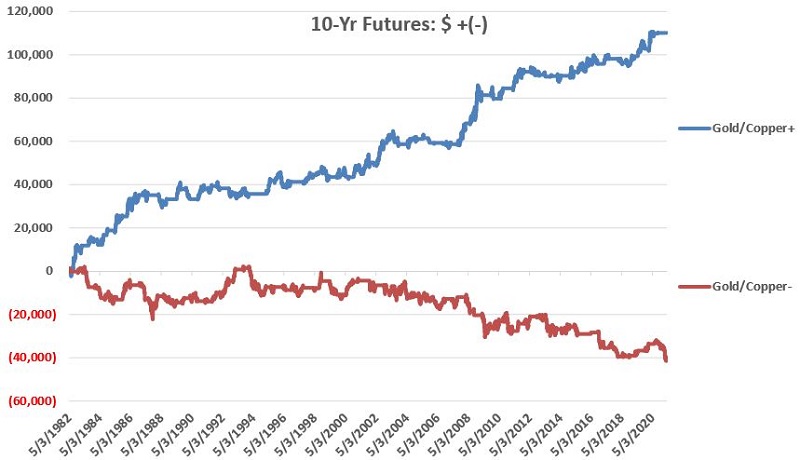
For the record:
From May 1982 into late April 2021:
- A long position in 10-year futures when the 30-day MA for gold/copper was above the 80-day MA generated a hypothetical gain of $110,072
- A long position in 10-year futures when the 30-day MA for gold/copper was below the 80-day MA generated a hypothetical loss of -$40,017
- These results are entirely hypothetical, and no allowances are included in these numbers for slippage or commissions. The purpose is to highlight the stark difference in 10-year note performance during periods when this "system" is bullish versus bearish
SUMMARY
So is this the "be all, end all" of bond trading methods? Not at all. How future results might play out if and when we eventually transition into a bona fide "rising rate environment" is essentially impossible to know.
But the inverse nature of the relationship of gold/copper versus 10-year yields has persisted strongly for over 30 years, so it may prove to be a useful tool in the future.
In any event, the real purpose of this piece is to remind you to not always stare at the "shiny object" that the financial press holds up each day and recognize the need to - and advantage of - looking at things in unique ways.