Data &
Technology
Research
Reports
Report Solutions
Reports Library
Actionable
Strategies
Free
Resources
Simple Backtest Calculator
Simple Seasonality Calculator
The Kelly Criterion Calculator
Sentiment Geo Map
Public Research Reports
Free Webinar
Pricing
Company
About
Meet Our Team
In the News
Testimonials
Client Success Stories
Contact
Log inLoginSign up
< BACK TO ALL REPORTS

Uptrends, uptrends everywhere

Jason Goepfert
2020-12-09
This week, every industry, sector, and major developed country was in an uptrend as defined by being above their 200-day moving averages.

Throughout October and into November, we looked at the thrusts and breadth of buying interest. It was some of the best we've ever seen, and that was on the heels of near record-shattering positive breadth in April and May. 

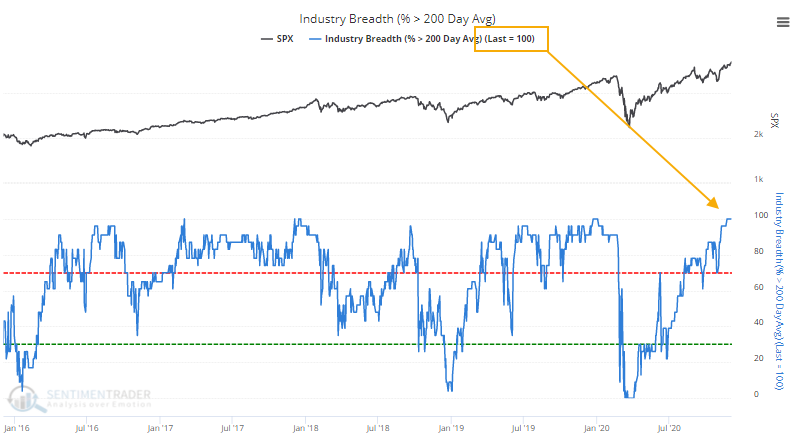
As a result of that and follow through into December, almost every stock in the S&P 500 is above its 200-day moving average. With so many stocks in uptrends, it stands to reason that most industries would be as well. And in recent weeks, that has been the case, with 100% of them above their 200-day averages. 

industries above 200 day average

The rally has broadened out across the globe, with all major global equity indexes also in uptrends.

When we've seen this kind of global coordinated buying interest before, stocks in the U.S. have stumbled over the short-term as overbought conditions wore off. Over the next year, however, the S&P 500 was higher after all but one signal. Overbought doesn't have to be a bad thing.


What else is happening

These are topics we explored in our most recent research. For immediate access with no obligation, sign up for a 30-day free trial now.

  • Full details on what happens when all industries, sectors, and countries are in uptrends
  • The S&P 500 is historically stretched against its 200-day average - what that has meant since 1928
  • All the major equity indexes have hit all-time highs at the same time

Stat Box

More than 35% of technology stocks are now overbought according to the Relative Strength Index (RSI). That's the most since late January. Over the past 20 years, there have been 69 days with this many overbought tech stocks. For funds like XLK, readings this high led to almost flat returns over the next month, with about a 50/50 chance of showing a positive return, a bit weaker than random.

Sentiment from other perspectives

We don't necessarily agree with everything posted here - some of our work might directly contradict it - but it's often worth knowing what others are watching.

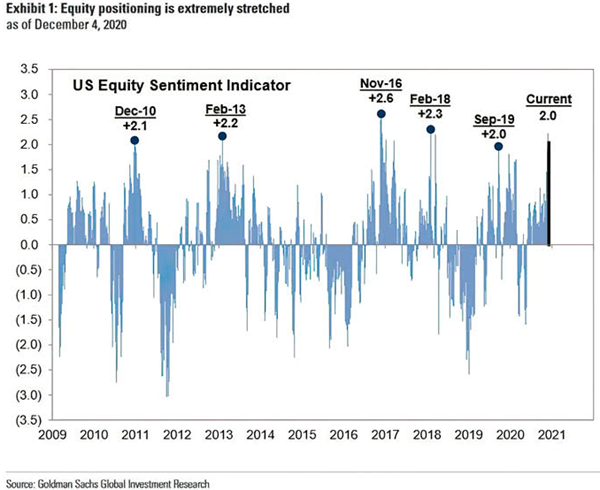
1. Yet another sentiment model has reached a level that suggests investors are somewhere between giddy and downright euphoric. [Goldman Sachs]

goldman sachs sentiment model

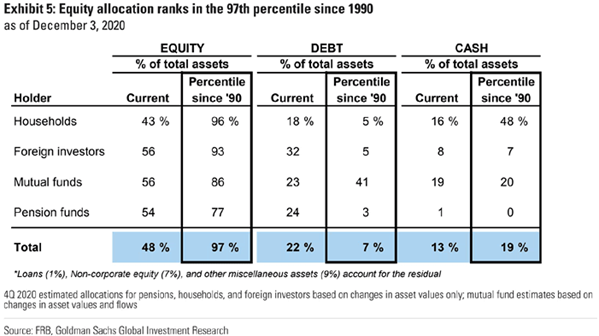
2. Folks are bullish, and backing it up with their money. Equity allocations are pushing the upper bound. [Goldman Sachs]

investor equity allocation

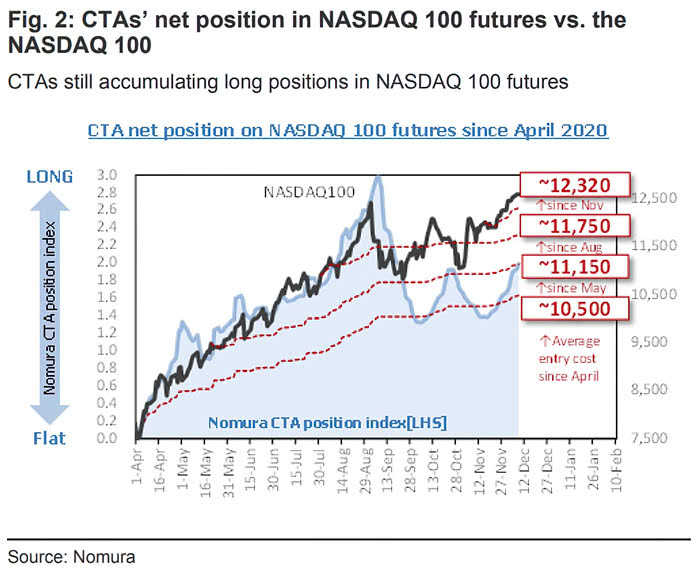
3. Commodity Trading Advisors (CTAs), who typically employ trend-following strategies, are back to holding a substantial net long position in the big tech stocks that dominate the Nasdaq 100. [Nomura via Isabelnet]

cta exposure to nasdaq 100 ndx

DATA &
TECHnologies
IndicatorEdge
‍
BackTestEdge
‍
Other Tools
‍
DataEdge API
RESEARCH
reports
Research Solution
‍
Reports Library
‍
actionable
Strategies
Trading Strategies
‍
Smart Stock Scanner
‍
FREE
RESOUrCES
Simple Backtest
Calculator
Simple Seasonality
Calculator
The Kelly Criterion
Calculator
Sentiment Geo Map
‍
Public Research Reports
‍
Free Webinar
COMPANY
‍
About
‍
Meet our Team
‍
In the News
‍
Testimonials
‍
Client Success Stories
Pricing
Bundle pricing
‍
Announcements
‍
FAQ
© 2024 Sundial Capital Research Inc. All rights reserved.
Setsail Marketing
TermsPrivacyAffiliate Program
Risk Disclosure: Futures and forex trading contains substantial risk and is not for every investor. An investor could potentially lose all or more than the initial investment. Risk capital is money that can be lost without jeopardizing ones’ financial security or life style. Only risk capital should be used for trading and only those with sufficient risk capital should consider trading. Past performance is not necessarily indicative of future results.

Hypothetical Performance Disclosure: Hypothetical performance results have many inherent limitations, some of which are described below. No representation is being made that any account will or is likely to achieve profits or losses similar to those shown; in fact, there are frequently sharp differences between hypothetical performance results and the actual results subsequently achieved by any particular trading program. One of the limitations of hypothetical performance results is that they are generally prepared with the benefit of hindsight. In addition, hypothetical trading does not involve financial risk, and no hypothetical trading record can completely account for the impact of financial risk of actual trading. for example, the ability to withstand losses or to adhere to a particular trading program in spite of trading losses are material points which can also adversely affect actual trading results. There are numerous other factors related to the markets in general or to the implementation of any specific trading program which cannot be fully accounted for in the preparation of hypothetical performance results and all which can adversely affect trading results.

Testimonial Disclosure: Testimonials appearing on this website may not be representative of other clients or customers and is not a guarantee of future performance or success.