
Upside volatility has skyrocketed

Key points:
- The S&P 500's moves have been relatively quiet, but that hides an unusual underlying dynamic
- Price action has been significantly more volatile on up days than on down days, to a historic degree
- While that might suggest exuberance, it has not preceded consistent declines in stocks
High volatility, but mostly on up days
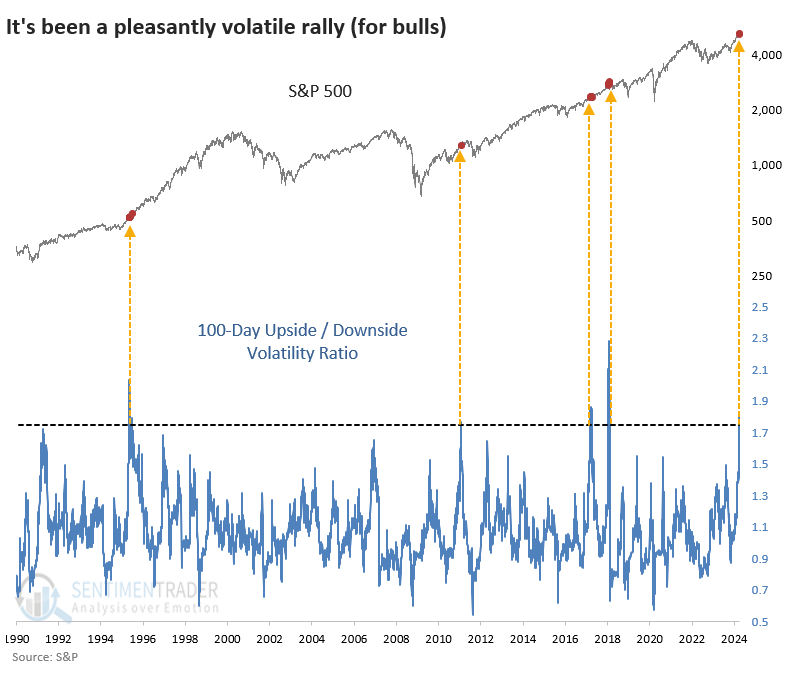
Stocks enjoyed a tremendous push during the first hundred days off the October 2023 bottom. While the rally was relatively calm, it hides an unusual twist - volatility on positive days has been significantly higher than on negative days.
In the past hundred days, the S&P averaged a gain of +0.61% on its positive days and -0.42% on its negative days. Also, the positive days have been more volatile than the negative ones. The chart below shows the ratio between volatility on up and down days. We can see that it's at one of the highest levels in decades and triggered right before peaks in 2011 and 2018, but also in the early stages of rallies in 1995 and 2017.
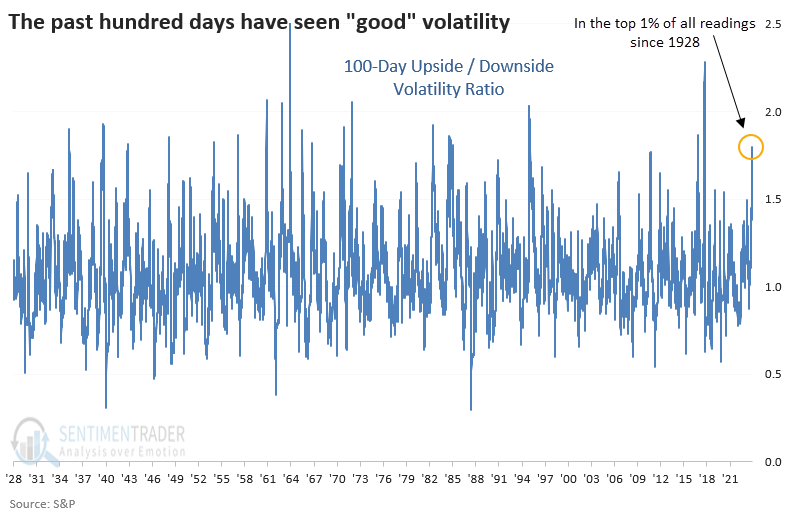
Taking a much longer view, the chart below shows that the current ratio is in the top 1% of all days since 1928, so it is genuinely extreme.
No consistent downside to upside volatility
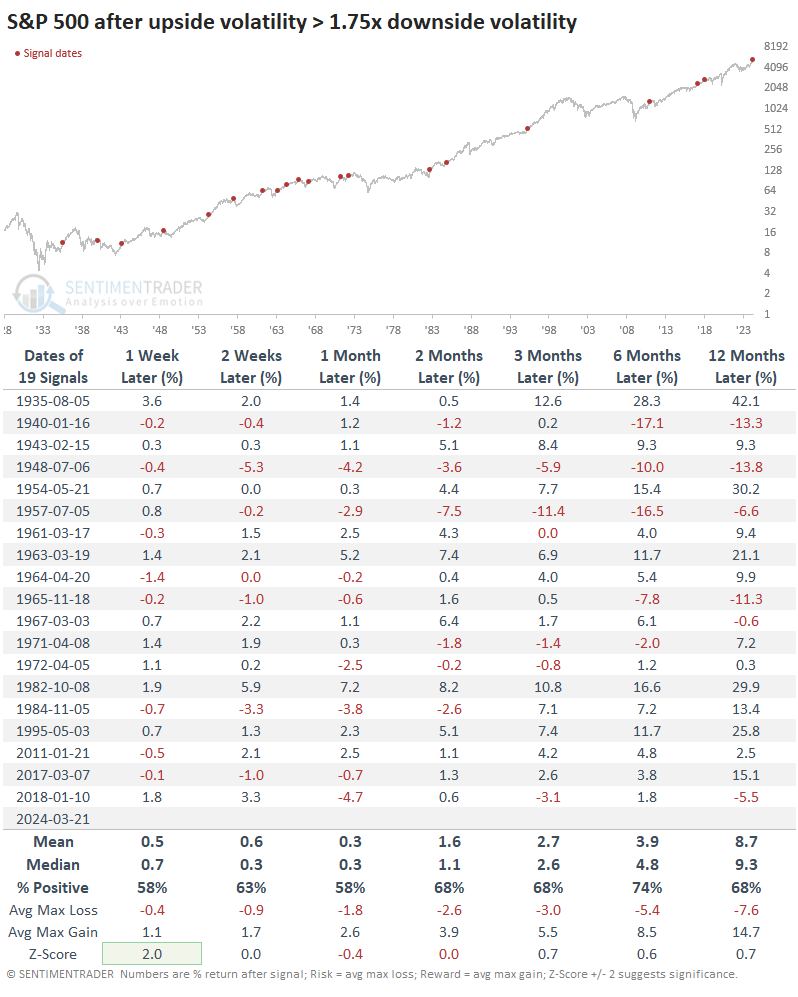
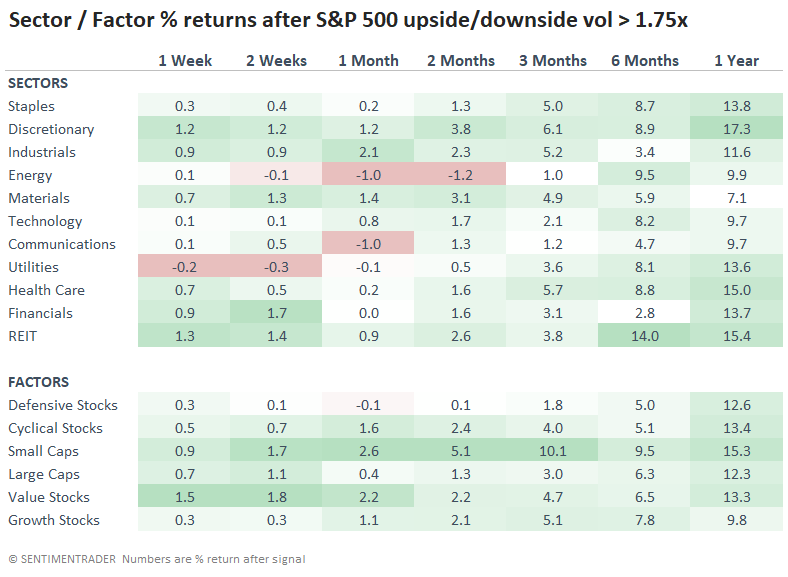
The table below shows returns in the S&P 500 after its upside volatility crossed 1.75 times downside volatility. Theoretically, we could expect that these were instances of FOMO (Fear Of Missing Out) and sure to end in tears for bulls late to the party. The results don't support that theory, however. While there were some sizable losses, they were the exception. Over the past 50 years, all the signals resulted in further gains over the next six months.
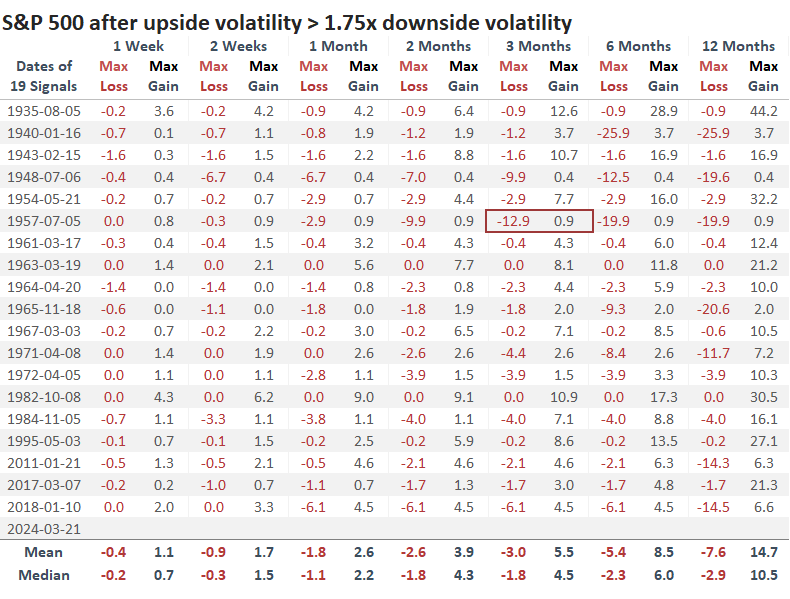
The table of maximum gains and losses across time frames shows that within the next three months, only one signal (in 1957) resulted in a double-digit loss. Over that time frame, 14 out of 19 signals showed a larger maximum gain than maximum loss.
Another reasonable theory is that investors might take a breather after these bouts of upside volatility and hide in larger or more defensive stocks. That wasn't really the case; the table below shows that small-cap and cyclical stocks showed better returns across most time frames than the more conservative factors. Over the next year, discretionary stocks had the best average return, at +17.3%.
What the research tells us...
Examples and anecdotes of extreme optimism, even exuberance, aren't hard to come by now. Many sentiment measures show extremes, though they've been pinned there for months. That's the hallmark of a nascent bull market.
Investors may be concerned about price action and how stocks have been gaining so much more on up days than they're losing on down days. That's a good problem to have (for bulls), but it leads to concerns about excess. And it has been excessive, but similar behavior didn't lead to consistent mean-reversion. Most of the time, the gains just kept on coming.