
Updates on natural gas and real estate options example trades

Key points
- We previously discussed two potential ways to play a bullish seasonal trend in natural gas (here and here); that bullish trend has not materialized at all
- We also discussed one way to play the recent sell-off in the real estate sector
- In this piece, we update the original example positions and discuss what - if anything - might be done with these positions
Natural gas has been a bust
The chart below displays the annual seasonal trend for natural gas futures (blue line) and the actual price action for 2023 (red line).
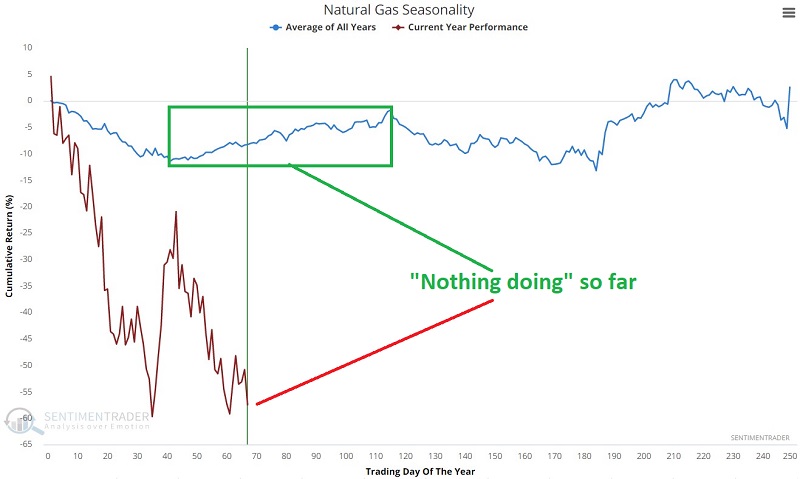
As you can see in the chart above, in 2023, natural gas has been a bust. This market remains seriously oversold and (theoretically) still due for a bounce. In playing seasonal trends, I typically suggest one of two approaches - either a) wait for price action to confirm and/or b) use options to limit risk.
Here and here, I detailed two potential bullish plays in natural gas using options. The bad news is that natural gas has continued relentlessly lower, and both positions are firmly underwater. The good news - such as it is - is that losses are small in terms of dollar amounts (assuming the trade was sized correctly - i.e., no more than 1 to 2% of trading capital). These were highlighted as highly speculative bets on a reversal in natural gas. So far, NG has only continued to drop. Let's update the two example trades.
Swan Energy call option example underwater
The first involved buying a call option on Swan Energy (SWN) as a proxy for natural gas. The current status of this position appears below (screenshots courtesy of www.Optionsanalysis.com).
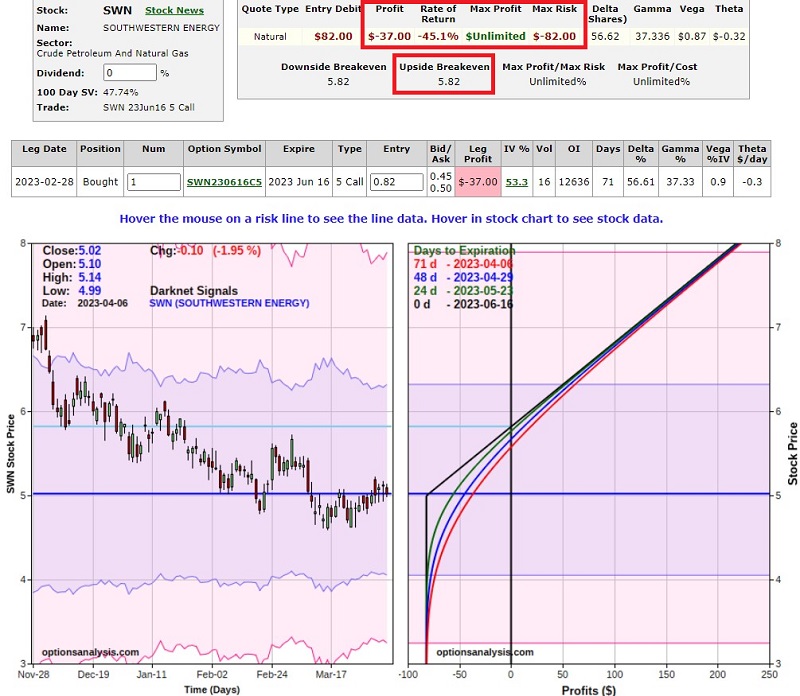
The initial cost - and maximum risk - was $82 for a 1-lot. So a trader with a $25K account, risking 1% of trading capital, might have bought a 3-lot. SWN is presently trading at $5.02 a share. The breakeven price on this trade is $5.82 a share, and there are still 71 days left until option expiration. The choices are this point are a) hold on in hopes of a bounce in the next two months, b) adjust the trade, c) cut bait and exit the position.
There is no "correct" choice. A trader willing to risk 1 to 2% a little over a month ago might consider just holding on. There are over two months left until option expiration, and IF SWN does ever get off the deck, this trade could still turn into a profit.
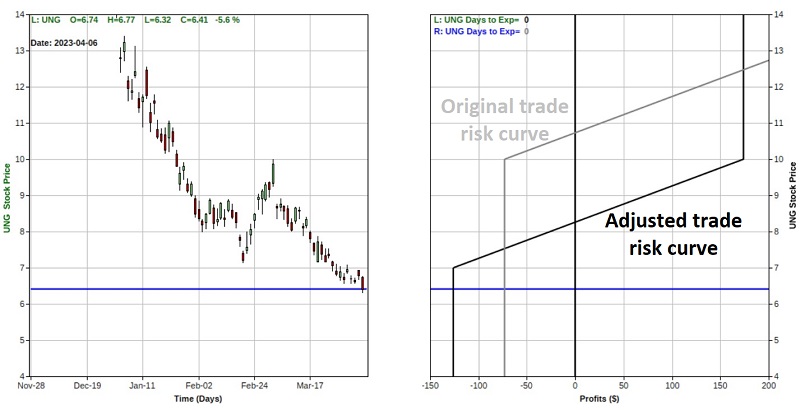
UNG bull call spread revisited
The second involved a bull call spread on the United States Natural Gas (UNG) ETF. The current status of this position appears below.
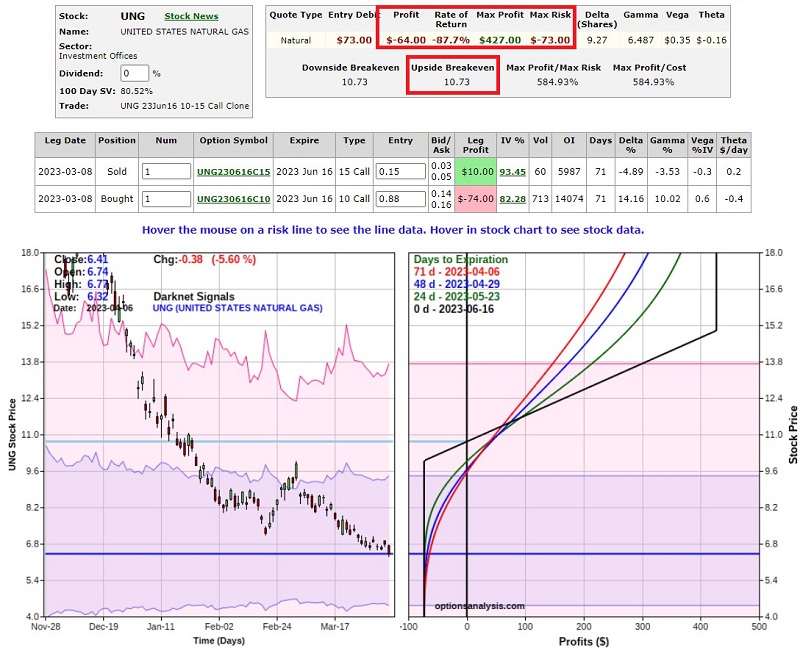
The initial cost - and maximum risk - was $73 for a 1-lot. So, a trader with a $25K account, risking 1% of trading capital, might have bought a 3-lot. This trade is presently a bust. It is down -$64 on a 1-lot (-88%), UNG is trading at $6.41 a share, and the breakeven price on this trade is very far away at $10.73 a share. It will require a massive percentage price movement by UNG to get back to breakeven. While that is possible with something as volatile as UNG, the odds are low. With 71 days left until expiration and most of the premium already lost, there may not be much point in selling. A trader unwilling to risk any more on this situation can just "let it ride" and hope for a bounce.
Another alternative - for a trader willing (and able from a risk management, percent of capital standpoint) to risk more - a trade adjustment may improve the odds somewhat. This example adjustment involves:
- Buying 1 UNG June16 2023 7 call @ $0.76
- Selling 2 UNG June 16 2023 10 calls @ $0.14
- Buying 1 UNG June 16 2023 15 calls @ $0.05
Essentially, this involves exiting the long 10 and short 15 strike price bull call spread and "rolling down" to the long 7 and short 10 strike price bull call spread. The particulars for the new, adjusted position compared to the original position appear below. The new 7-10 strike price spread is the "Left Trade" below; the original 10-15 strike price spread is the "Right Trade" below.
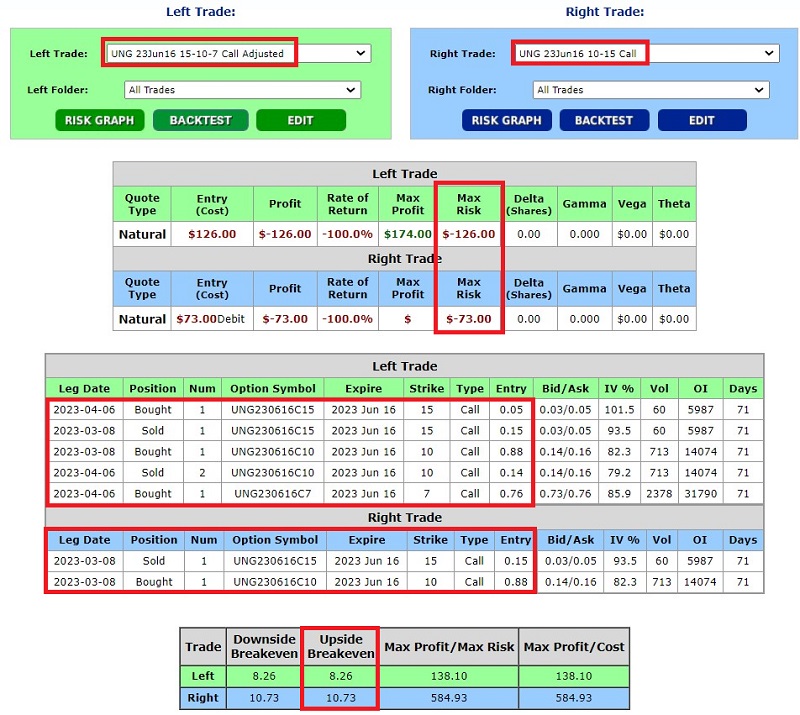
The risk curves at expiration for both the originde ahe adjusttradesade appear below. There are some distinct tradeoffs involved. For a 1-lot, the maximum risk for the adjusted trade increases to $126 versus $73 for the original position. So there is a significantly higher dollar risk, at least in percentage terms. What does a trader get for this increased risk? Note that the breakeven price for the adjusted position drops to $8.26 a share versus $10.73 for the original trade, thus greatly improving the probability of profit.
With UNG trading at $6.41, $8.26 still represents a large percentage move. However, the probability of getting back to breakeven - and possibly even turning a profit - is much greater with the adjusted trade.
Again, there is no correct choice, only reward-versus-risk considerations for a trader to decide.
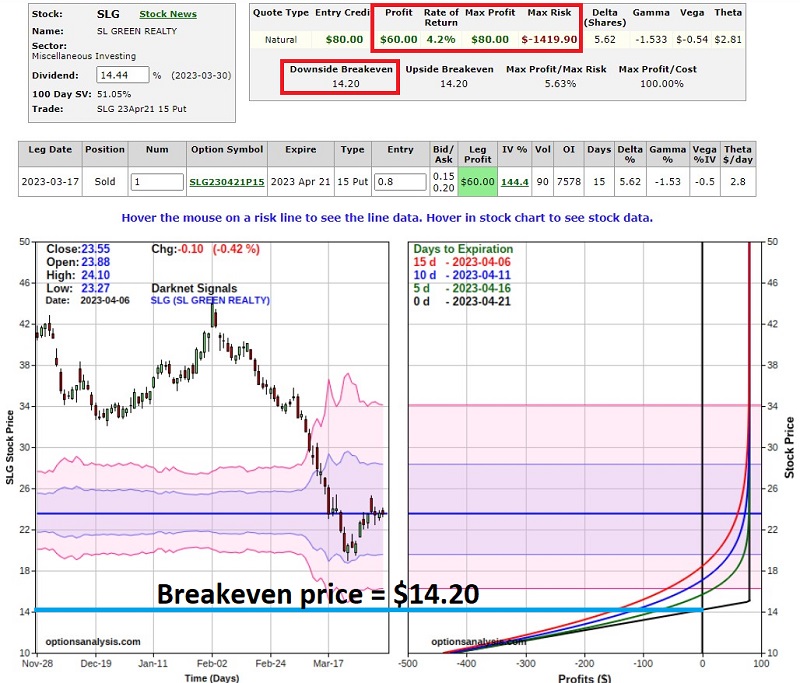
Real estate-related short put progressing despite continued sector weakness
The sharp decline in the real estate sector early in 2023 was accompanied by a sharp increase in options implied volatility. This created a potential opportunity for selling out-of-the-money put options. The example trade involved selling the SLG Apr21 2023 15 strike price put for $0.80 for a 1-lot. The trade had the potential to earn 5.63% in 35 calendar days. The seller of the option would be required to buy 100 shares of SL Green Realty if the stock dropped from $23.57 to below $15 a share. The effective buy price would be $14.20 a share ($15 strike price minus $0.80 option premium received).
After the trade was entered, the stock kept falling, closing at $19.96 on 2023-03-23. Since then, the stock has bounced around and closed on 2023-04-06 at $23.55 a share. Since entry - and thanks to time decay - the value of the option has dropped 75% to $0.20. A trader holding this position has two basic choices, a) continue to hold the short put and hope that it expires worthless, resulting in a 5.63% profit in 35 days, or b) buy back the put now, take a $60 (42%) profit and free up the $1,420 in capital used to secure the trade initially.
Have I mentioned that there are no "correct" answers?
What the research tells us…
Options have many uses. In the case of natural gas, a long position in SWN and/or UNG offered the opportunity to play for a bounce in a deeply oversold market (which has only gotten more oversold since) while completely limiting downside risk to a specific, acceptable level. In the case of real estate, the SLG example offered the potential to take advantage of an implied volatility spike to generate income or potentially buy shares of very high-yielding stocks at an effective price ($14.20) far below the current level at the time the trade was entered ($23.57). Likewise, in many cases, an options trade can be adjusted to either improve the reward-to-risk tradeoff or to take an early profit.