
Unrelated indicators lending weight to the bullish case for stocks

Key points
- Some indicator signals are best used not as a standalone trading system but as weight of the evidence
- The IPO / S&P 500 Relative Ratio Rank, OEX Open Interest Ratio, and Dumb Money Confidence indicators have all given recent favorable signals
- Individually, any signal can be called into question - but taken together, they lend weight to the argument that the favorable environment for stocks may persist for longer than many suspect
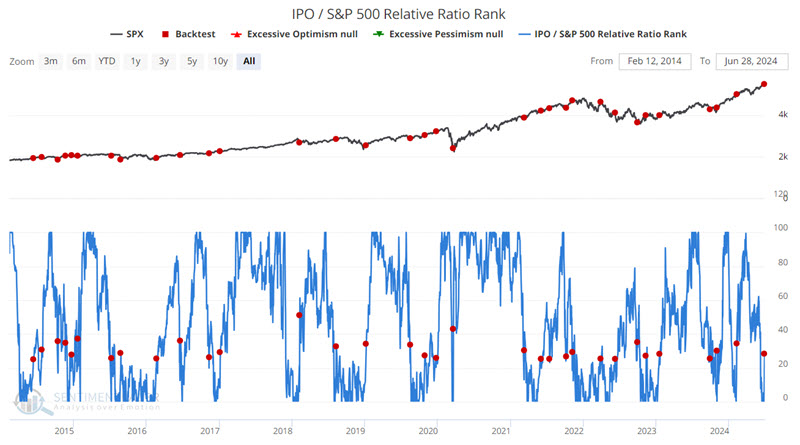
IPO / S&P 500 Relative Ratio Rank
The IPO / S&P 500 Relative Ratio Rank indicator shows where the ratio is relative to its range over the past four months. When the relative ratio is high, investors are showing risk-on behavior. When the ratio drops to a low level, they exhibit risk-off behavior. One signal that can be useful is when there is a reversal off of a low level. This often - though, importantly, not always, highlights the type of sentiment shift that can propel the market higher for an extended period of time.
The chart below highlights those dates when the IPO / S&P 500 Relative Ratio Rank crossed above 25%. The most recent signal occurred on 2023-06-27.
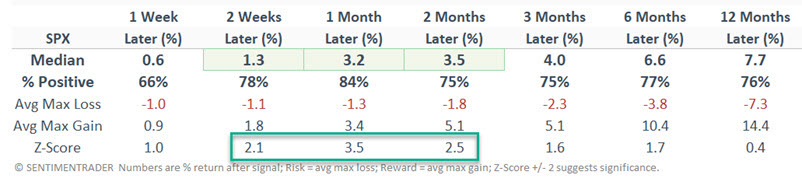
The table below summarizes S&P 500 performance following the signals highlighted above.
This is the type of indicator signal that:
- Should likely never be used as a standalone trade entry signal or trading system
- Can offer helpful information to a broader weight of the evidence approach
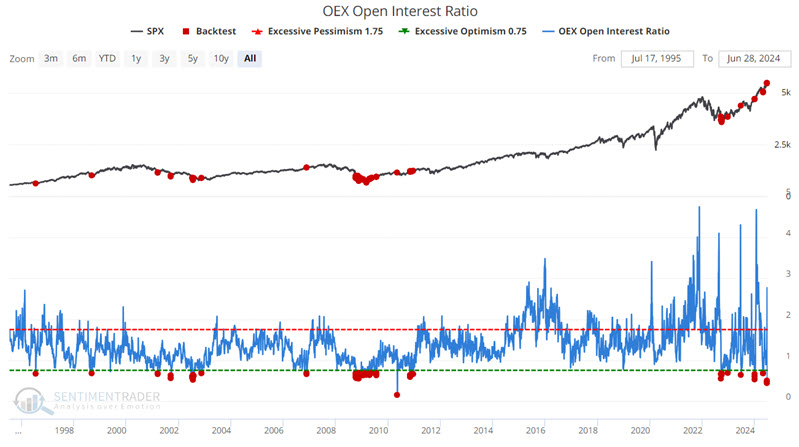
OEX Open Interest Ratio
OEX is shorthand for the S&P 100, an index of the 100 largest companies in the S&P 500. Open interest is defined as the total number of option contracts outstanding. Open interest is increased by opening transactions and decreased by closing transactions. Someone buying a call to open (a bullish position) would increase open interest by one, and someone selling a call to open (a bearish position) would also increase open interest by one.
The open interest indicator takes the total put open interest and divides it by total call open interest - as more put contracts are opened (and/or call contracts closed), the indicator rises; as put contracts are closed (and/or call contracts opened), the indicator falls. The OEX put/call open interest ratio should be considered in a non-contrarian manner. As put open interest rises in relation to call open interest, it suggests that OEX option traders - usually quite successful at identifying market turning points - are accumulating put positions. This is a bearish development. Conversely, if OEX traders are accumulating call positions, the put/call open interest ratio should fall, which is usually bullish.
The chart below highlights those dates when the indicator value crossed below 0.7. The most recent signal occurred on 2023-06-27
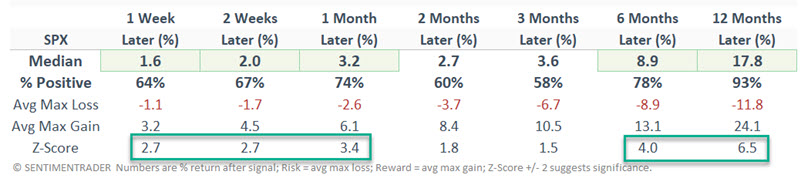
The table below summarizes S&P 500 performance following the signals highlighted above.
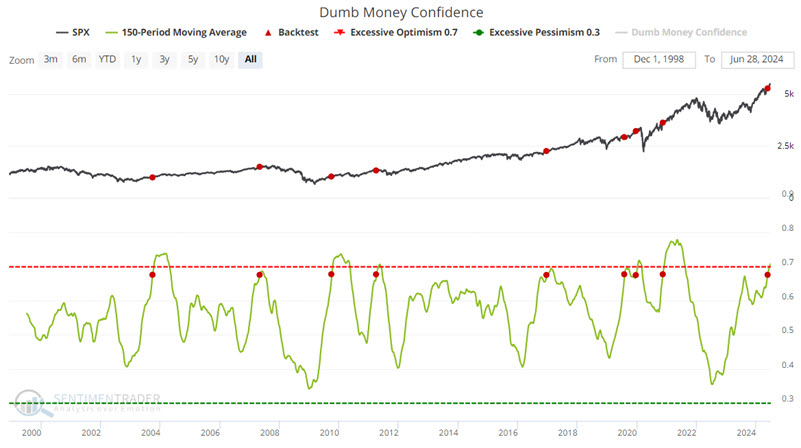
Dumb Money Confidence
In general, the higher Dumb Money Confidence, the more unfavorable the implication for stocks - i.e., the people who tend to be most wrong are getting too bullish. And the reality is that this indicator typically reaches a high level before significant market tops. But we did find an interesting quirk. As long as the bullish consensus grows, it can lend more buying power to the market.
The chart below highlights those dates when the 150-day moving average of Dumb Money Confidence first crossed above 0.67. The most recent signal occurred on 2023-05-23.
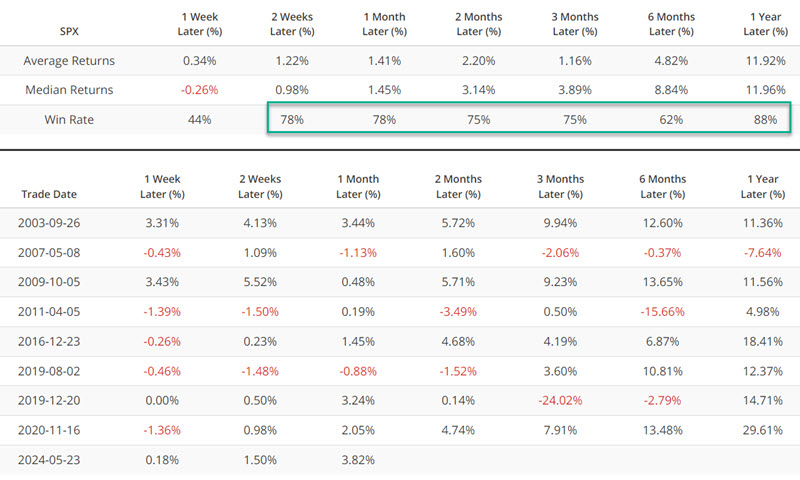
The table below summarizes S&P 500 performance following the signals highlighted above.
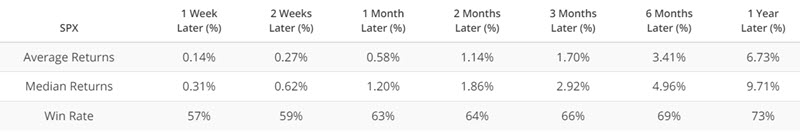
For comparison's sake, the table below highlights S&P 500 performance for all trading days.
Like the indicators above, no one would suggest using this solitary signal as an "automatic" trading signal or a standalone trading system. The lesson here is primarily that bull markets tend to persist even after the first wave of investor "optimism." A close look at the chart above reveals that market trouble tends to unfold after the 150-day average of Dumb Money Confidence flattens out and/or rolls over.
What the research tells us…
None of the recent indicator signals highlighted above constitute a "world-beating" signal. They each have demonstrated a decent track record of subsequent market performance but have generated significant "wrong" signals along the way. Nevertheless, when taken together, they do point to the potential for a continuation of a favorable environment for stocks.