
Unemployment flashes a warning sign

Key points
- The official Unemployment Rate remains relatively low
- However, by one measure, the trend in Unemployment will be "up" at the end of June
- Historically, this has often been an early warning sign of impending recession
- There is no guarantee this measure will be correct this time, but it does not hurt to be aware of the history
Unemployment Rate ticks into an uptrend
The chart below (courtesy of www.fred.stlouisfed.org) displays the monthly national unemployment rate.
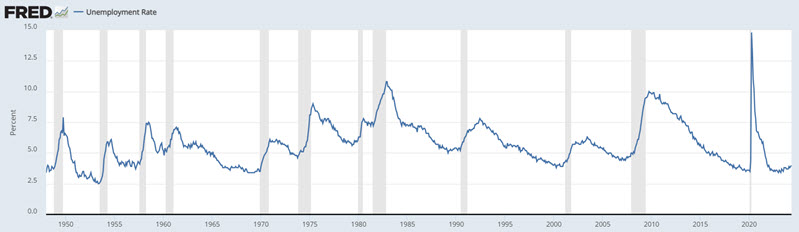
As the chart above shows, an upturn in Unemployment is often a sign of impending recession (these periods are marked in grey). The chart below displays the monthly national unemployment rate and a 36-month simple moving average.
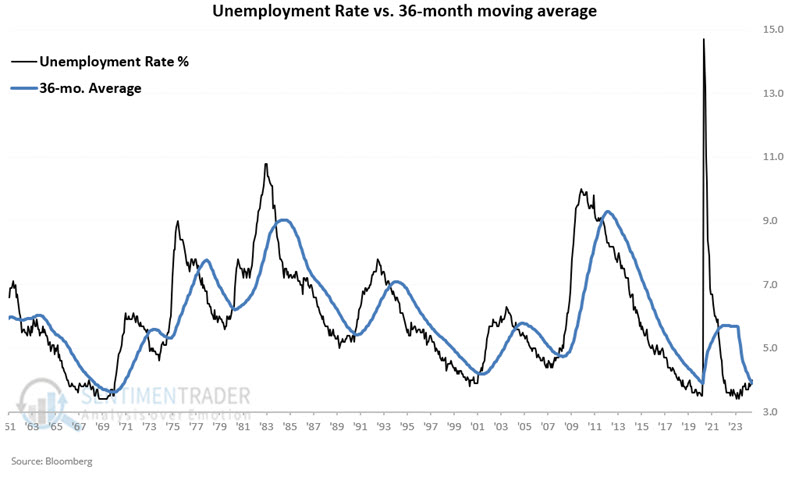
Interpretation is simple. If the black line (unemployment rate) is above the blue line (36-month average), then Unemployment is in an uptrend and vice versa. As you can see, the latest reading closed back above the blue line, signaling that Unemployment will be in a rising trend at the end of June.
Calculation Note: Results for the prior month are typically reported early in the next month. For example, the May 2024 unemployment rate was reported in 2024-06-07. However, for purposes of the testing below, the data is not analyzed until the end of the month reported. In other words, we will consider the May results reported on 2024-06-07 after the close on 2024-06-28.
The Coincident Economic Activity Index measures economic performance
We will measure economic performance using the monthly readings of the Coincident Economic Activity Index for the United States (CEI for short).
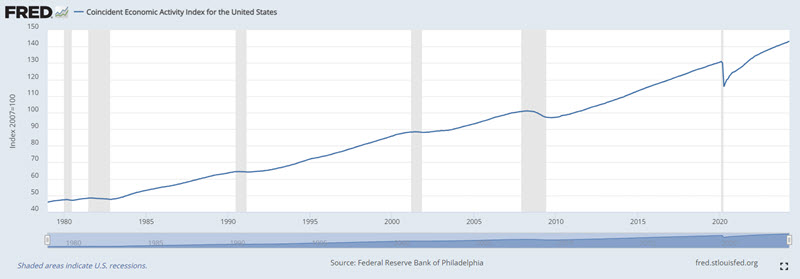
As you can see, this index primarily trends higher as the economy typically grows month to month. However, there are declines along the way, which are considered economic recessions.
We want to find out how the economy typically performs after the unemployment rate crosses above its 36-month average relative to all other times.
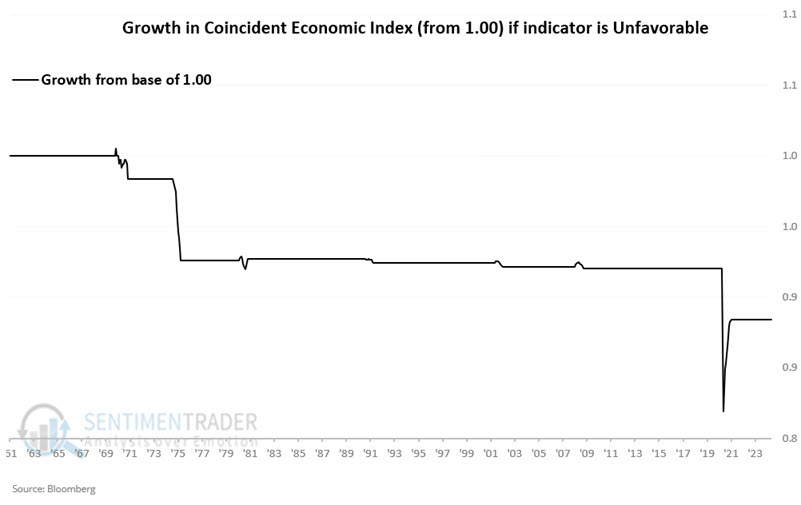
For our second test, we will measure future CEI performance only following the end of the month when the unemployment rate reported during that month first crosses above its 36-month moving average. However, to set the baseline, let us first look at future CEI performance following all other months. We set a baseline at 1.00 and then add or subtract the percentage gain for CEI each month if the unemployment rate did not cross above its 36-month average in the previous month. The results appear in the chart below.
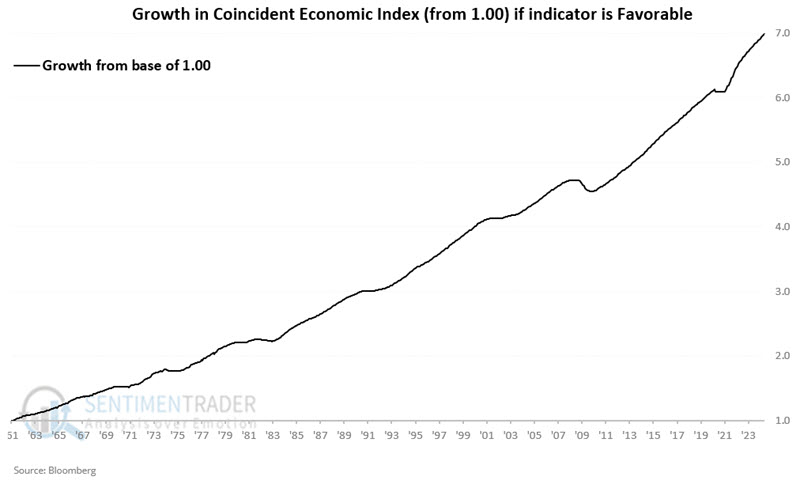
The chart above shows a few minor downtrends (comparative statistics will appear below), but overall, it is fair to say that the economy typically grew during these periods. The table below summarizes CEI performance results over different periods.
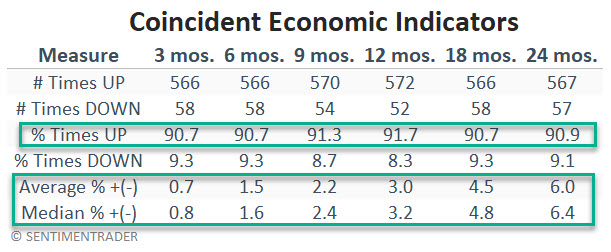
The key things to note in the table above:
- CEI rose over 90% of all months across all periods measured
- Average and median % gains are positive and increase across periods
When Unemployment enters a rising trend, the calculus often changes
Now let us look only at those times when the Unemployment Rate crossed above its 36-month moving average.
The table below summarizes CEI performance results over different periods directly after the Unemployment Rate ended a month, crossing above its 36-month moving average.
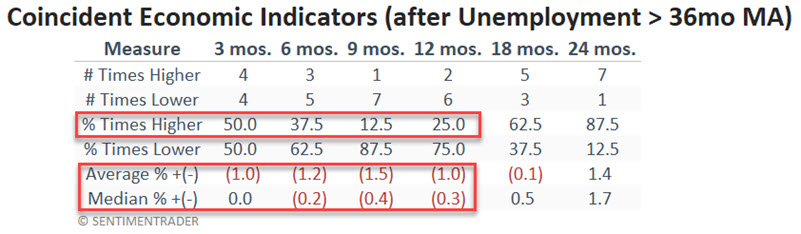
Key things to note:
- Win Rates are below 50% for 6, 9, and 12-month periods
- Average and median % is negative to unchanged for 3 to 12-month periods
- The worst period appears to be nine months, with a Win Rate of just 12.5% and an average CEI decline of -1.5%
The chart below displays the cumulative performance for the Coincident Economic Activity Index (starting with a baseline of 1.00) in the nine months after each cross of the Unemployment Rate above its 36-month average.
What about the stock market?
An idea of what the economy may hold in the future can be helpful in business and financial planning. However, as investors, our goal is to make money. So, a more relevant question regarding unemployment trends, as defined above, is, "How does the stock market react when unemployment starts a new uptrend?" To boil it down, the answer tends to be "in a subpar manner."
The table below displays the S&P 500's performance following any month in which the unemployment rate did not cross above its 36-month moving average.
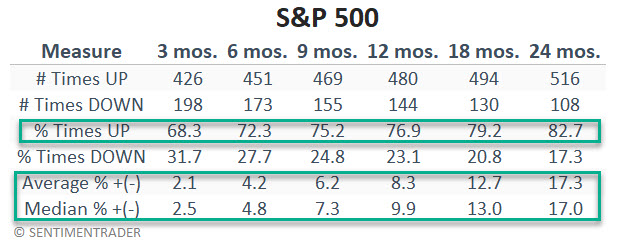
The table below displays S&P 500 performance following only those months when the unemployment rate did end the month, crossing above its 36-month moving average.
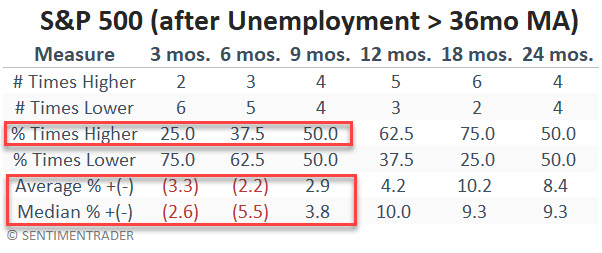
Using month-end closing prices, three and 6-month returns showed negative average and median returns, with Win Rates below 50%. Does this mean the stock market will decline in the months ahead? Not necessarily. Clearly, the trend in Unemployment now falls on the unfavorable side of the weight of the evidence ledger.
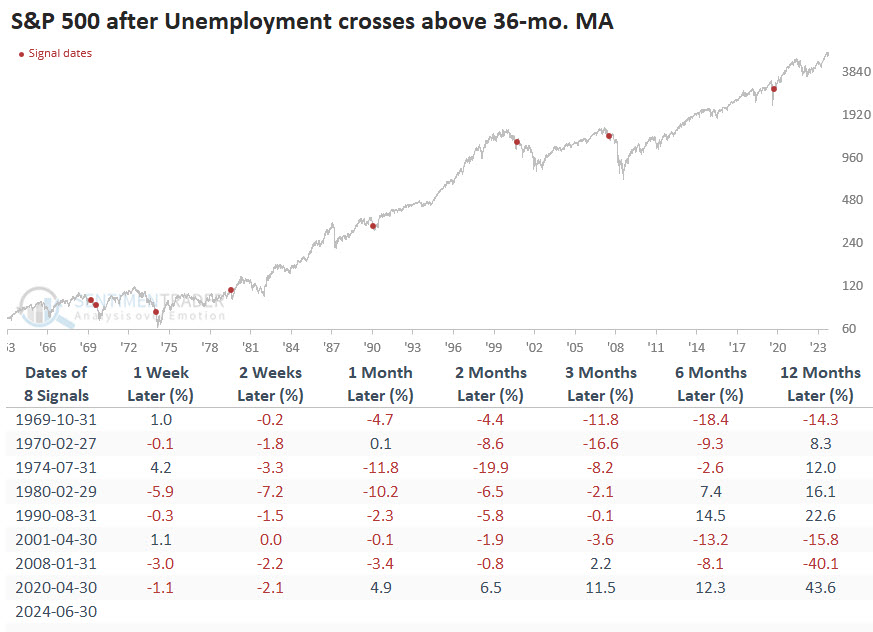
The chart below displays the dates of previous occurrences and subsequent S&P 500 performance.
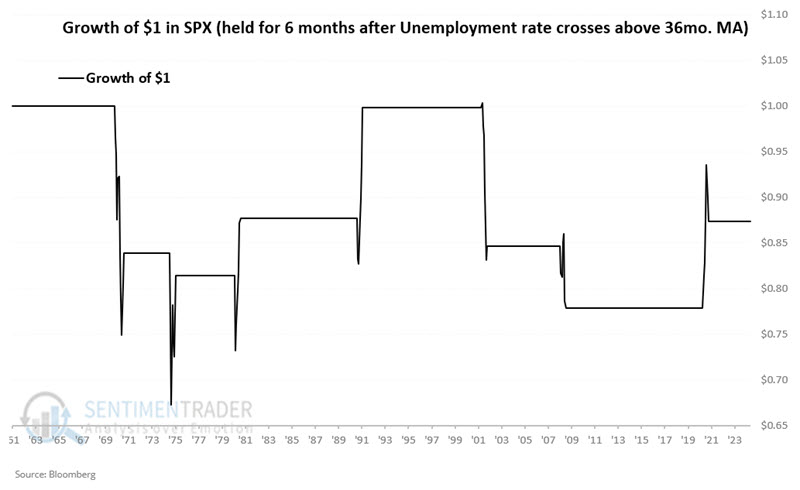
To put it all into perspective, the chart below displays the growth of $1 invested in the S&P 500 for six months after the end of the month, during which the Unemployment Rate is recorded as crossing back above its 36-month moving average.
What the research tells us…
If we were the fear-mongering type, we would shout, "Impending recession, stocks to decline!!" More specifically - based on the numbers above - we could get even more "guruish" and say, "87.5% probability of economic decline over next nine months and 75% probability of lower stock prices over the next three months." But that is not our function. Our job is to analyze relevant data and try to put it into some historical context. So here goes: By one arbitrary form of measurement (the latest monthly reading versus a 36-month moving average), the unemployment rate will end in June with a new uptrend. Historically, this tended to be followed by stock market weakness in the next two weeks to six months and broader economic weakness over the next nine months. The primary caveats are that the sample size is small and that past performance never guarantees future results.