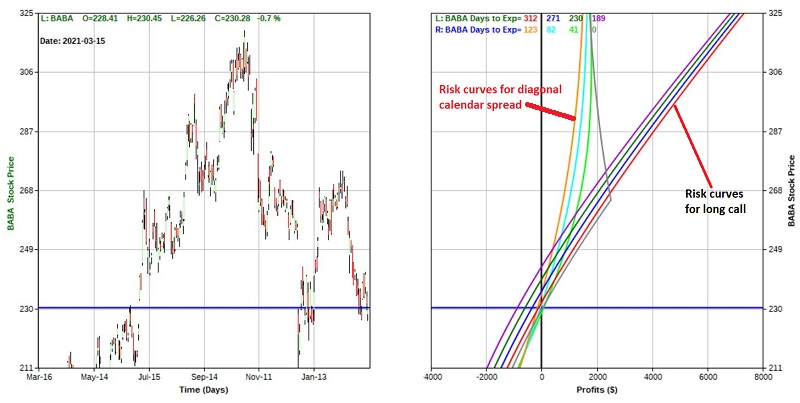
Understanding The Diagonal Calendar Spread
Well, if you never have any intention of ever trading options then it is "class dismissed" early today. I thank you for checking in and I implore you to check back in again next time when I discuss something non-options related.
For those of you who are interested in options, today we are going to talk about one specific strategy in an effort to highlight the pros and cons. That strategy is referred to as a "diagonal calendar spread" and can be used in a variety of situations. We will highlight an example using call options, but the strategy can be used with put options as well.
The strategy using calls involves:
- Buying a longer-term call option at a given strike price AND
- Selling a shorter-term call option at a higher strike price
Rather than try to spell out every possible permutation and outcome I am going to focus on just one example. As always, it needs to be pointed out that the example trade I will discuss is just that - an example - and NOT a specific trade recommendation.
An Example using Ticker BABA
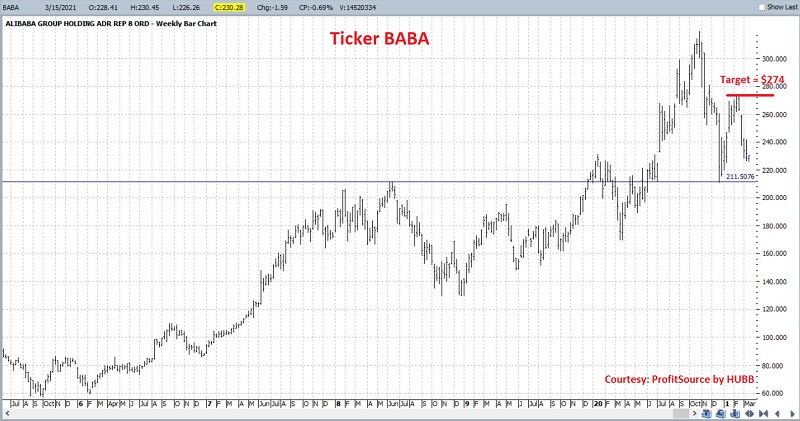
For openers, we are going to assume for this example that a trader looks at the chart below (Courtesy of ProfitSource by HUBB) and believes that ticker BABA:
- will hold above the support line drawn AND
- will work its way higher back up towards the most recent high at around $274 a share sometime in the months ahead
The most straightforward approach to play this scenario would be to buy 100 shares of BABA. At the current price of around $230.28 a share, this would require a capital commitment of $23,028. Let's assume our trader does not have or does not want to commit that amount.
One possibility would be to buy the January 2022 220 strike price call at $41.05. This would require a commitment of $4,105. The particulars for this position appear in the figure below.

The risk curves - which estimate the expected profit/loss for the trade at a given price for BABA as of a given date - appear in the right-hand box in the figure below. The last year of price action for BABA appears in the left-hand box.
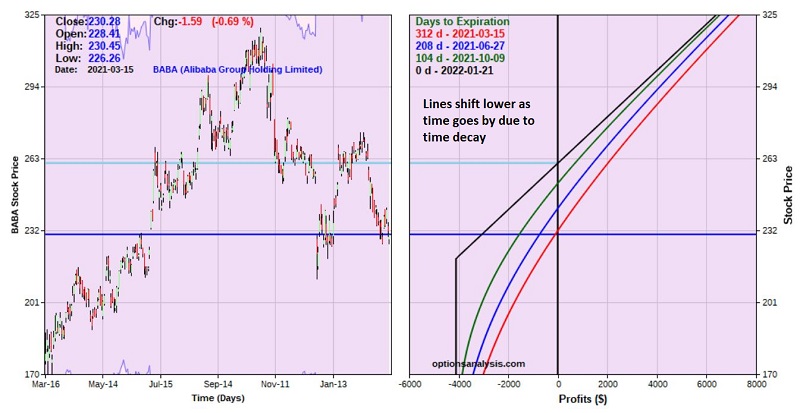
- The red line in the right-hand box displays the expected return at any given price as of today.
- The black line in the right-hand box displays the expected return as of expiration day in January 2022.
- That each successive risk curve shifts to a lower profit (or greater loss) level at any price for BABA illustrates the negative effect of time decay as any time premium built into the price of the option dissipates over time - accelerating as options expiration draws closer. The fact that this trade has negative Theta is what tells us that time decay is working against us.
If BABA reaches the most recent high of $274 (which is about 19% above the current price) this option position will show a profit of between roughly $3,000 and $1,300, depending on whether this price is reached sooner or later (Hint: Sooner - before time decay starts to work against us - is better). - If BABA falls below the previous low near $211 a share this option position will show a loss of between roughly -$1,200 and -$4,000 depending on how quickly price reaches this level.
Now let's consider an alternative.
The Long Diagonal Calendar Spread
In this case the trader:
- buys the January 2022 220 strike price call at $41.10 AND
- sells the July 2021 265 strike price call @ $9.20
In this case, the $920 taken in from selling the July 265 call offsets some of the cost of the January 2022 call. So the cost to enter this trade is $3,190. The particulars for this position appear in the figure below.

The risk curves appear in the figure below.
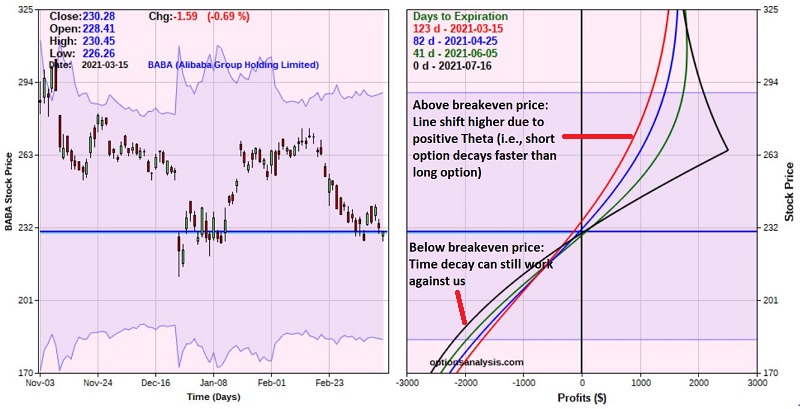
- If BABA reaches the most recent high of $274 this option position will show a profit of between roughly $960 and $2,300 depending on whether price reaches this level sooner or later
- If BABA falls below the previous low near $211 a share this option position will show a loss of between roughly -$760 and -$1,000 depending on whether price reaches this level sooner or later
Note that above the breakeven price time decay actually works in favor of this trade - i.e., the profit level is higher at a given price for BABA as time goes by. This trade has positive Theta, which means that time decay may work in our favor (although it should be noted that if BABA price drops below the breakeven Theta may turn negative and time decay can work against us at that point).
Now let's compare the two trades directly through the July option expiration on July 16th (roughly 120 calendar days out).
The figure below shows risk curves for both trades as of 3 different dates leading up to July option expiration.
It may be a little difficult to decipher what is going on at first blush. So, let's spell it out:
- All of the risk curves in this graph represent dates between the current data and July 16, 2021 (the date the July option will expire)
- The long call position (purple, black and red risk curves) has unlimited profit potential. So, if we are playing for a massive up move in BABA stock this position enjoys a larger potential profit.
- Up through the recent high of $274 a share the two trades have similar profit potential (even though the diagonal calendar spread cost $920 less to enter).
- Below $230 a share and approaching our stop-loss point of $211 the long call can lose up to -$2,000 while the diagonal calendar will likely lose no more than -$1,000.
Assessing the Trade-Offs
As mentioned above, if our objective in taking a position on BABA is to maximize our gains if BABA makes an explosive move higher, then the long call would likely be the best choice. But also remember that at the outset our hypothetical objective was to enter a position in hopes that BABA would retest $274 sometime between now and July options expiration. To zero in, let's strip away the extra risk curves from the chart above and display ONLY
- the risk curve for the long call position
- the risk curve for the long diagonal call calendar spread
- as of July option expiration
In the chart below the purple line represent the expected profit or loss for the long call position as of July expiration and the gray line represents the expected profit or loss for the long call calendar diagonal spread.
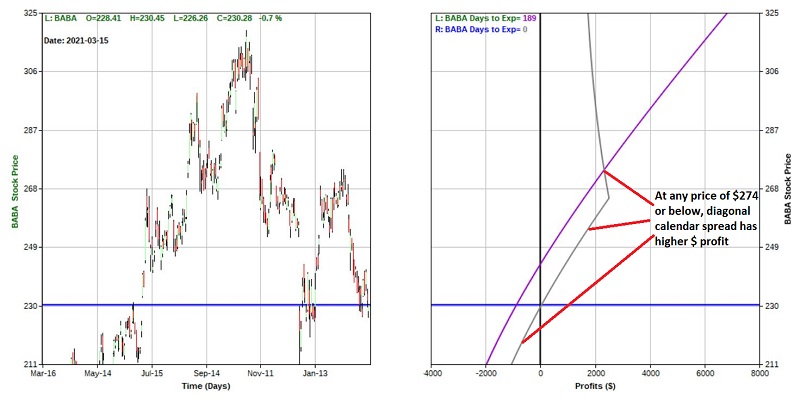
Here is what we find:
- At any price up to roughly $274 a share, the calendar diagonal spread shows a higher dollar profit even though it costs $920 less to enter (by virtue of having sold the July 265 call)
- At any price above $274 a share, the long call will show a higher profit
We cannot definitively state that one trade is "better than the other". We can only assess the tradeoffs between reward and risk and decide what is right for us. But consider this potential trade plan:
- Buy the long calendar diagonal spread
- If BABA price approaches $274 a share AND we expect the price to rise higher still, then buy back the short July call and simply hold the long January 2022 call.
Then we can continue to hold the long call as late as January of 2022 in hopes of a larger price move from BABA.


