Data &
Technology
Research
Reports
Report Solutions
Reports Library
Actionable
Strategies
Free
Resources
Simple Backtest Calculator
Simple Seasonality Calculator
The Kelly Criterion Calculator
Sentiment Geo Map
Public Research Reports
Free Webinar
Pricing
Company
About
Meet Our Team
In the News
Testimonials
Client Success Stories
Contact
Log inLoginSign up
< BACK TO ALL REPORTS

Uncharted waters as Panic Button hits record

Jason Goepfert
2020-03-16
These are uncharted waters. To get a sense for just how much panic is out there, it's time to dust off the Panic Button.

At this point, it might be necessary to toss out any historical comparisons. There's really nothing that investors have faced that can equate to not only the social, fiscal, and monetary developments over the past week, but also the price and selling intensity.

These are uncharted waters.

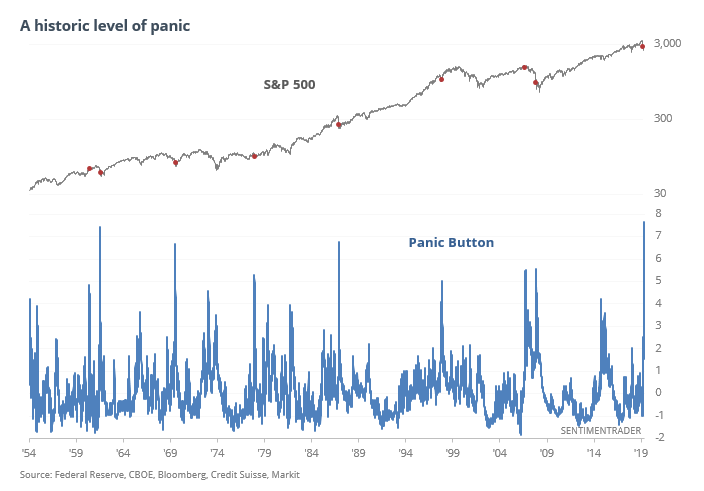
To get a sense for just how much panic is out there, it's time to dust off the Panic Button. We haven't had to update it for more than four years, and it just soared to a record high on Thursday. It ebbed a bit on Friday, but would likely hit another record on Monday if initial indications hold.

The indicator incorporates the TED Spread, Junk Bond Yield Spreads, a ratio of Volatility to 3-Month Treasury Bill Yields and High-Yield CDS Spreads.  All of these spike higher when uncertainty about the economy, corporate outlooks and stock prices are high, and reach extreme high levels only during times of outright panic.

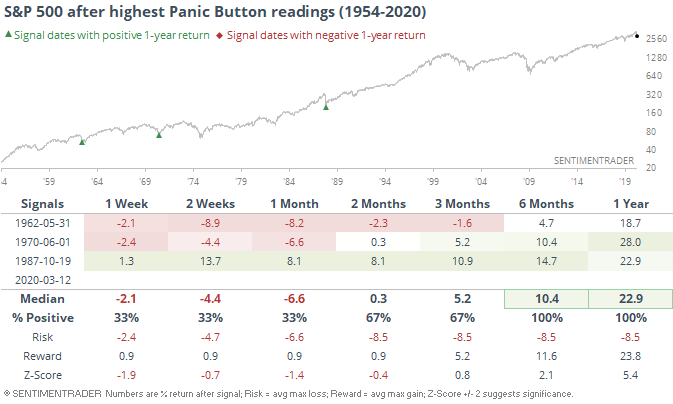
There have been only a few days since 1954 that neared the current level.

With the overnight action, traders are staring once again at massive losses on the opening bell. Pricing in ETFs suggests the losses would be nearly double what's indicated in the futures if the circuit breakers hadn't kicked in. 

There are no real precedents for this, on many levels. If we look at lesser opening losses following what had already been a bad week, there were a few.

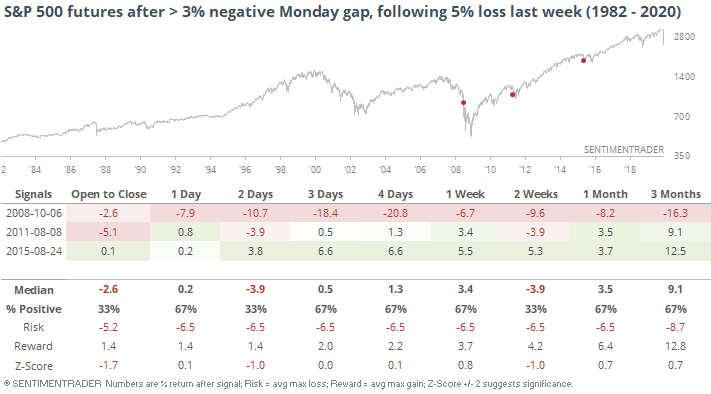
If we just want to look at weekend panics, then there were also a few times the futures gapped down 3% or more following at least a 5% loss last week. Again, these pale to current losses.

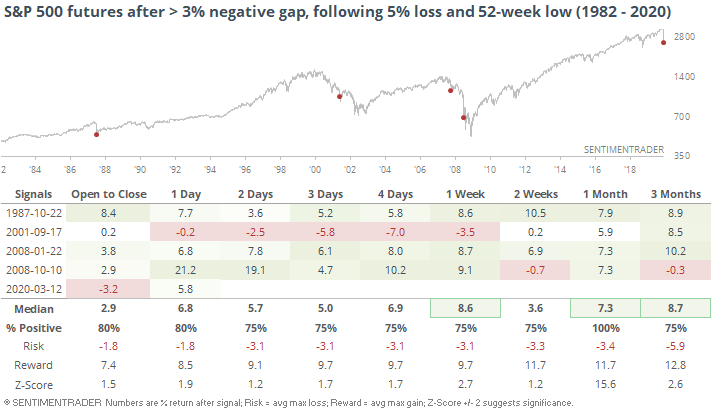
And we might as well re-visit the days that simply showed the largest losses at the open.

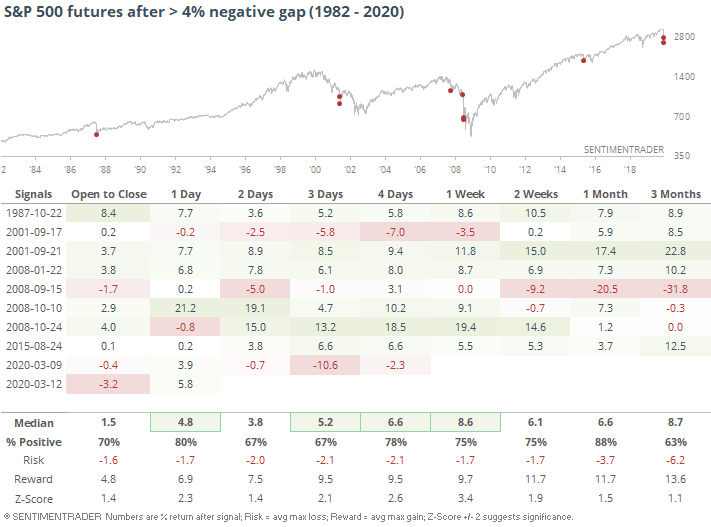
There were a couple in quick succession after 9/11 and a couple near the end of October 2008, but we already saw last week how the average gap over the past week is well beyond any other tine in nearly 40 years.

There is no playbook that can serve as a reasonable playbook here. I spent most of the weekend looking at market closures, wartime, and crises. None of them have seen near what markets have witnessed in just the past week. Governments and financial institutions have indicated they will do whatever it takes, and they likely will.

At any point, even nominal good news in the virus fight could send stocks higher by 15% in minutes...and vice-versa. Volatility will be enormous, to the point where they may have to temporarily close trading for days on end. Based on everything we've looked at, we should still see higher prices over the next couple of months, even within the context of a protracted bear market and recession. It's just hard to rely on "should" when we're essentially required to fly blind.

Sorry, you don't have access to this report

Upgrade your subscription plan to get access
Go to Dasboard
DATA &
TECHnologies
IndicatorEdge
‍
BackTestEdge
‍
Other Tools
‍
DataEdge API
RESEARCH
reports
Research Solution
‍
Reports Library
‍
actionable
Strategies
Trading Strategies
‍
Smart Stock Scanner
‍
FREE
RESOUrCES
Simple Backtest
Calculator
Simple Seasonality
Calculator
The Kelly Criterion
Calculator
Sentiment Geo Map
‍
Public Research Reports
‍
Free Webinar
COMPANY
‍
About
‍
Meet our Team
‍
In the News
‍
Testimonials
‍
Client Success Stories
Pricing
Bundle pricing
‍
Announcements
‍
FAQ
© 2024 Sundial Capital Research Inc. All rights reserved.
Setsail Marketing
TermsPrivacyAffiliate Program
Risk Disclosure: Futures and forex trading contains substantial risk and is not for every investor. An investor could potentially lose all or more than the initial investment. Risk capital is money that can be lost without jeopardizing ones’ financial security or life style. Only risk capital should be used for trading and only those with sufficient risk capital should consider trading. Past performance is not necessarily indicative of future results.

Hypothetical Performance Disclosure: Hypothetical performance results have many inherent limitations, some of which are described below. No representation is being made that any account will or is likely to achieve profits or losses similar to those shown; in fact, there are frequently sharp differences between hypothetical performance results and the actual results subsequently achieved by any particular trading program. One of the limitations of hypothetical performance results is that they are generally prepared with the benefit of hindsight. In addition, hypothetical trading does not involve financial risk, and no hypothetical trading record can completely account for the impact of financial risk of actual trading. for example, the ability to withstand losses or to adhere to a particular trading program in spite of trading losses are material points which can also adversely affect actual trading results. There are numerous other factors related to the markets in general or to the implementation of any specific trading program which cannot be fully accounted for in the preparation of hypothetical performance results and all which can adversely affect trading results.

Testimonial Disclosure: Testimonials appearing on this website may not be representative of other clients or customers and is not a guarantee of future performance or success.