Data &
Technology
Research
Reports
Report Solutions
Reports Library
Actionable
Strategies
Free
Resources
Simple Backtest Calculator
Simple Seasonality Calculator
The Kelly Criterion Calculator
Sentiment Geo Map
Public Research Reports
Free Webinar
Pricing
Company
About
Meet Our Team
In the News
Testimonials
Client Success Stories
Contact
Log inLoginSign up
< BACK TO ALL REPORTS

Two sides of the S&P 500 - total return vs. equal weight

Jason Goepfert
2020-08-11
The S&P 500's total return index, which includes dividends, has hit a new all-time high. The equal-weight version of the index, which puts all of the stocks on equal footing, is still more than 7% below its own high. This has only happened on four other days in 30 years, in late 1999 and early 2000.

We've seen how a few stocks have been taking over the market (here and here) which has masked some underlying weakness (here and here). While the Advance/Decline Line has broken out to a new high, that doesn't mean the gains are evenly spread, not even remotely. The stocks-only A/D Line still remains below its prior high.

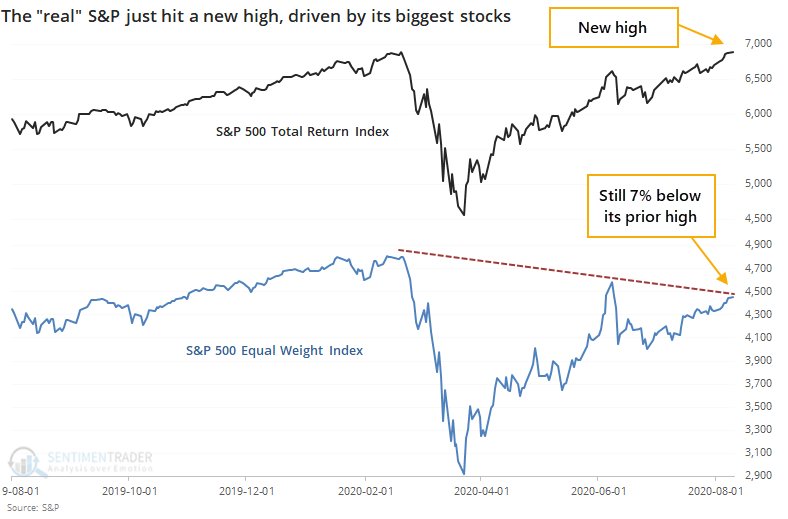
These quirks have allowed the S&P 500's Total Return index to close at a new all-time high. This is the version of the index that takes dividends into account, which is what a "real" investor would receive. Yet the Equal Weight version of the index, which puts all 500+ stocks on equal footing, is still more than 7% below its own high, even though its relative performance has picked up in recent days.

Over the past 30 years, there have only been four other days when this kind of quirk triggered - two days in late December 1999, and two in mid-March 2000. Even when relaxing the parameters to look for a 5% divergence, only a handful more days showed up, mostly around the same time frames.

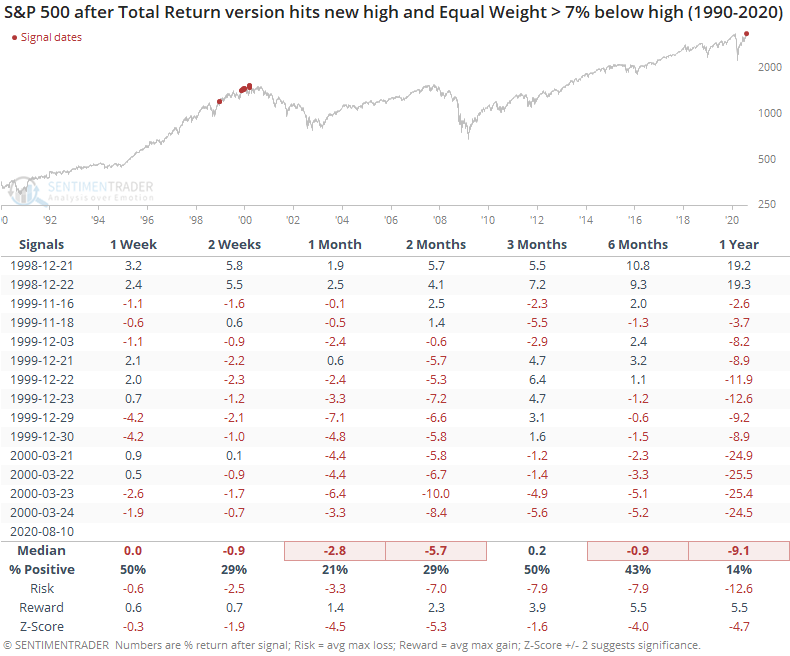
In late 1998, the S&P still managed to show some gains going forward, but the others were disastrous. The Total Return version of the index showed only slightly better returns since dividends weren't much of a factor around that time.

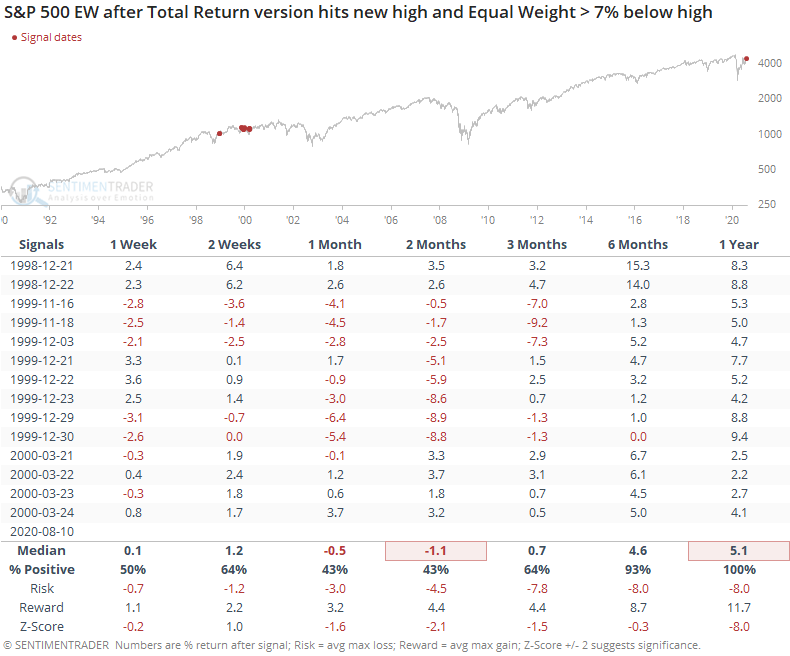
The Equal Weight version of the S&P held up much better.

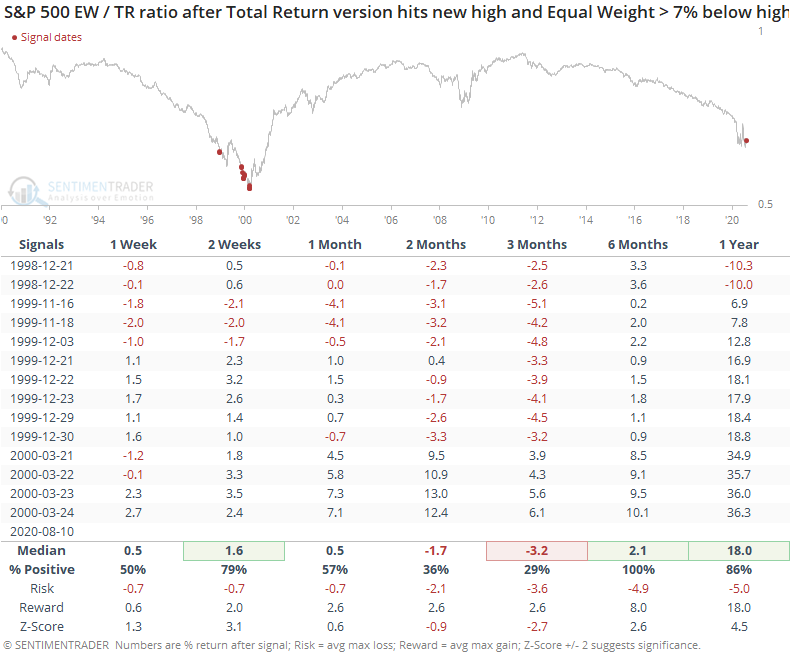
If we look at the ratio of the Equal Weight to Total Return versions of the S&P, it clearly favored the former over the next six months.

With the attention focused on the handful of dramatic winners in recent months, and investors extrapolating those wins far into the future, the risk is high that those extrapolations won't come to fruition. Whether due to competition, new regulations, or simple gravity, the U.S. economy is not set up to reward a near-monopoly for long. Those investors relying on the capitalization-weighted version of the index are at the mercy of that history being rewritten now.

Sorry, you don't have access to this report

Upgrade your subscription plan to get access
Go to Dasboard
DATA &
TECHnologies
IndicatorEdge
‍
BackTestEdge
‍
Other Tools
‍
DataEdge API
RESEARCH
reports
Research Solution
‍
Reports Library
‍
actionable
Strategies
Trading Strategies
‍
Smart Stock Scanner
‍
FREE
RESOUrCES
Simple Backtest
Calculator
Simple Seasonality
Calculator
The Kelly Criterion
Calculator
Sentiment Geo Map
‍
Public Research Reports
‍
Free Webinar
COMPANY
‍
About
‍
Meet our Team
‍
In the News
‍
Testimonials
‍
Client Success Stories
Pricing
Bundle pricing
‍
Announcements
‍
FAQ
© 2024 Sundial Capital Research Inc. All rights reserved.
Setsail Marketing
TermsPrivacyAffiliate Program
Risk Disclosure: Futures and forex trading contains substantial risk and is not for every investor. An investor could potentially lose all or more than the initial investment. Risk capital is money that can be lost without jeopardizing ones’ financial security or life style. Only risk capital should be used for trading and only those with sufficient risk capital should consider trading. Past performance is not necessarily indicative of future results.

Hypothetical Performance Disclosure: Hypothetical performance results have many inherent limitations, some of which are described below. No representation is being made that any account will or is likely to achieve profits or losses similar to those shown; in fact, there are frequently sharp differences between hypothetical performance results and the actual results subsequently achieved by any particular trading program. One of the limitations of hypothetical performance results is that they are generally prepared with the benefit of hindsight. In addition, hypothetical trading does not involve financial risk, and no hypothetical trading record can completely account for the impact of financial risk of actual trading. for example, the ability to withstand losses or to adhere to a particular trading program in spite of trading losses are material points which can also adversely affect actual trading results. There are numerous other factors related to the markets in general or to the implementation of any specific trading program which cannot be fully accounted for in the preparation of hypothetical performance results and all which can adversely affect trading results.

Testimonial Disclosure: Testimonials appearing on this website may not be representative of other clients or customers and is not a guarantee of future performance or success.