
Two key indicators signal an important shift in sentiment

Key points
- Risk on/Risk off behavior can offer important clues to investors
- The relationship between speculative stocks and more stable names recently reached a significant level
- Our Panic/Euphoria Model recently detected a subtle but important shift in sentiment
Speculative stocks are washed out relative to less volatile stocks
Our S&P High Beta / S&P High-Quality Relative Ratio Rank indicator appears in the chart below.
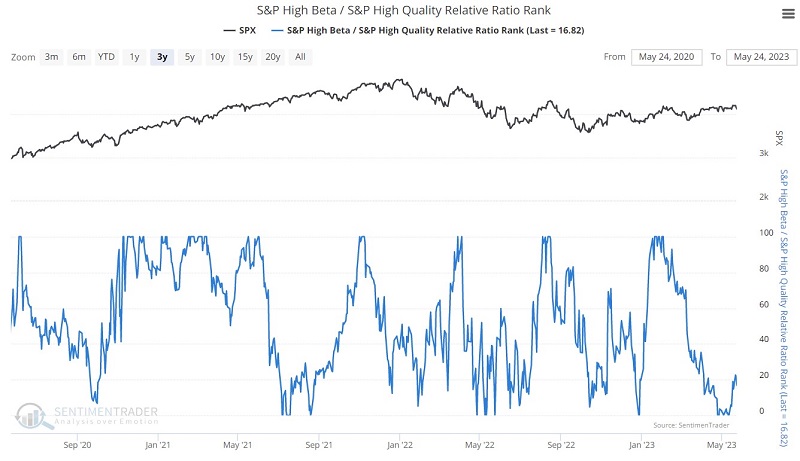
This indicator compares the relative performance of volatile (i.e., more speculative) stocks to that of more stable, less volatile stocks. It shows where the ratio is relative to its range over the past four months. When the relative ratio is high, investors are showing risk-on behavior. When the ratio drops to a low level, they exhibit risk-off behavior.
Generally speaking, a rising trend is bullish, suggesting investors are more willing to take risks and vice versa. However, like most indicators that measure investor sentiment, it is essential to note when they reach an extreme. One way to measure this is to apply a 20-day moving average to the daily readings and look for this moving average to reach an extreme.
The red dots in the chart below highlight those times when the 20-day average for this indicator was below 4.0. A reading this low suggests that investors have essentially thrown in the towel on speculative stocks and are focusing more heavily on defensive stocks. This bearish action is typically a bullish contrarian sign.
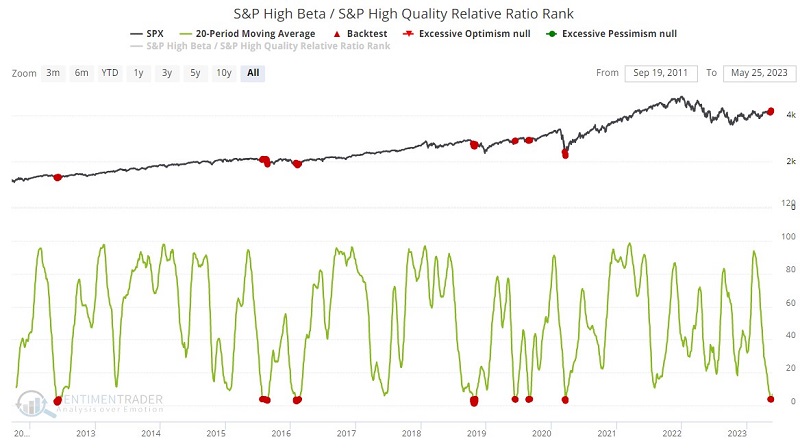
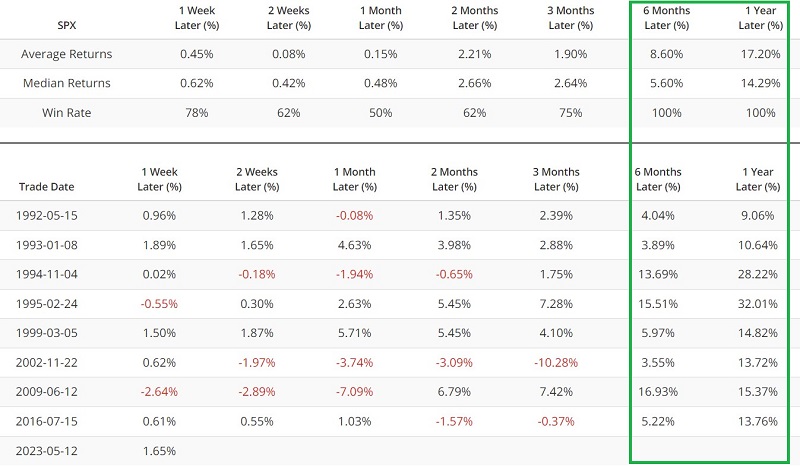
This indicator recently spent three days below 4.0. The table below summarizes S&P 500 Index performance following previous signals.
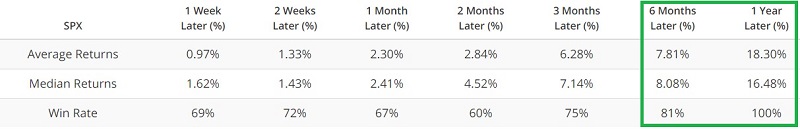
This indicator has a relatively short history, so investors should not assume that the market is sure to rise over the next twelve months. Still, the recent signals fall firmly on the bullish side of the weight of the evidence ledger.
The Panic/Euphoria Model signals an important shift in sentiment
Sometimes market bottoms take a while to play out - and often, the final decline can push an investor's patience and ability to tolerate risk to the limit. Sometimes sentiment and/or breadth indicators can give an oversold signal too early - i.e., before the final plunge. That is why it can be helpful to use these indicators as an after-the-bottom confirmation signal that the bottom is in and the worst is over (OK, at least in theory). Let's look at one way to use the Panic/Euphoria Model this way.
The red dots in the chart below display those occasions when the 20-week average of the Panic/Euphoria Model crossed above 0. For this to happen, the indicator must first fall to - and remain at - a negative value for an extended period. This tends to happen as bearish sentiment reaches an extreme, and this extreme typically occurs at or around significant market bottoms. By the time the 20-week average crosses back above 0, the worst generally is over, and the market is ready to embark on an upward trend. But again, there are no guarantees.
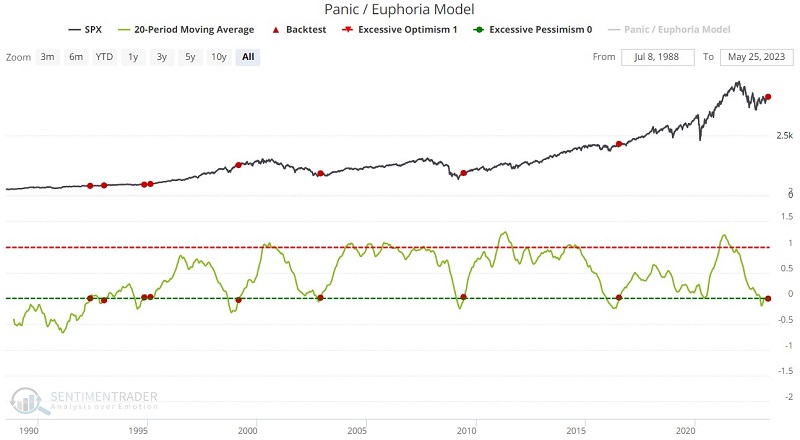
The table below summarizes S&P 500 performance following previous signals.
What the research tells us…
As always, no signal from any indicator or group of indicators guarantees a market bottom or rally. Still, the S&P High Beta / S&P High-Quality Relative Ratio Rank indicator and the Panic/Euphoria Model can highlight when the worst is over for stocks, and more favorable price action may lie ahead. The recent signals from these two indicators add further weight to the bullish case for stocks.