Data &
Technology
Research
Reports
Report Solutions
Reports Library
Actionable
Strategies
Free
Resources
Simple Backtest Calculator
Simple Seasonality Calculator
The Kelly Criterion Calculator
Sentiment Geo Map
Public Research Reports
Free Webinar
Pricing
Company
About
Meet Our Team
In the News
Testimonials
Client Success Stories
Contact
Log inLoginSign up
< BACK TO ALL REPORTS

Two Indicators Flashing Favorable Signs for Stocks - Part II

Jay Kaeppel
2021-10-08
Hedgers typically have a very different objective than the average market speculator. However, when hedgers as a group behave in a particular manner, their actions can offer valuable clues regarding the likely direction of the stock markets. Here in Part II, we highlight the details.

This is Part II of a two-part series highlighting a pair of little-known indicators that recently flashed favorable signals for the stock market. See Part I here.

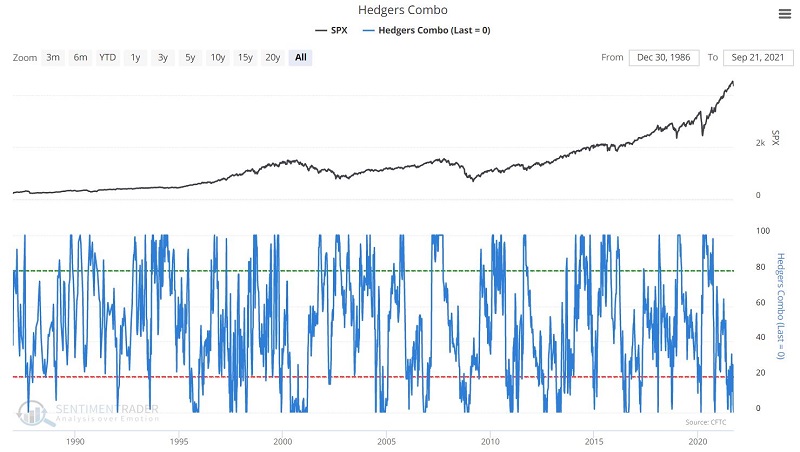
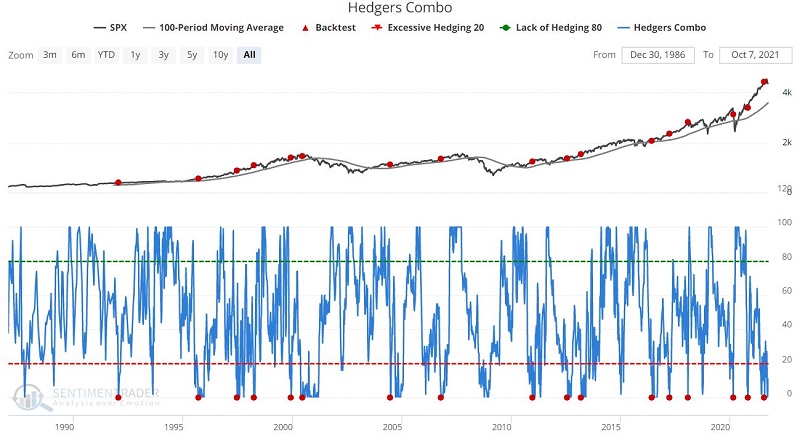
Indicator #2: Hedgers Combo

This chart reflects the positions of large "smart money" commercial hedgers in the S&P 500, Nasdaq 100, and DJIA futures. It combines the full contract and e-mini, adjusting for contract size, and calculates the dollar value of hedgers' positions. The chart shown is a one-year stochastic of this data, so if it reads 100, it means hedgers are the most exposed they have been in at least one year.

THE TEST

Let's highlight the performance for the S&P 500 Index following all days when:

  • The value for this indicator is equal to 0
  • AND SPX is ABOVE its 100-day moving average
  • For the first time in 26 weeks

You can run this test by clicking here. The input screens appear below.

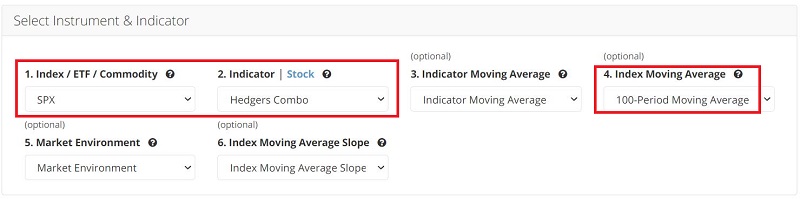
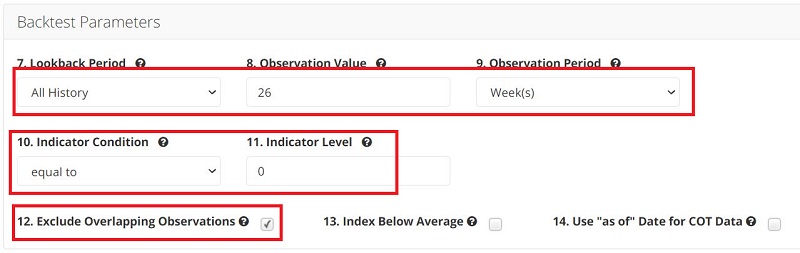
The output screen appears below.


The Summary screen appears below.

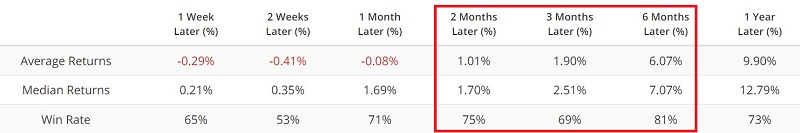
Note the Win Rates and Median Returns for the 2, 3, and 6-month time frames.

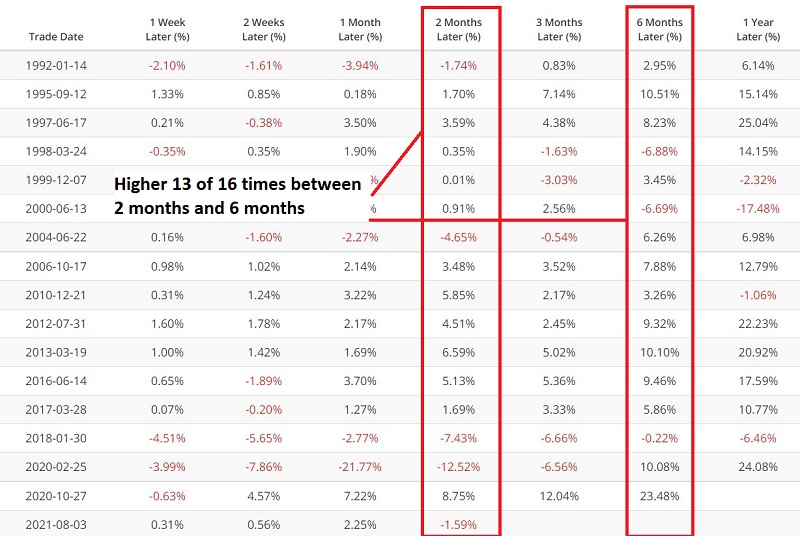
As we see in the screenshot below, the latest signal occurred on 8/3/2021

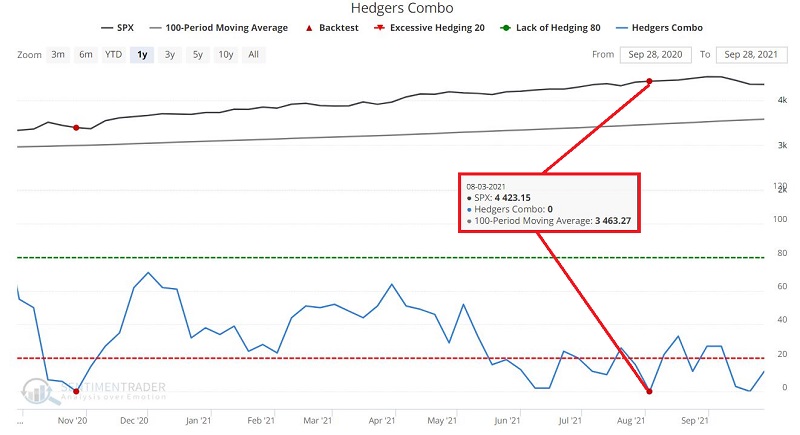
So far, the stock market has performed poorly since the latest signal on 8/3.  However, before dismissing this as an errant signal, note in the table below that the S&P 500 Index has gained ground between the 2-month and 6-month market following 13 of the 16 previous signals (81% of the time).  This tendency argues for a potential advance as the 4th quarter progresses.

Sorry, you don't have access to this report

Upgrade your subscription plan to get access
Go to Dasboard
DATA &
TECHnologies
IndicatorEdge
‍
BackTestEdge
‍
Other Tools
‍
DataEdge API
RESEARCH
reports
Research Solution
‍
Reports Library
‍
actionable
Strategies
Trading Strategies
‍
Smart Stock Scanner
‍
FREE
RESOUrCES
Simple Backtest
Calculator
Simple Seasonality
Calculator
The Kelly Criterion
Calculator
Sentiment Geo Map
‍
Public Research Reports
‍
Free Webinar
COMPANY
‍
About
‍
Meet our Team
‍
In the News
‍
Testimonials
‍
Client Success Stories
Pricing
Bundle pricing
‍
Announcements
‍
FAQ
© 2024 Sundial Capital Research Inc. All rights reserved.
Setsail Marketing
TermsPrivacyAffiliate Program
Risk Disclosure: Futures and forex trading contains substantial risk and is not for every investor. An investor could potentially lose all or more than the initial investment. Risk capital is money that can be lost without jeopardizing ones’ financial security or life style. Only risk capital should be used for trading and only those with sufficient risk capital should consider trading. Past performance is not necessarily indicative of future results.

Hypothetical Performance Disclosure: Hypothetical performance results have many inherent limitations, some of which are described below. No representation is being made that any account will or is likely to achieve profits or losses similar to those shown; in fact, there are frequently sharp differences between hypothetical performance results and the actual results subsequently achieved by any particular trading program. One of the limitations of hypothetical performance results is that they are generally prepared with the benefit of hindsight. In addition, hypothetical trading does not involve financial risk, and no hypothetical trading record can completely account for the impact of financial risk of actual trading. for example, the ability to withstand losses or to adhere to a particular trading program in spite of trading losses are material points which can also adversely affect actual trading results. There are numerous other factors related to the markets in general or to the implementation of any specific trading program which cannot be fully accounted for in the preparation of hypothetical performance results and all which can adversely affect trading results.

Testimonial Disclosure: Testimonials appearing on this website may not be representative of other clients or customers and is not a guarantee of future performance or success.