Data &
Technology
Research
Reports
Report Solutions
Reports Library
Actionable
Strategies
Free
Resources
Simple Backtest Calculator
Simple Seasonality Calculator
The Kelly Criterion Calculator
Sentiment Geo Map
Public Research Reports
Free Webinar
Pricing
Company
About
Meet Our Team
In the News
Testimonials
Client Success Stories
Contact
Log inLoginSign up
< BACK TO ALL REPORTS

Two common sentiment indicators are in complete conflict

Jason Goepfert
2020-07-20
Put/call ratios are low, showing a lack of hedging and a lot of confidence among traders. But the AAII survey is showing extreme pessimism. Who to trust?

Defining "sentiment" isn't a one-sided affair. All of us want to look at a single end-all, be-all indicator of what the hordes are thinking or how they're behaving, but it's just not that simple. Using one metric has been way too prone to error.

The frustrating part about this is that most of the time, at least a few measures are in conflict with each other. There are usually 2-3 times per year in each market where almost everything lines up, and defining where sentiment is can be relatively straightforward. 

Right now, most shorter-term guides are showing a lot of optimism, some on a historic scale. On a medium- to long-term basis, it's much more mixed, and some are even showing outright pessimism, even after a historic rally.

We've looked at these conflicts many times in the past, and one of the most egregious right now is between the options market and some surveys, like AAII. As noted by Urban Carmel, the two have rarely been this much at odds.

Put/call ratio versus AAII survey

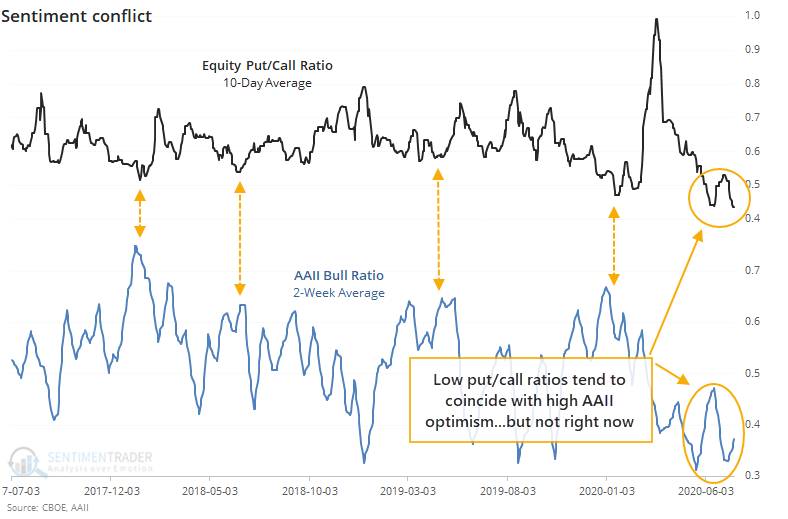
Over the past two weeks, options traders have shown a historic level of speculation, and that has pushed the 10-day Equity-only Put/Call Ratio to its lowest level since the year 2000. At the same time, the AAII survey of individual investors shows a Bull Ratio that ranks among the lowest in the survey's history.

So who do we believe? Are investors in a speculative frenzy as indicated by the options market, or are they depressed like some survey's show?

We always place more weight on real-money indicators as opposed to surveys, because people often say one thing but do another. That's true in real life, and it's true in markets.

If we go back to 1993 and look at other times these indicators diverged, then we can see that the influence of the options extreme was more prevalent in the short-term and the survey long-term.


This is an abridged version of our recent reports and notes. For immediate access with no obligation, sign up for a 30-day free trial now.

We also looked at:

  • A more in-depth look at the put/call ratio versus AAII extremes
  • Industrial production has turned up - what that means for stocks, sectors, and factors
DATA &
TECHnologies
IndicatorEdge
‍
BackTestEdge
‍
Other Tools
‍
DataEdge API
RESEARCH
reports
Research Solution
‍
Reports Library
‍
actionable
Strategies
Trading Strategies
‍
Smart Stock Scanner
‍
FREE
RESOUrCES
Simple Backtest
Calculator
Simple Seasonality
Calculator
The Kelly Criterion
Calculator
Sentiment Geo Map
‍
Public Research Reports
‍
Free Webinar
COMPANY
‍
About
‍
Meet our Team
‍
In the News
‍
Testimonials
‍
Client Success Stories
Pricing
Bundle pricing
‍
Announcements
‍
FAQ
© 2024 Sundial Capital Research Inc. All rights reserved.
Setsail Marketing
TermsPrivacyAffiliate Program
Risk Disclosure: Futures and forex trading contains substantial risk and is not for every investor. An investor could potentially lose all or more than the initial investment. Risk capital is money that can be lost without jeopardizing ones’ financial security or life style. Only risk capital should be used for trading and only those with sufficient risk capital should consider trading. Past performance is not necessarily indicative of future results.

Hypothetical Performance Disclosure: Hypothetical performance results have many inherent limitations, some of which are described below. No representation is being made that any account will or is likely to achieve profits or losses similar to those shown; in fact, there are frequently sharp differences between hypothetical performance results and the actual results subsequently achieved by any particular trading program. One of the limitations of hypothetical performance results is that they are generally prepared with the benefit of hindsight. In addition, hypothetical trading does not involve financial risk, and no hypothetical trading record can completely account for the impact of financial risk of actual trading. for example, the ability to withstand losses or to adhere to a particular trading program in spite of trading losses are material points which can also adversely affect actual trading results. There are numerous other factors related to the markets in general or to the implementation of any specific trading program which cannot be fully accounted for in the preparation of hypothetical performance results and all which can adversely affect trading results.

Testimonial Disclosure: Testimonials appearing on this website may not be representative of other clients or customers and is not a guarantee of future performance or success.