Tuesday Midday Color

Here's what's piquing my interest so far today.
China Surge
Yesterday, we looked at a couple of different metrics related to the move in Chinese stocks. With more data becoming available, its importance starts to stand out a little more.
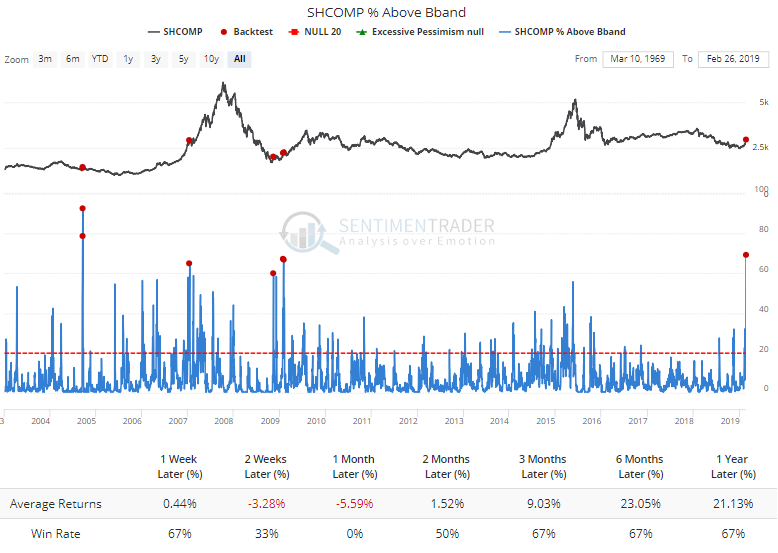
Within the approximately 1500 stocks in the Shanghai Composite, more than 60% jumped above their upper Bollinger Bands. This kind of impulse triggered losses over the next month every time (tiny sample size). Longer-term, two of the three unique occurrences preceded longer-term bull moves.
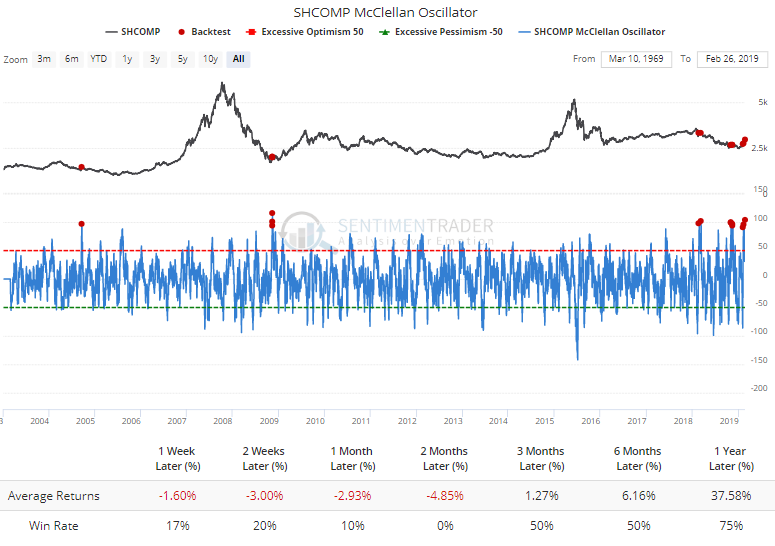
The thrust has also moved its McClellan Oscillator to one of the highest levels in 15 years. Other high readings led to short- to medium-term pullbacks.
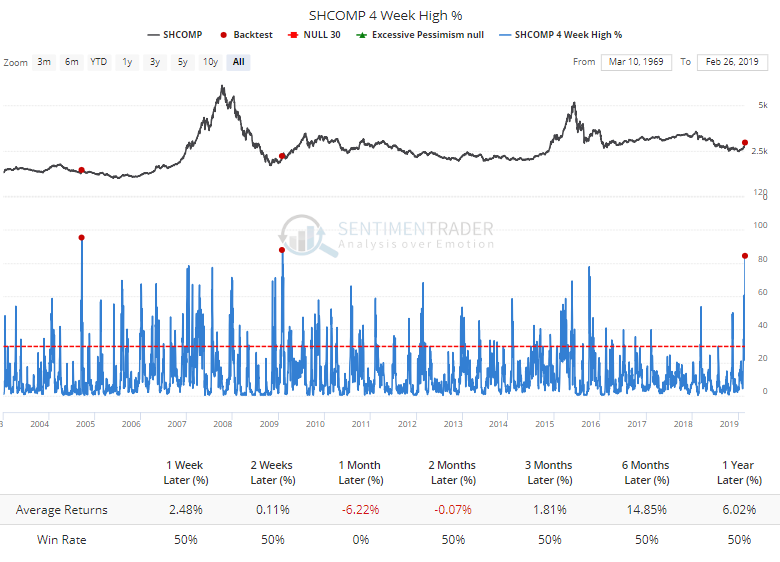
A remarkable 80% of the stocks just hit a 1-month high, a level seen only twice before in the past 15 years.
There has also been a surge in the stocks at 3-month highs and with an overbought RSI, which occurred more frequently and with less negative forward returns, but those tended to occur after the initial surges out of a low like we're seeing now.
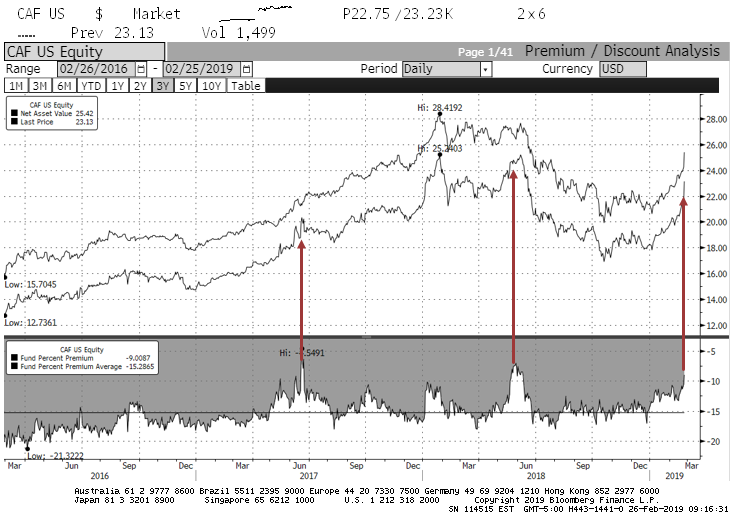
Closed-end funds can be useful for determining retail trader sentiment, and one of the more popular funds that focused on Chinese A-shares is now trading at less than a 10% discount to assets. Over the past few years, that has coincided with peaks in optimism. Note that in some prior years, this actually traded at a premium, so it can get much more extreme.
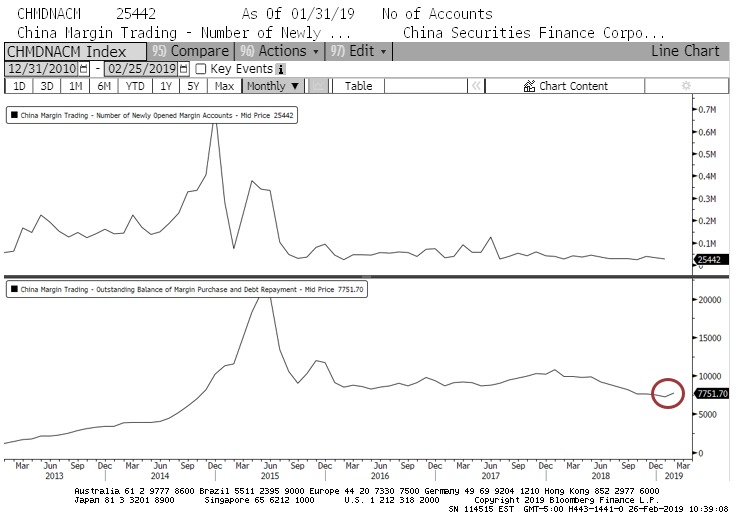
One thing that's probably not a worry? Margin debt. The WSJ asserts that retail investors are back due to a surge in margin trading. But new margin accounts (top pane) are still moribund, and that big uptick in margin debt barely registers on the long-term chart.
Not Perfect
Breadth has been remarkable across markets and sectors, with thrusts like the % above the 50-day average getting so much attention one has to wonder if it's too much attention. Then there are things like a new high in the advance/decline line, which is being taken as gospel that it's a good sign. It usually is, but often fails, too. See the February 25 Daily Report for full details.
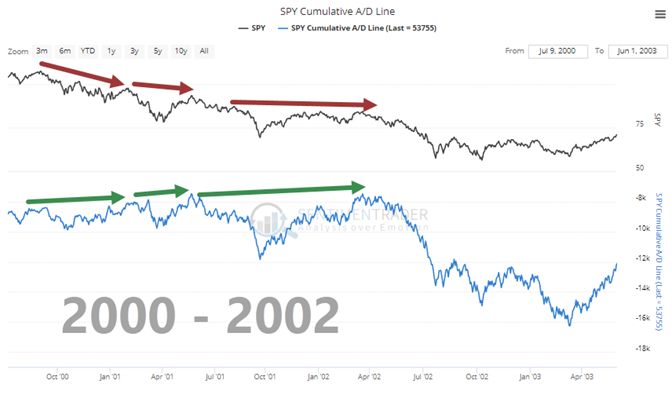
Even if we only include stocks, within the S&P 500, cumulative breadth was excellent in 2001...and would have had us buying all the way down. Just a reminder that nothing's perfect, especially things that are taken for granted.
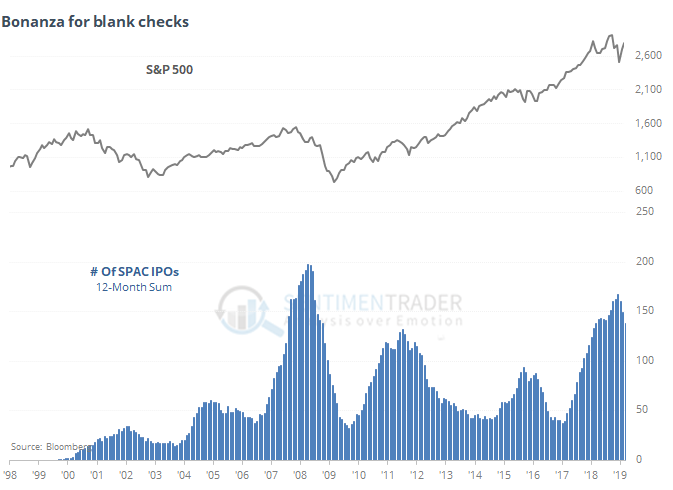
Just Take My Money
The Wall Street Journal noted that there was a surge in blank-check IPOs last year. These are open-ended securities where investors give money to the operators to basically do whatever they want. We only see demand for these securities during periods of extreme risk appetite. A rolling 12-month sum of these IPOs is only now starting to curl lower.
Emerging Strength
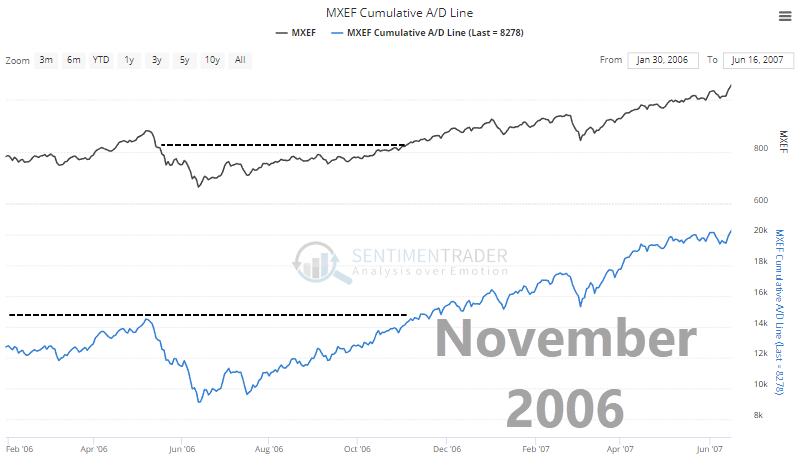
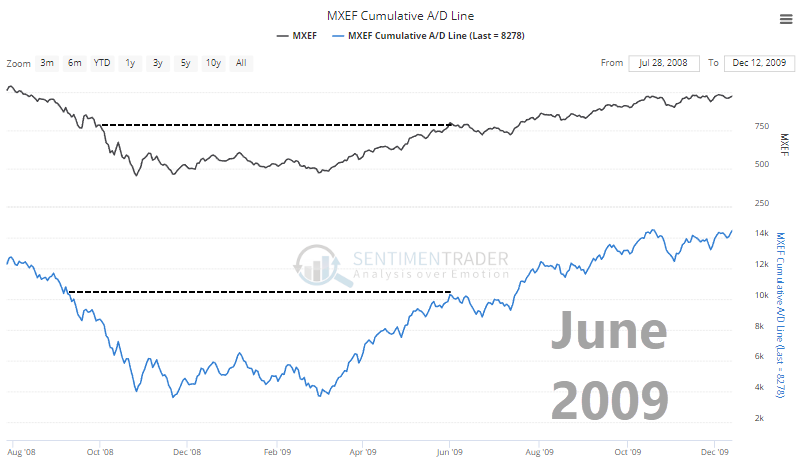
The cumulative advance/decline line for emerging market stocks just broke to its highest level in almost 9 months. The MXEF index is still more than 3% below its own 9-month high.
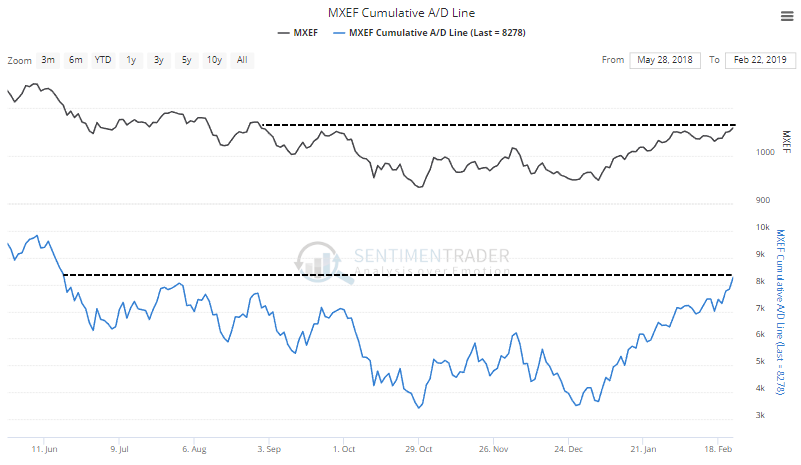
Potentially positive divergences like this don't always mean what they're supposed to, but in this case it has been a good sign. Since 1995, similar setups have only occurred twice, both leading to further sustained upside for emerging markets.