Data &
Technology
Research
Reports
Report Solutions
Reports Library
Actionable
Strategies
Free
Resources
Simple Backtest Calculator
Simple Seasonality Calculator
The Kelly Criterion Calculator
Sentiment Geo Map
Public Research Reports
Free Webinar
Pricing
Company
About
Meet Our Team
In the News
Testimonials
Client Success Stories
Contact
Log inLoginSign up
< BACK TO ALL REPORTS

Tuesday Midday Color

Jason Goepfert
2019-04-09
null

Here's what's piquing my interest so far on yet another day with buyers stepping in on the smallest downtick.

Recovery

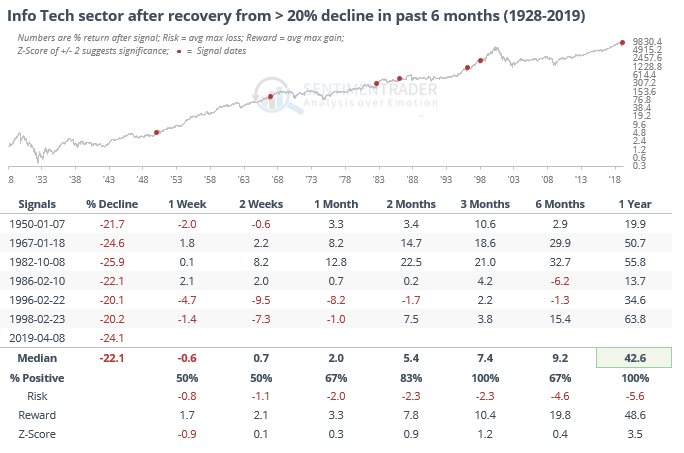
Among the major S&P 500 sectors, the first to entirely erase its decline was information technology, scoring its first new all-time high since last fall. That is a quick turnaround for what many view as an important leading indicator for the entire market. In its history, this ranks as one of only a handful of times info tech has completely erased a 20% decline within six months.

It has been a good sign for forward returns.

It was a good sign for the S&P 500, as well. 

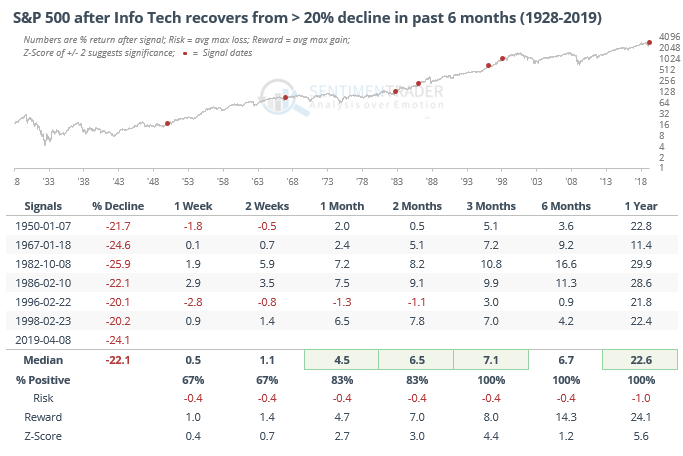
Momentum tends to stick, even in the face of extreme sentiment...

...speaking of which, the spread between Smart and Dumb Money Confidence has reached a true extreme.

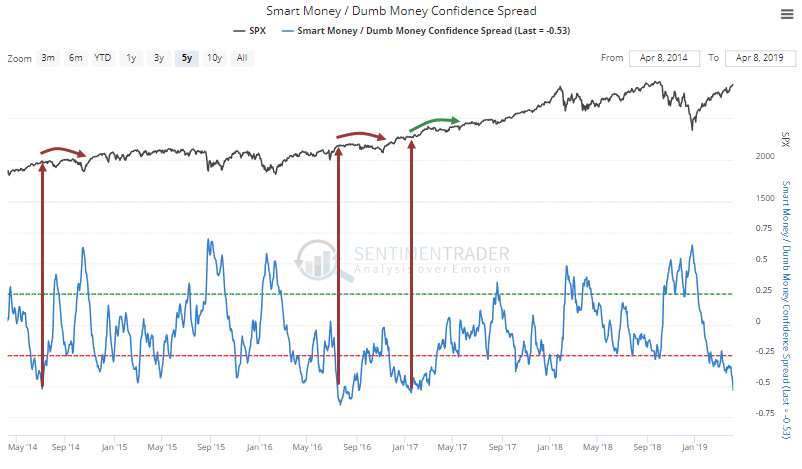
Over the past 5 years, a spread this wide almost top-ticked the S&P in 2014 and 2016, but the incredible trend of 2017 rolled right over it. Historically, when the spread initially gets this wide, stocks have done okay. But it also means stocks are entering a higher-risk phase, and the longer sentiment remains this extreme, the less upside there is.

Going back to 1998, there have been 123 days when the spread was this wide while the S&P was hovering relatively near a high, and over the next three months, the S&P showed a positive return after only 32% of those days. So risk might not be high right now because of extreme sentiment, but it's entering the danger zone.

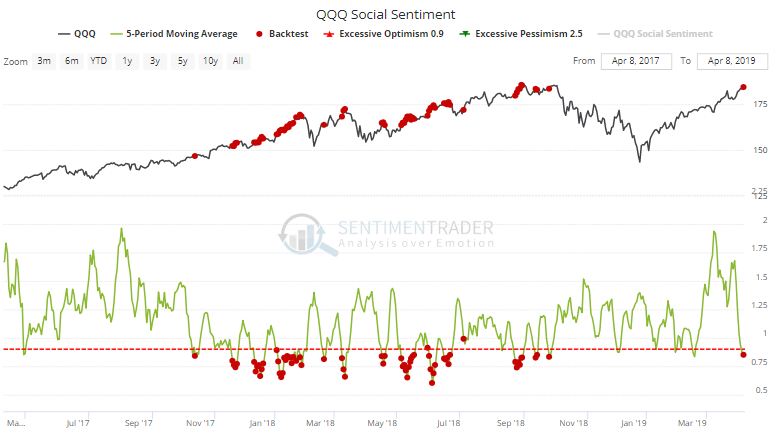
It's also a tiny bit troubling that the Twitterverse is catching on to tech stocks, with an increasingly bullish tone to the tweets.

Over the past 5 days, the average Social Sentiment score on QQQ has reached its most extreme level (fewest bearish vs bullish tweets) since September. This isn't a death knell, but it's a stark change from a few weeks ago.

Breadth Review

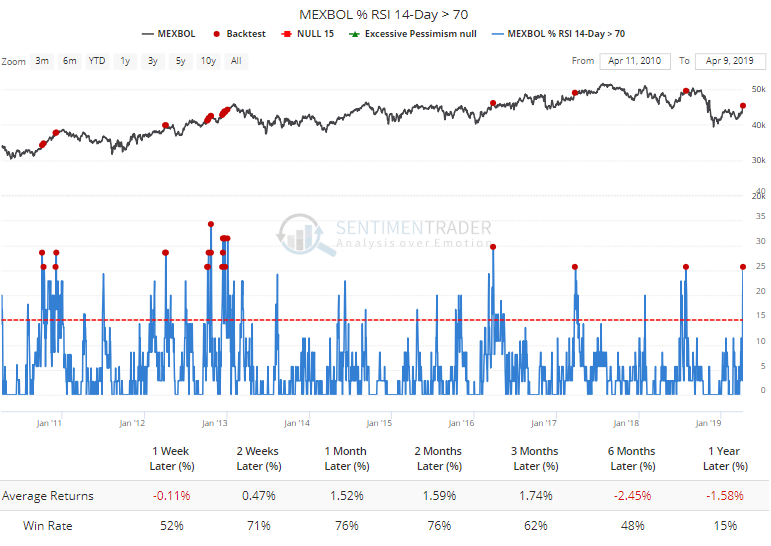
The jump in Mexican stocks has been impressive, and more than a quarter of them in the Mexbol index are now overbought. Since the depths of the financial crisis, this hasn't happened to many times, and it was a mixed blessing.

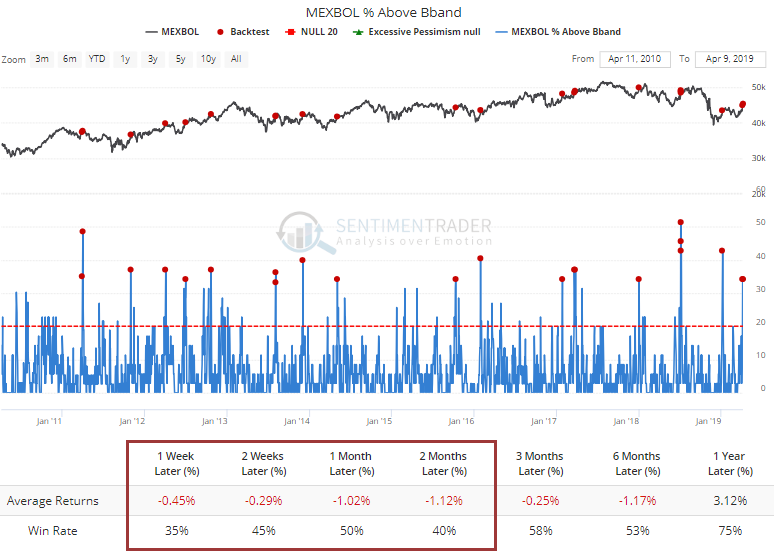
Not only are many of them overbought, but they've surged out of relatively tame trading ranges, pushing more than a third of them above their upper Bollinger Bands. This has been a more consistent signal of too-must-to-fast.

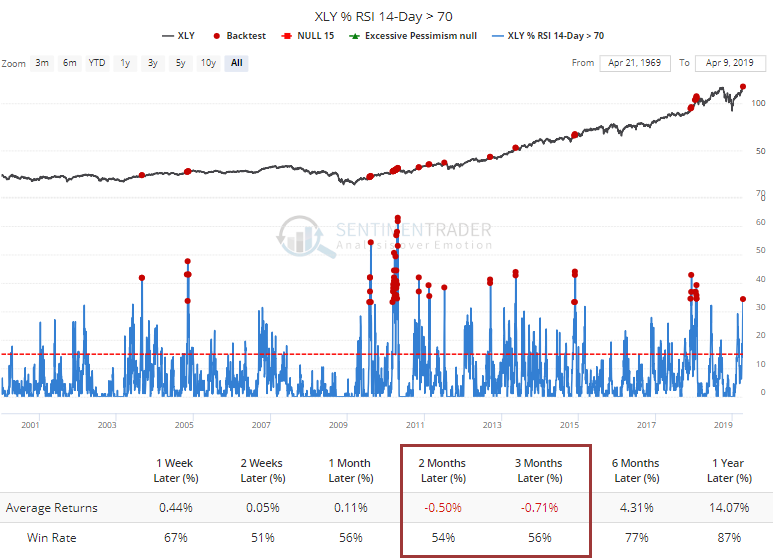
In the U.S., more than a third of consumer discretionary stocks are overbought, not something we see too often. While it didn't lead to exhaustion in early 2010 or 2017, almost all of the other dates saw the sector pull back over the short- to medium-term at some point.

Sorry, you don't have access to this report

Upgrade your subscription plan to get access
Go to Dasboard
DATA &
TECHnologies
IndicatorEdge
‍
BackTestEdge
‍
Other Tools
‍
DataEdge API
RESEARCH
reports
Research Solution
‍
Reports Library
‍
actionable
Strategies
Trading Strategies
‍
Smart Stock Scanner
‍
FREE
RESOUrCES
Simple Backtest
Calculator
Simple Seasonality
Calculator
The Kelly Criterion
Calculator
Sentiment Geo Map
‍
Public Research Reports
‍
Free Webinar
COMPANY
‍
About
‍
Meet our Team
‍
In the News
‍
Testimonials
‍
Client Success Stories
Pricing
Bundle pricing
‍
Announcements
‍
FAQ
© 2024 Sundial Capital Research Inc. All rights reserved.
Setsail Marketing
TermsPrivacyAffiliate Program
Risk Disclosure: Futures and forex trading contains substantial risk and is not for every investor. An investor could potentially lose all or more than the initial investment. Risk capital is money that can be lost without jeopardizing ones’ financial security or life style. Only risk capital should be used for trading and only those with sufficient risk capital should consider trading. Past performance is not necessarily indicative of future results.

Hypothetical Performance Disclosure: Hypothetical performance results have many inherent limitations, some of which are described below. No representation is being made that any account will or is likely to achieve profits or losses similar to those shown; in fact, there are frequently sharp differences between hypothetical performance results and the actual results subsequently achieved by any particular trading program. One of the limitations of hypothetical performance results is that they are generally prepared with the benefit of hindsight. In addition, hypothetical trading does not involve financial risk, and no hypothetical trading record can completely account for the impact of financial risk of actual trading. for example, the ability to withstand losses or to adhere to a particular trading program in spite of trading losses are material points which can also adversely affect actual trading results. There are numerous other factors related to the markets in general or to the implementation of any specific trading program which cannot be fully accounted for in the preparation of hypothetical performance results and all which can adversely affect trading results.

Testimonial Disclosure: Testimonials appearing on this website may not be representative of other clients or customers and is not a guarantee of future performance or success.