Data &
Technology
Research
Reports
Report Solutions
Reports Library
Actionable
Strategies
Free
Resources
Simple Backtest Calculator
Simple Seasonality Calculator
The Kelly Criterion Calculator
Sentiment Geo Map
Public Research Reports
Free Webinar
Pricing
Company
About
Meet Our Team
In the News
Testimonials
Client Success Stories
Contact
Log inLoginSign up
< BACK TO ALL REPORTS

Tuesday Midday Color

Jason Goepfert
2019-03-26
null

Here's what's piquing my interest so far on this recovery day.

Waning Confidence

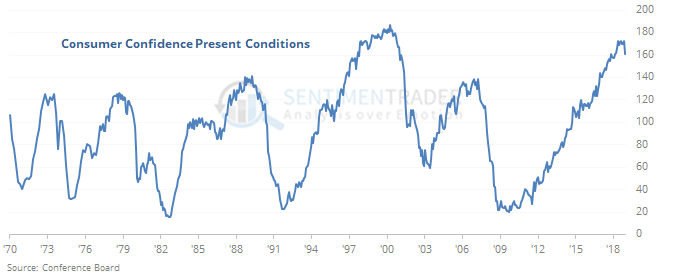
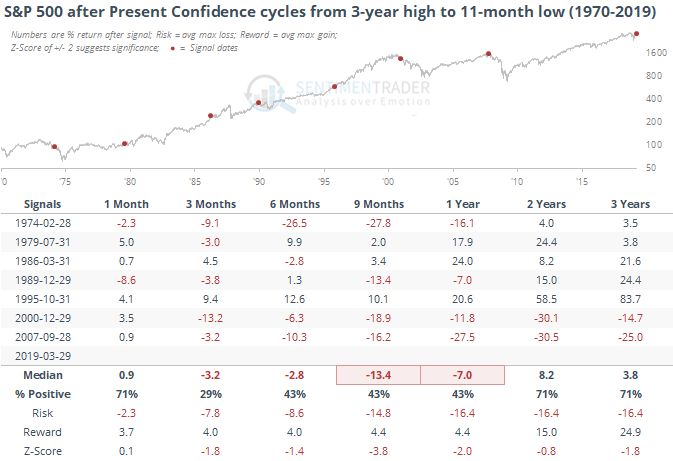
Today's release of the Conference Board's latest readings on consumer confidence revealed that attitudes about present conditions are at the lowest point in nearly a year. This is coming on the heels of what had been a multi-year high in confidence.

When confidence in consumers' present conditions has rolled over from a multi-year high in the past, it has not been good for stocks.

Pick Your Side

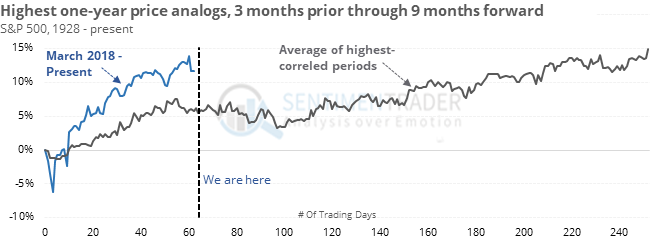
Every few months, there seems to be a rash of analogs comparing the current structure of the S&P 500 to some other disastrous year. Or a super bullish one, depending on the outlook the analyst wants to give. Currently, there are two comparisons that have been tossed around, from 1937 (disaster) and to 1995 to 2015 (bullish).

As always, let's forget the cherry-picking and look at the highest-correlated one-year patterns since 1928. There have been 17 time periods with a one-year correlation above 60%, and their median price path, by definition, is very close to what we've seen over the past year.

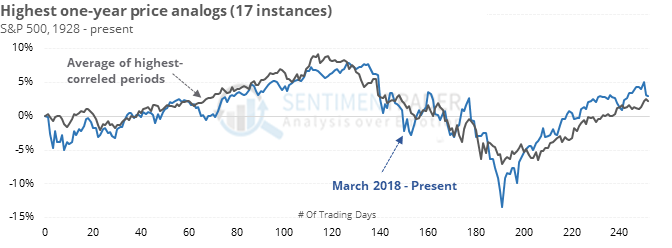
The biggest question is what comes next. If we roll forward, we can see that when the patterns reached their current juncture, there was most often some modest backing-and-filling before a resumption of the recoveries.

Bad Breadth

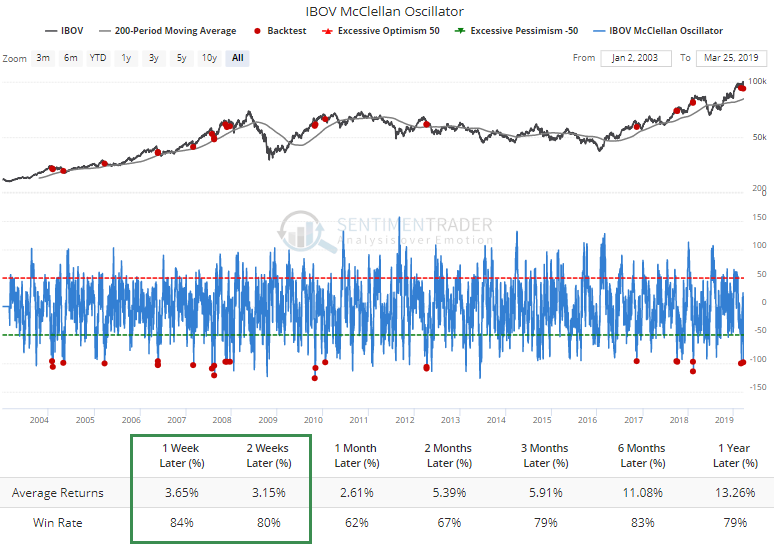
When the Ibovespa was hitting new highs last week, we looked at some cracks under the surface. The index subsequently fell nearly 7% and that generated at least one notable extreme, with a McClellan Oscillator that nearly touched -100. When the index is still above its 200-day average, that has indicated a tendency to snap back during the next week or two.

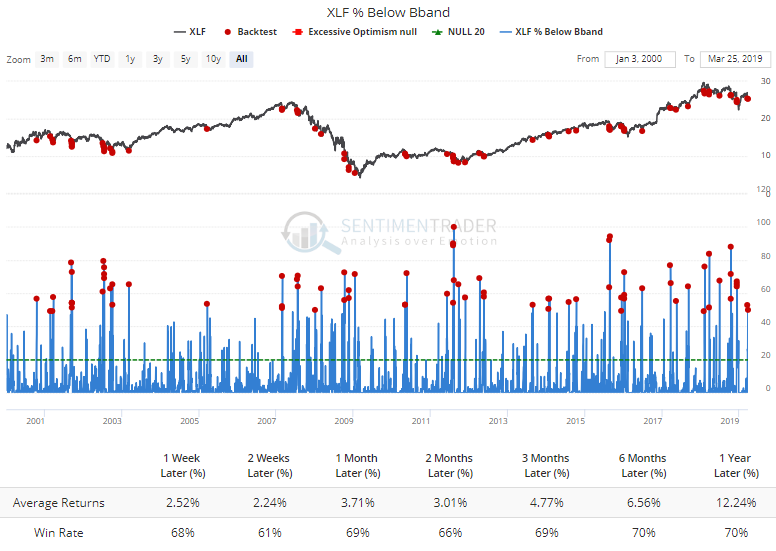
The sharp drop in financials has led to half of them trading below their lower Bollinger Bands. This has been a decent sign of excessive short-term selling pressure.

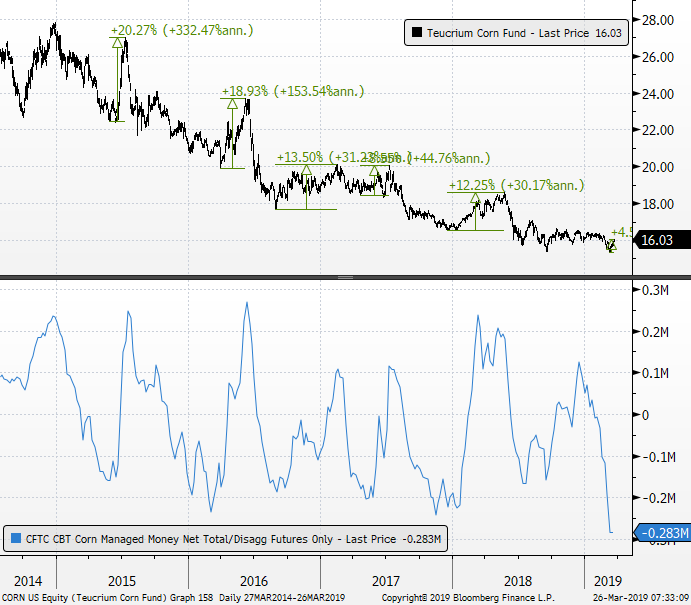
Corn Emerging From Hole

Some of the grains are finally starting to move. The CORN fund is up a little over 4% from its lows. The latest CoT report shows that money managers were holding a record short position, which has led to a rally of at least 8% off the lows the other times, so should still be more to go here.

Sorry, you don't have access to this report

Upgrade your subscription plan to get access
Go to Dasboard
DATA &
TECHnologies
IndicatorEdge
‍
BackTestEdge
‍
Other Tools
‍
DataEdge API
RESEARCH
reports
Research Solution
‍
Reports Library
‍
actionable
Strategies
Trading Strategies
‍
Smart Stock Scanner
‍
FREE
RESOUrCES
Simple Backtest
Calculator
Simple Seasonality
Calculator
The Kelly Criterion
Calculator
Sentiment Geo Map
‍
Public Research Reports
‍
Free Webinar
COMPANY
‍
About
‍
Meet our Team
‍
In the News
‍
Testimonials
‍
Client Success Stories
Pricing
Bundle pricing
‍
Announcements
‍
FAQ
© 2024 Sundial Capital Research Inc. All rights reserved.
Setsail Marketing
TermsPrivacyAffiliate Program
Risk Disclosure: Futures and forex trading contains substantial risk and is not for every investor. An investor could potentially lose all or more than the initial investment. Risk capital is money that can be lost without jeopardizing ones’ financial security or life style. Only risk capital should be used for trading and only those with sufficient risk capital should consider trading. Past performance is not necessarily indicative of future results.

Hypothetical Performance Disclosure: Hypothetical performance results have many inherent limitations, some of which are described below. No representation is being made that any account will or is likely to achieve profits or losses similar to those shown; in fact, there are frequently sharp differences between hypothetical performance results and the actual results subsequently achieved by any particular trading program. One of the limitations of hypothetical performance results is that they are generally prepared with the benefit of hindsight. In addition, hypothetical trading does not involve financial risk, and no hypothetical trading record can completely account for the impact of financial risk of actual trading. for example, the ability to withstand losses or to adhere to a particular trading program in spite of trading losses are material points which can also adversely affect actual trading results. There are numerous other factors related to the markets in general or to the implementation of any specific trading program which cannot be fully accounted for in the preparation of hypothetical performance results and all which can adversely affect trading results.

Testimonial Disclosure: Testimonials appearing on this website may not be representative of other clients or customers and is not a guarantee of future performance or success.