Data &
Technology
Research
Reports
Report Solutions
Reports Library
Actionable
Strategies
Free
Resources
Simple Backtest Calculator
Simple Seasonality Calculator
The Kelly Criterion Calculator
Sentiment Geo Map
Public Research Reports
Free Webinar
Pricing
Company
About
Meet Our Team
In the News
Testimonials
Client Success Stories
Contact
Log inLoginSign up
< BACK TO ALL REPORTS

Tuesday Midday Color

Jason Goepfert
2019-04-02
null

Here's what's piquing my interest so far today.

Breadth Review

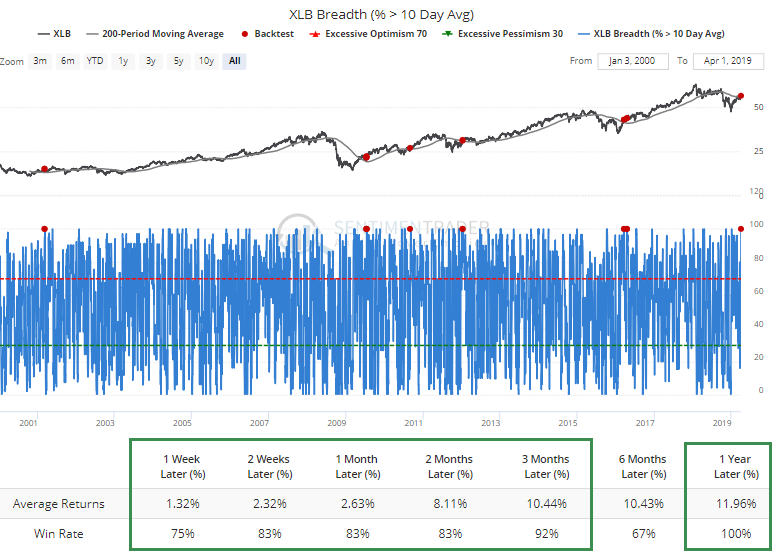
The jump on Monday triggered a number of new extremes. Every material stock rose above their 10-day moving averages, which we don't see too often. If we add some context and look for times it triggered when XLB rose above a declining 200-day average (emerging out of a downtrend), then it was a good sign of a thrust that typically continued to play out in the months ahead.

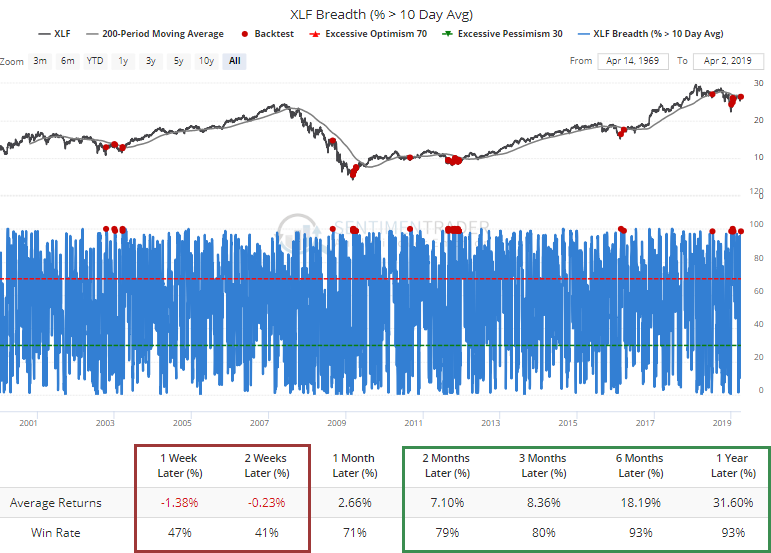
There was a similar jump in financials, with more than 98% of them trading above their short-term averages. XLF is still trading below its 200-day average. Similar conditions typically led to short-term weakness, long-term strength. There was a big failure right before the final plunge of the financial crisis, but other than that it was a good medium- to long-term sign.

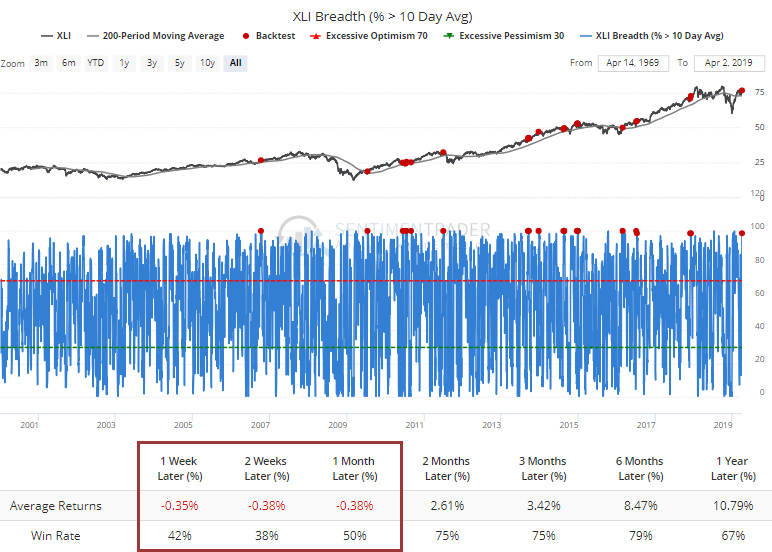
Almost every industrial stock is also trading above its 10-day average. During uptrends, that has preceded some short-term exhaustion for XLI.

Same with tech stocks.
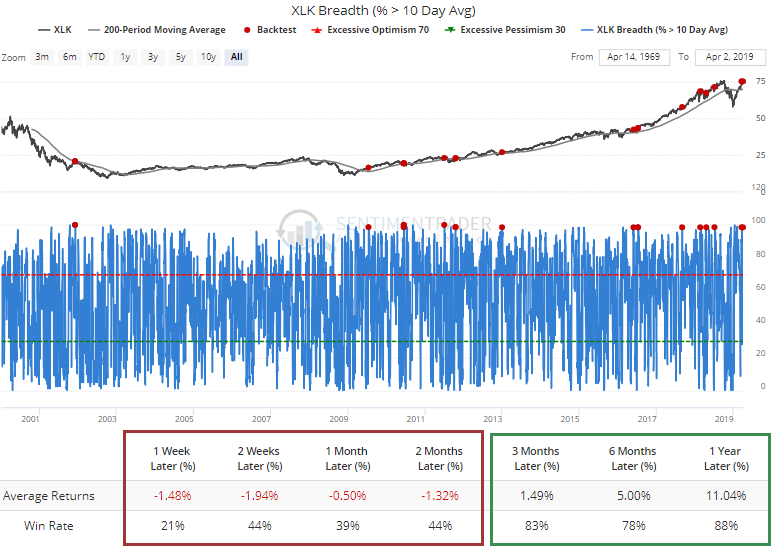
So Many Extremes

On an average day over the past 50 sessions, a third of our core indicators were showing excessive optimism. That's the most, and most prolonged, since early 2018. Historically, a reading this high has been unusual. The S&P's returns over the short- to medium-term were still positive, but less than random.

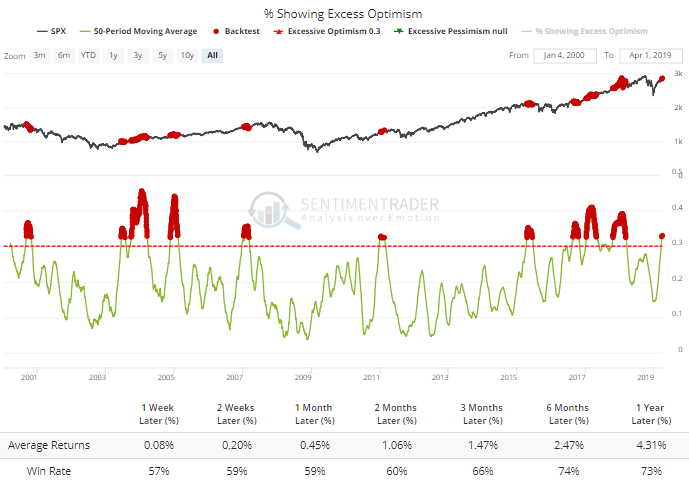
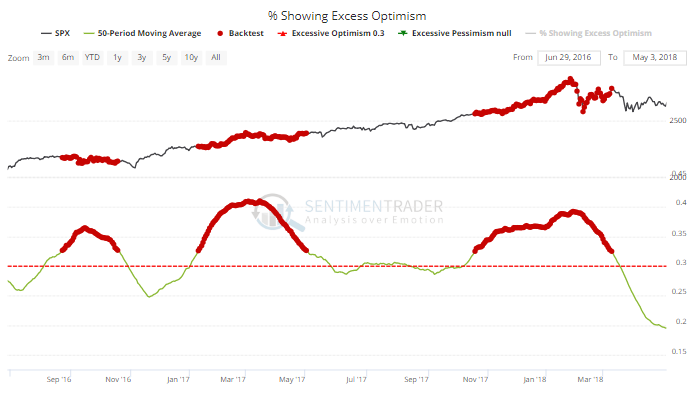
The key reason why returns were positive on average was the mo-mo market of 2017. Early that year, and again near the end of the year, the 50-day average got as high as it is now, yet stocks continued to levitate.

If we exclude only 2017 from the results since 1999, then the forward returns become more troublesome.

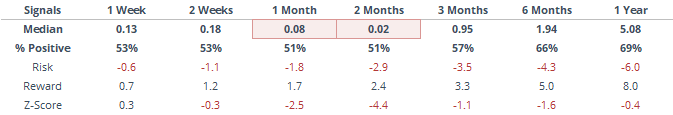
In this case, the S&P's average two-month return was more than 4 standard deviations below random. Of course, this is in direct opposition to the price-momentum studies we've looked at in recent days, and that's the struggle here - if the momentum enough to override what has typically been poor returns following extended bouts of optimism. So far, the answer is yes.

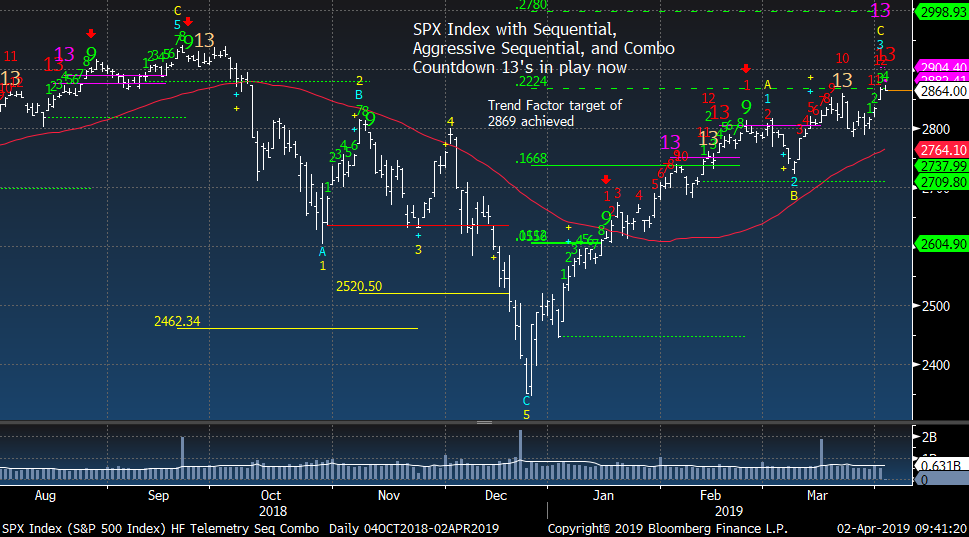
It is a bit more worrisome that some other technical exhaustion signals are triggering now, such as DeMark countdowns. When those occur in the context of extreme sentiment, they have a good record at signalling imminent (though not necessarily significant) pullbacks (via Tommy Thornton).
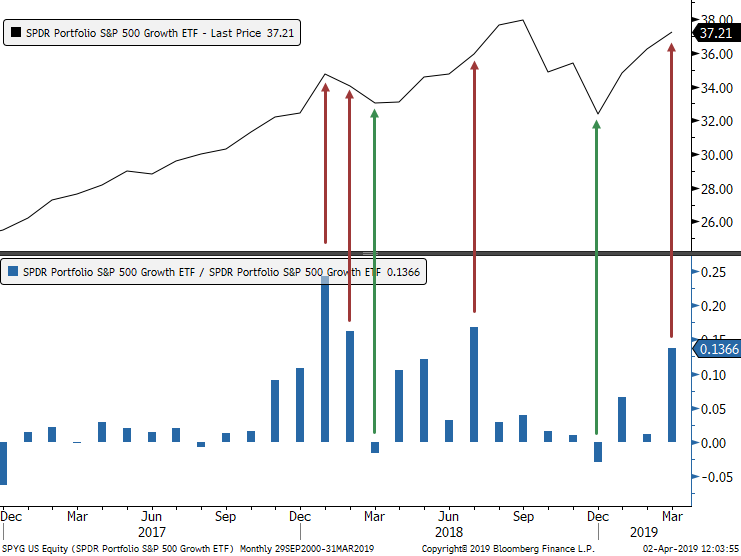
Go For Growth

Bloomberg noted that investors have flooded into an "old" S&P 500 growth ETF, with a record intake in March. Similar inflows preceded peaks in the fund (and stocks in general). As a sign of excessive risk-on appetite, this is disturbing.

If we adjust the inflows for the asset level, then it's not quite as extreme. As more than 13% of all assets, the March inflow was still extremely high, though.

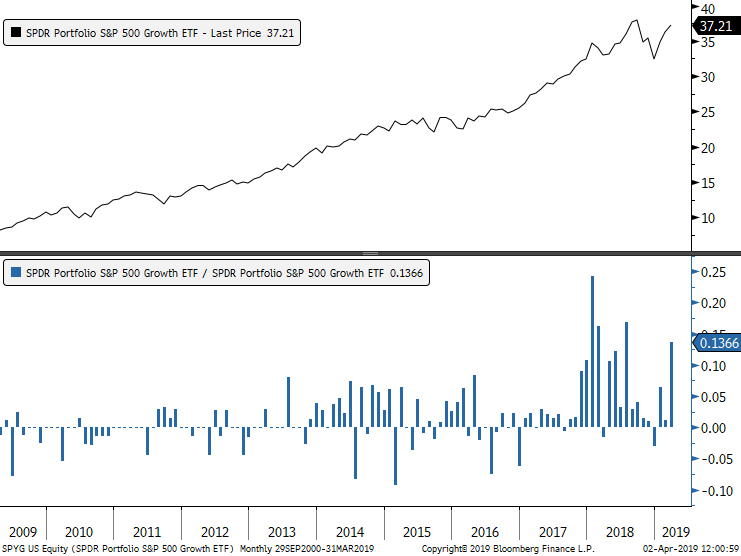
Over the past couple of years, these traders have been especially poor market-timers, getting out at the lows and surging back in just as growth stocks were about to take a breather. This is a minor worry here.

Sorry, you don't have access to this report

Upgrade your subscription plan to get access
Go to Dasboard
DATA &
TECHnologies
IndicatorEdge
‍
BackTestEdge
‍
Other Tools
‍
DataEdge API
RESEARCH
reports
Research Solution
‍
Reports Library
‍
actionable
Strategies
Trading Strategies
‍
Smart Stock Scanner
‍
FREE
RESOUrCES
Simple Backtest
Calculator
Simple Seasonality
Calculator
The Kelly Criterion
Calculator
Sentiment Geo Map
‍
Public Research Reports
‍
Free Webinar
COMPANY
‍
About
‍
Meet our Team
‍
In the News
‍
Testimonials
‍
Client Success Stories
Pricing
Bundle pricing
‍
Announcements
‍
FAQ
© 2024 Sundial Capital Research Inc. All rights reserved.
Setsail Marketing
TermsPrivacyAffiliate Program
Risk Disclosure: Futures and forex trading contains substantial risk and is not for every investor. An investor could potentially lose all or more than the initial investment. Risk capital is money that can be lost without jeopardizing ones’ financial security or life style. Only risk capital should be used for trading and only those with sufficient risk capital should consider trading. Past performance is not necessarily indicative of future results.

Hypothetical Performance Disclosure: Hypothetical performance results have many inherent limitations, some of which are described below. No representation is being made that any account will or is likely to achieve profits or losses similar to those shown; in fact, there are frequently sharp differences between hypothetical performance results and the actual results subsequently achieved by any particular trading program. One of the limitations of hypothetical performance results is that they are generally prepared with the benefit of hindsight. In addition, hypothetical trading does not involve financial risk, and no hypothetical trading record can completely account for the impact of financial risk of actual trading. for example, the ability to withstand losses or to adhere to a particular trading program in spite of trading losses are material points which can also adversely affect actual trading results. There are numerous other factors related to the markets in general or to the implementation of any specific trading program which cannot be fully accounted for in the preparation of hypothetical performance results and all which can adversely affect trading results.

Testimonial Disclosure: Testimonials appearing on this website may not be representative of other clients or customers and is not a guarantee of future performance or success.