Data &
Technology
Research
Reports
Report Solutions
Reports Library
Actionable
Strategies
Free
Resources
Simple Backtest Calculator
Simple Seasonality Calculator
The Kelly Criterion Calculator
Sentiment Geo Map
Public Research Reports
Free Webinar
Pricing
Company
About
Meet Our Team
In the News
Testimonials
Client Success Stories
Contact
Log inLoginSign up
< BACK TO ALL REPORTS

Tuesday Midday Color

Jason Goepfert
2019-03-19
null

Here's what's piquing my interest so far today.

Cautious

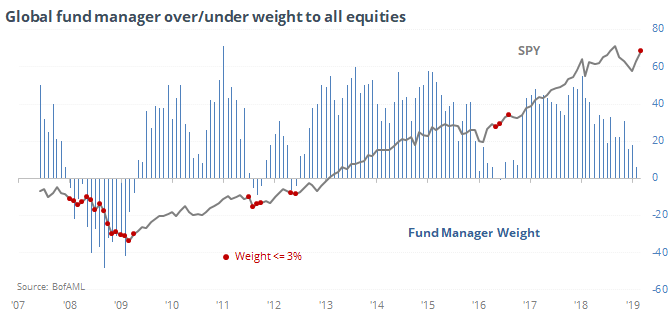
According to the latest monthly BofA fund manager survey, big money managers are still not showing any optimism toward equities as a general asset class, with only a 3% overweight. It has been declining consistently for the past 2 years and is now the lowest in 30 months.

This is not an automatic buy signal. Fund managers held a low (and declining) allocation throughout the 2008 bear market, so trying to fade that in a contrarian way was painful. They also held this low of an allocation in July 2011 and August 2016, after which the S&P declined more than 10% and 2%, respectively, over the next 1-2 months. Otherwise, though, the signals were better taken as contrarian signals.

No Pessimism

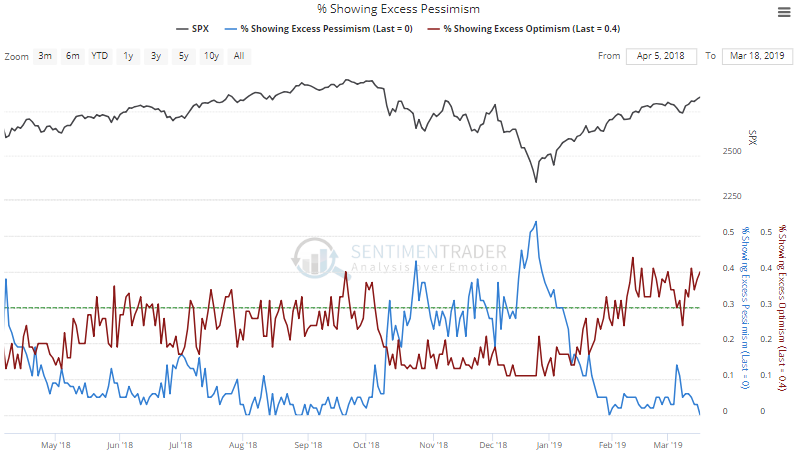
On Monday, none of our core indicators were showing a pessimistic extreme, but at least 40% of them were showing an optimistic one.

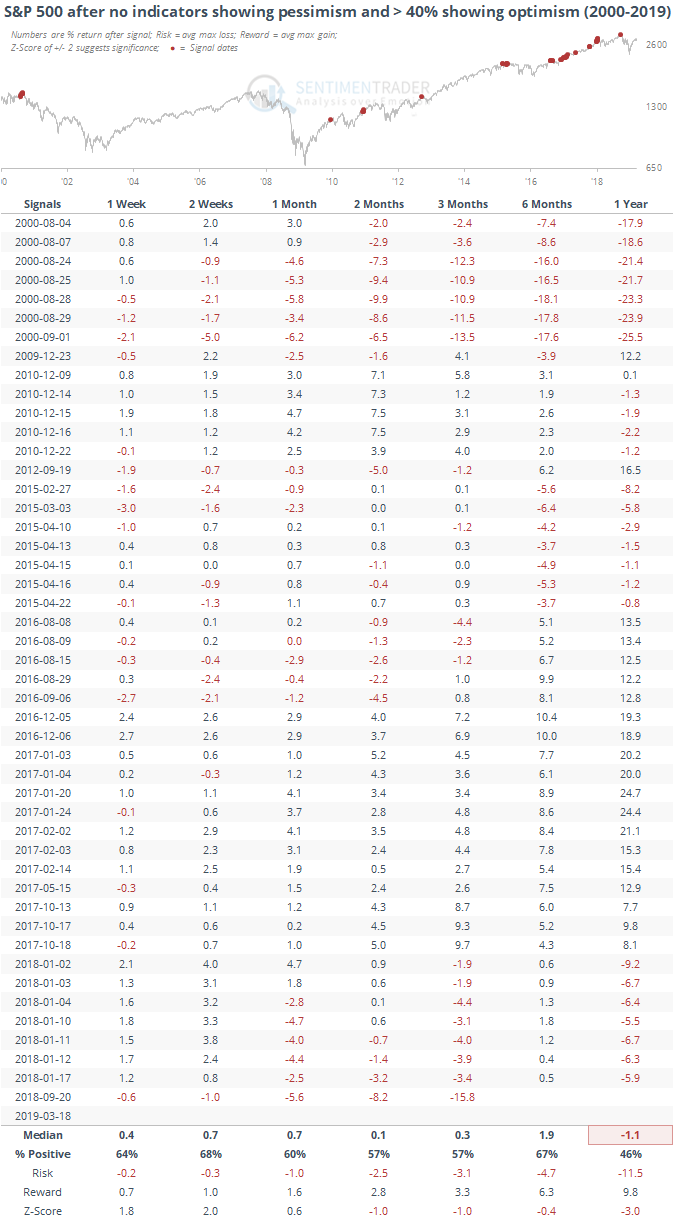
Going back to 1999, there have been 48 other days that showed this kind of condition. Future returns were "meh."

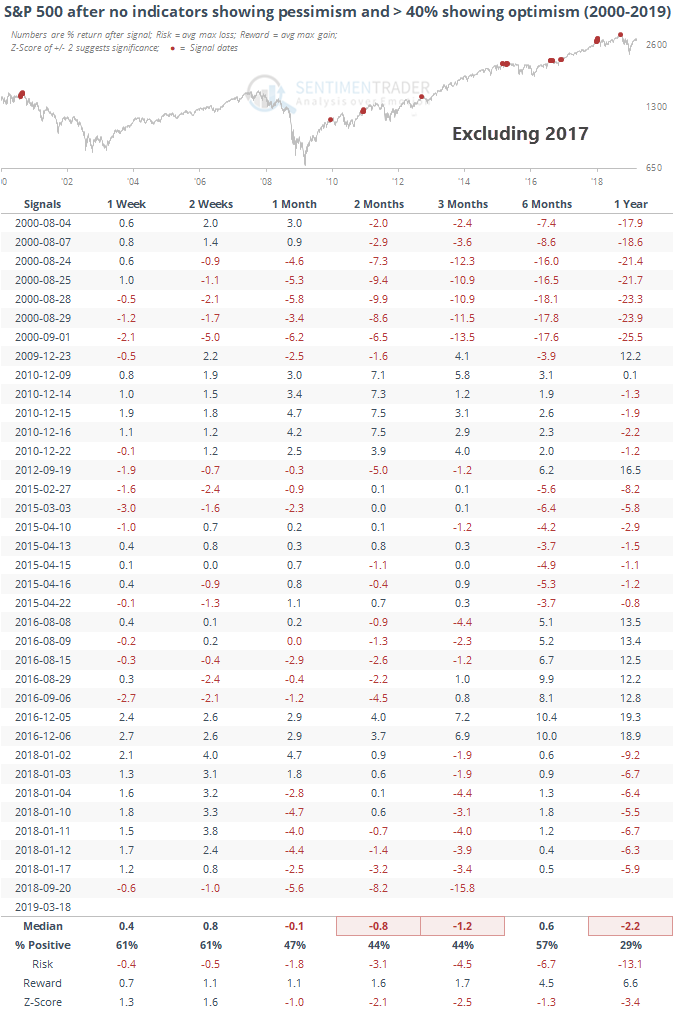
A lot of the positive medium-term returns were due to a single year, 2017. The extraordinary market that year just rolled right over everything. If we exclude that single year, then the returns turn considerably worse, with a particularly bad risk/reward ratio.


No Love For Japan

ETF traders have been pulling out of the EWJ fund for the past month. The fund has suffered an average outflow of nearly $75 million per day for the past month, ranking among the most severe and sustained outflows in its history.

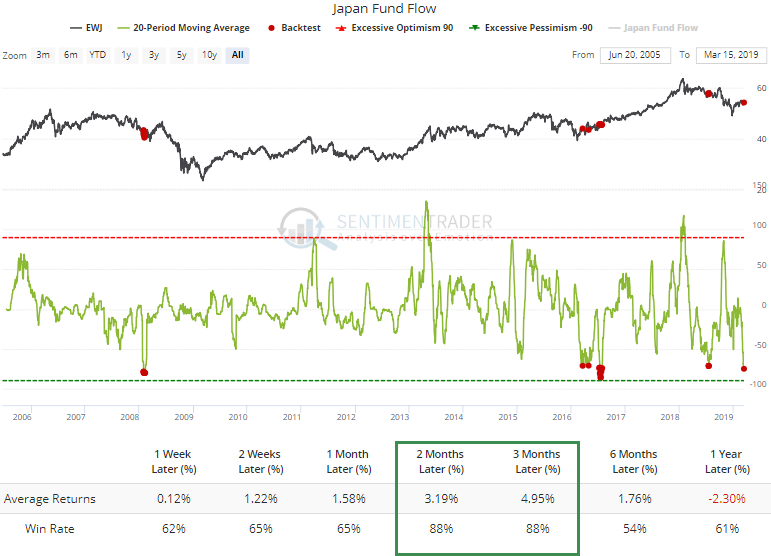
There has been a decent contrarian nature to these flows, with decent 2-3 month returns for EWJ after traders flee the fund like this.

Waxing Brazilian

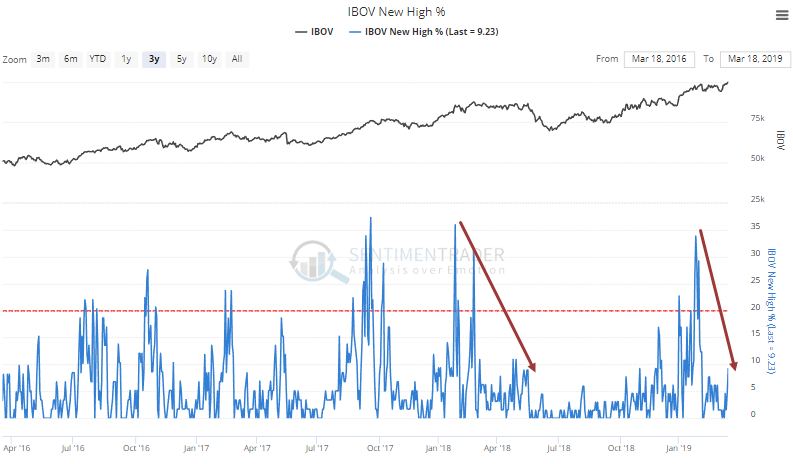
The Ibovespa Index of Brazilian stocks has been one of the most solid performers among international indexes and it continues to chug ahead, setting another new high on Monday. There are some cracks under the surface, though.

Breadth divergences are iffy things, so this isn't a major issue, but we are seeing a lack of thrust during this latest move. Fewer than 10% of stocks have hit a 52-week high, well below prior peaks. This is similar to the spring of 2018.

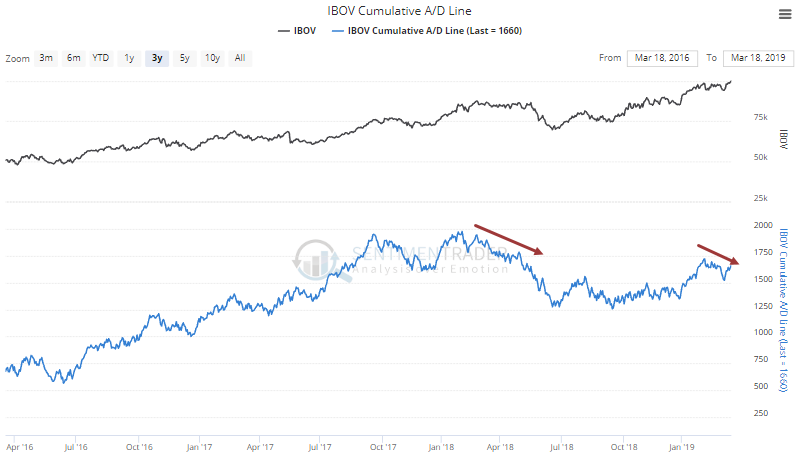
Same with the Cumulative Advance/Decline Line, which isn't making new highs along with the index.

Long-term breadth momentum is weak and has been declining for most of this latest move.

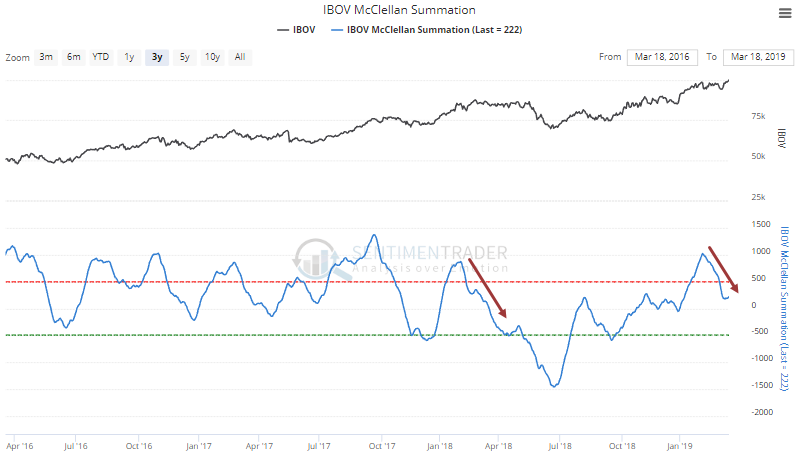
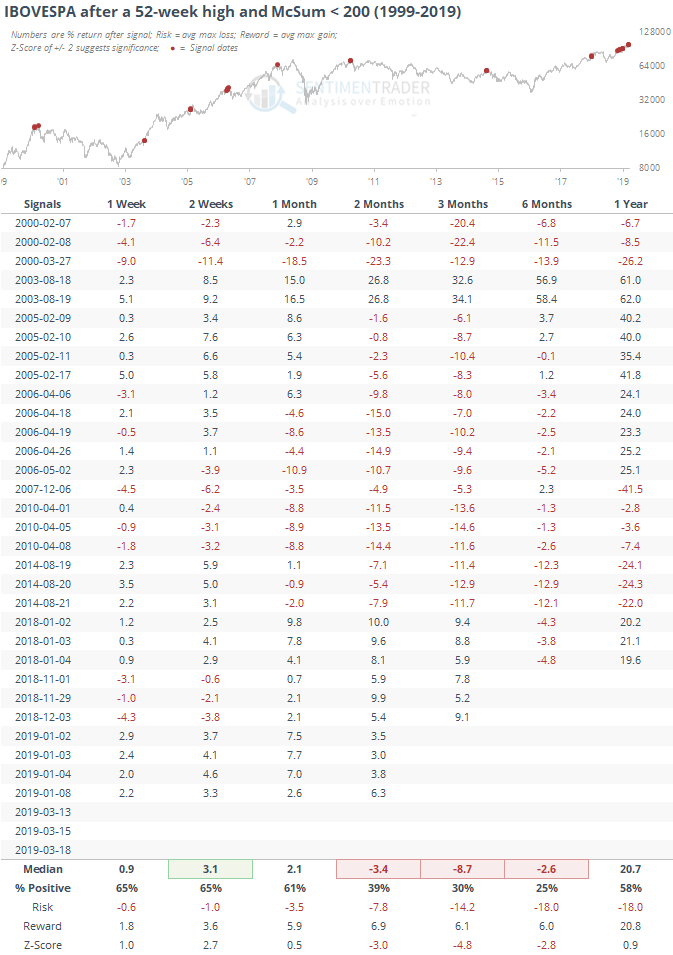
When the Ibovespa has made a new high and its McClellan Summation Index has been below 200, future returns were spotty at best.

Double Crossed

The Dow is set to enjoy a "golden cross" today with its 50-day average crossing back above its 200-day average. This usually catches the interest of retail-focused financial media. It's mostly worthless, at least when occurring for the first time in 2-4 months.

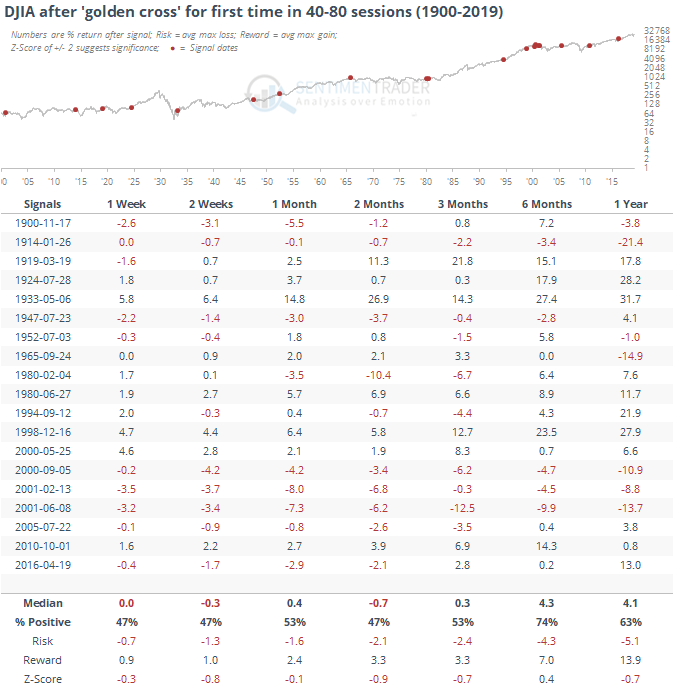
Out of the 19 signals, 12 of them saw a negative return at some point over the next 1-12 weeks.

Sorry, you don't have access to this report

Upgrade your subscription plan to get access
Go to Dasboard
DATA &
TECHnologies
IndicatorEdge
‍
BackTestEdge
‍
Other Tools
‍
DataEdge API
RESEARCH
reports
Research Solution
‍
Reports Library
‍
actionable
Strategies
Trading Strategies
‍
Smart Stock Scanner
‍
FREE
RESOUrCES
Simple Backtest
Calculator
Simple Seasonality
Calculator
The Kelly Criterion
Calculator
Sentiment Geo Map
‍
Public Research Reports
‍
Free Webinar
COMPANY
‍
About
‍
Meet our Team
‍
In the News
‍
Testimonials
‍
Client Success Stories
Pricing
Bundle pricing
‍
Announcements
‍
FAQ
© 2024 Sundial Capital Research Inc. All rights reserved.
Setsail Marketing
TermsPrivacyAffiliate Program
Risk Disclosure: Futures and forex trading contains substantial risk and is not for every investor. An investor could potentially lose all or more than the initial investment. Risk capital is money that can be lost without jeopardizing ones’ financial security or life style. Only risk capital should be used for trading and only those with sufficient risk capital should consider trading. Past performance is not necessarily indicative of future results.

Hypothetical Performance Disclosure: Hypothetical performance results have many inherent limitations, some of which are described below. No representation is being made that any account will or is likely to achieve profits or losses similar to those shown; in fact, there are frequently sharp differences between hypothetical performance results and the actual results subsequently achieved by any particular trading program. One of the limitations of hypothetical performance results is that they are generally prepared with the benefit of hindsight. In addition, hypothetical trading does not involve financial risk, and no hypothetical trading record can completely account for the impact of financial risk of actual trading. for example, the ability to withstand losses or to adhere to a particular trading program in spite of trading losses are material points which can also adversely affect actual trading results. There are numerous other factors related to the markets in general or to the implementation of any specific trading program which cannot be fully accounted for in the preparation of hypothetical performance results and all which can adversely affect trading results.

Testimonial Disclosure: Testimonials appearing on this website may not be representative of other clients or customers and is not a guarantee of future performance or success.