Tuesday Midday Color - More Gaps, Breadth (Down) Thrusts, Overseas Drops

Here's what's piquing my interest so far today. It's not midday, but I prefer to get these out early if there are large gaps.
Relief
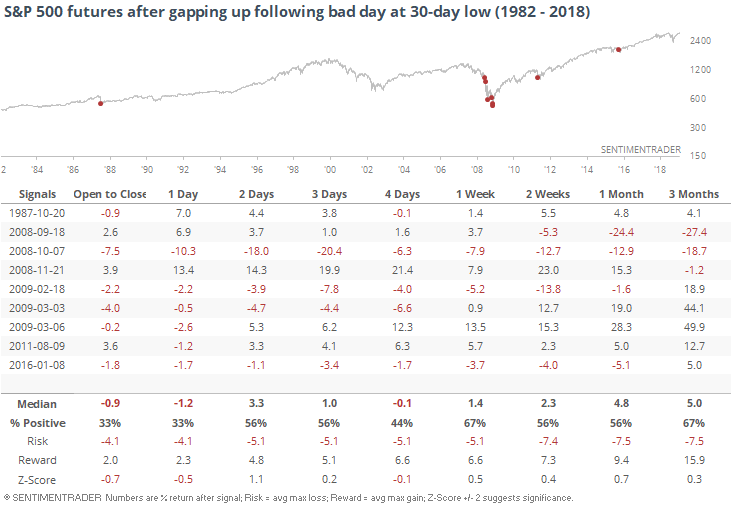
Stocks are on track to rebound strongly following Monday's bad loss. The futures are looking to gap up at least 0.5%, following a day when they gapped down more than 1.75%, lost at least another 0.5% during the day, and close at a 30-day low.
This kind of knee-jerk pre-market rebound has happened 10 other times.
Gaps as large as Monday's are rare, so if we relax the parameters and look for a 1.25% negative gap or worse, we capture a few more precedents. Pretty weak tendency to hold the pre-market gains like we're seeing today (Tuesday).
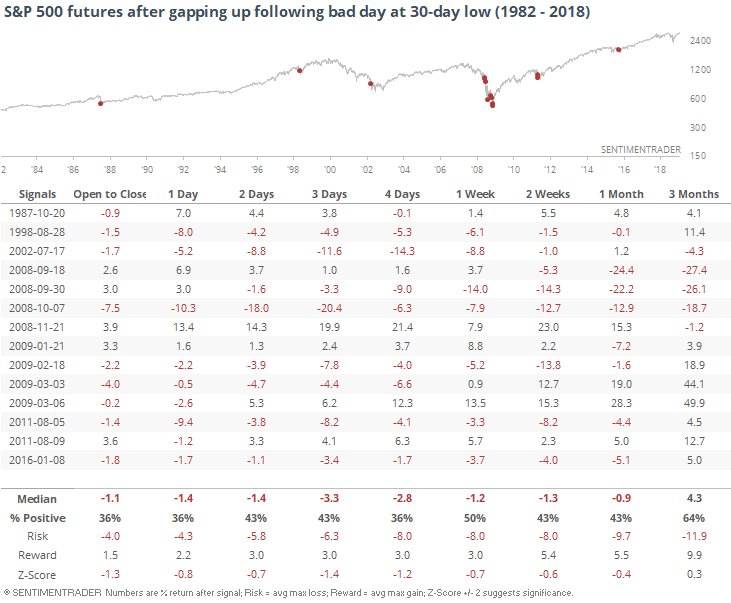
Who knows if this kind of behavioral pattern will continue, given the violent whipsaws we're seeing based off the latest trade dispute rumors.
Submerging Markets
ETF traders fled the most popular fund tracing emerging markets, EEM. The fund lost more than $1 billion on Monday, one of its largest outflows ever. Fund flows can be an iffy indicator, though, depending on the fund.
If we look for times when investors redeemed at least 3% of the shares outstanding after the fund had already declined at least 5% over the past two weeks, it's a similar story.
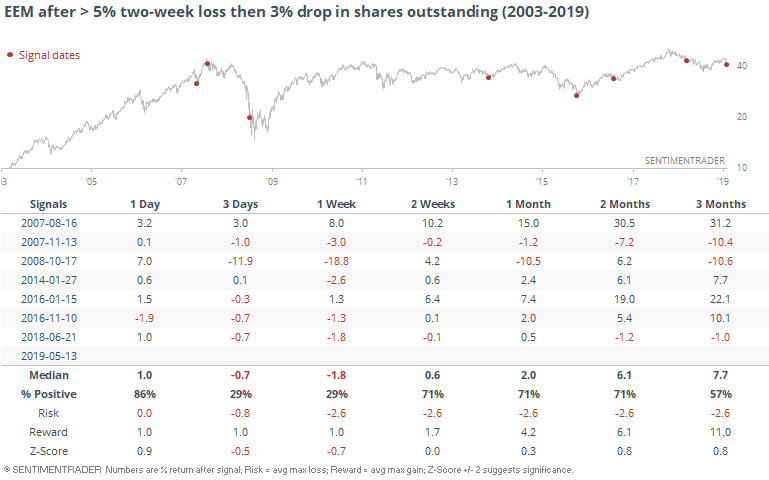
EEM tended to bounce back the next day, but that didn't usually hold over the ensuing sessions. The weeks ahead typically saw that rebound resume, though.
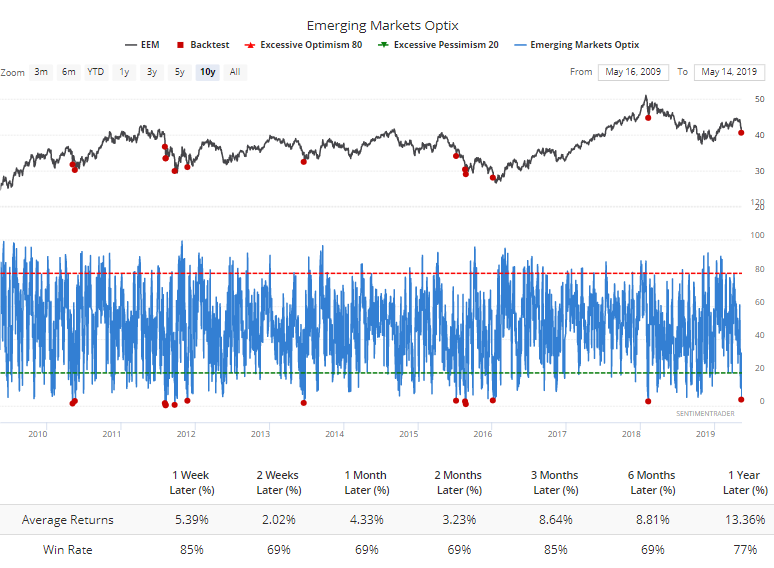
That fund flow helped push the Optimism Index for EEM below 4. That has only happened a handful of times since the financial crisis.
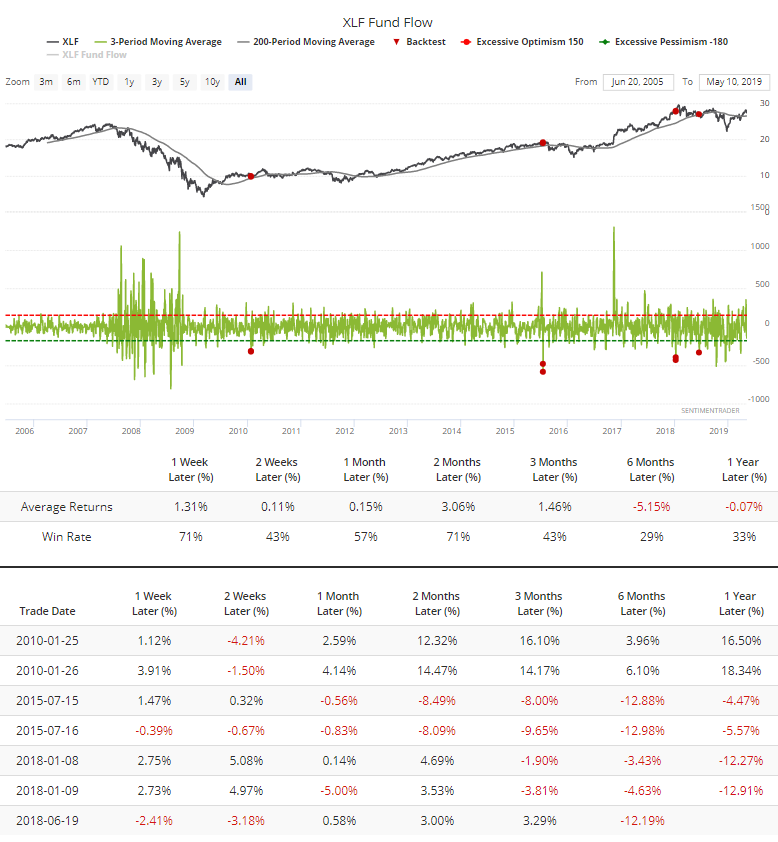
They've also been pulling out of financials. XLF has lost an average of more than $300 million in assets per day over the past three days, one of its largest outflows over a multi-day period. Since the financial crisis, that has been rare. It has also been rare to see in a generally uptrending market. Decent tendency for short-term rebounds, otherwise "meh."
Breadth Review
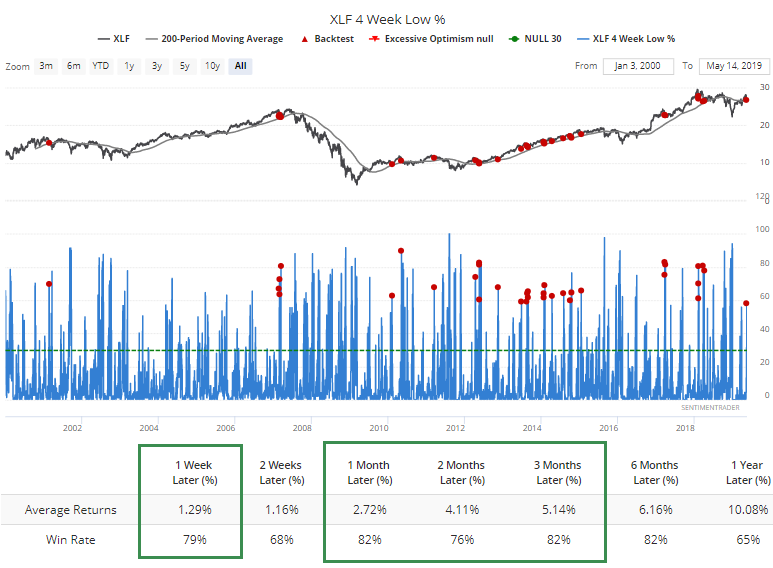
Sticking with financials, nearly 60% of them hit a one-month low during Monday's carnage. When we see this kind of a thrust during an uptrending market (above the 200-day average), in some markets and sectors, especially overseas ones, it tends to occur near major longer-term turning points from uptrend to downtrend.
That hasn't been the case with this sector.
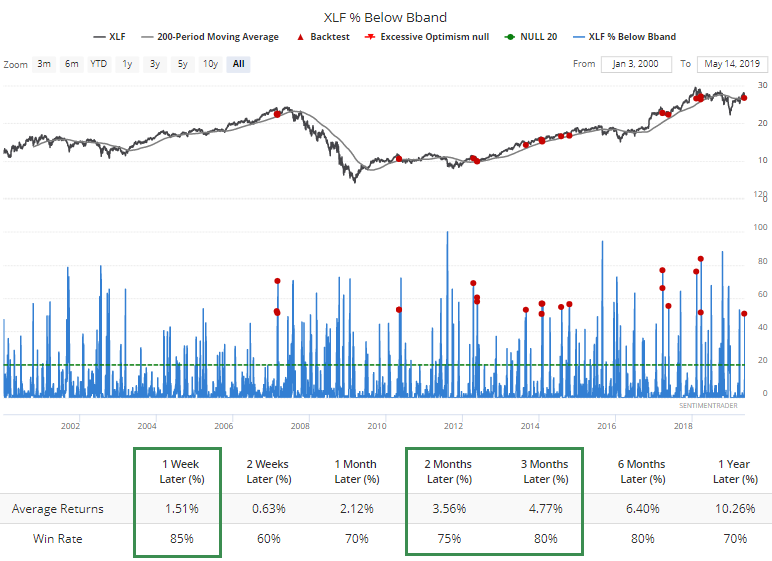
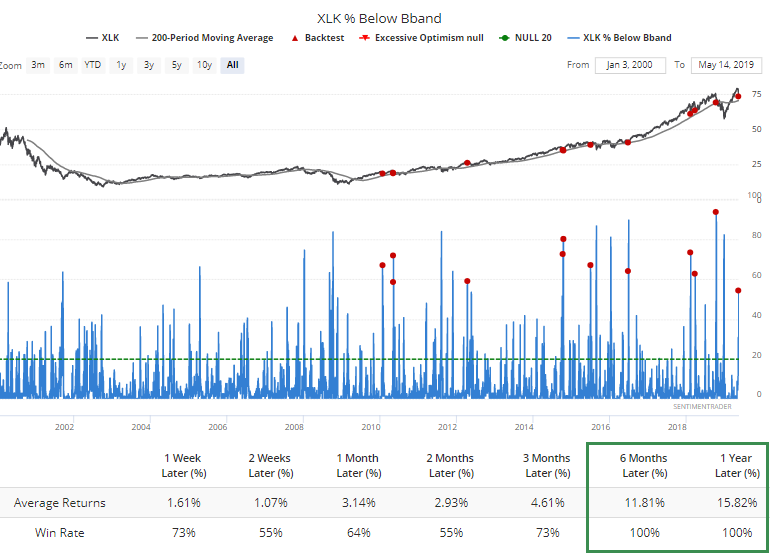
More than half of them also dropped below their lower volatility bands. Again, a strong tendency to snap back during an uptrend.
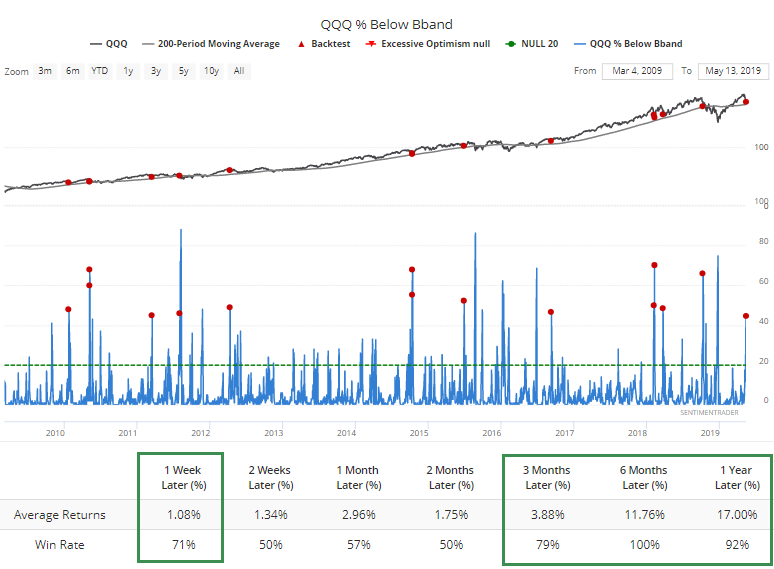
Almost 45% of the big tech stocks in the Nasdaq 100 also dropped below their lower bands, despite QQQ still holding above its 200-day average.
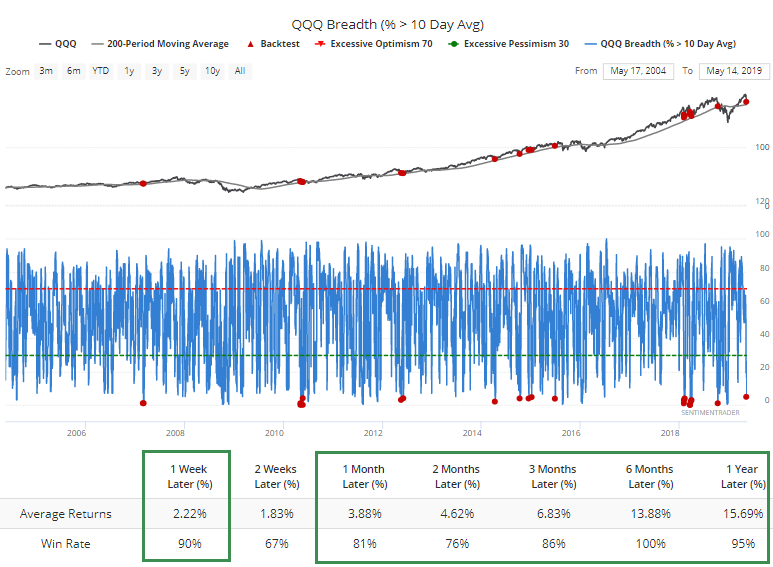
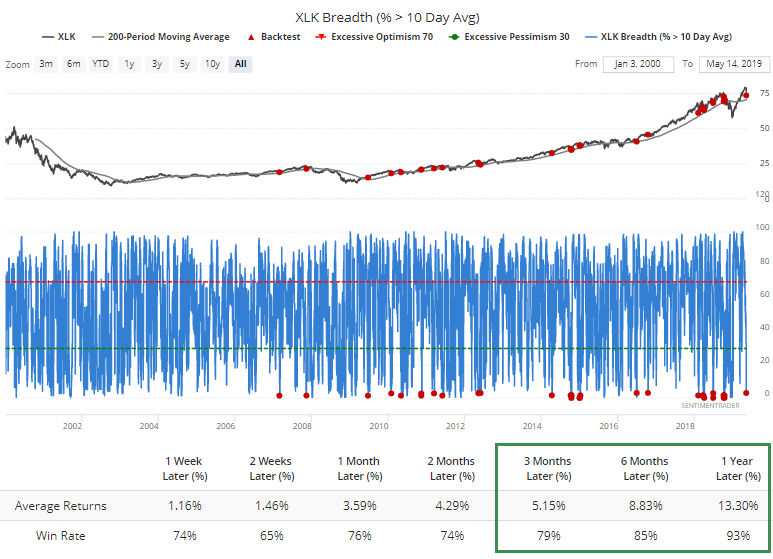
Even more compelling, fewer than 5% of them managed to hold above their short-term 10-day averages. This has consistently led to short-term (and longer-term) rallies.
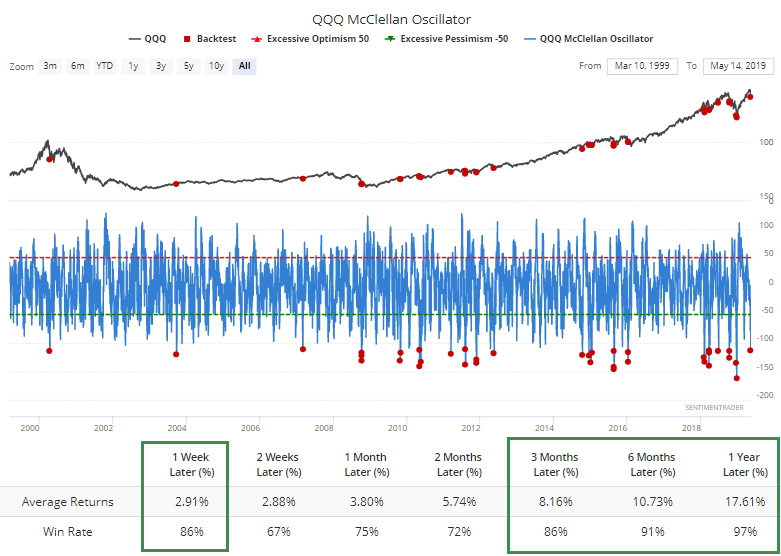
And the McClellan Oscillator dropped below -110.
In the much broader tech world, there was also a lot of damage, with more than 50% of the stocks falling below their lower volatility bands.
Fewer than 3% of the stocks held above their 10-day averages.
The Oscillator fell below -135.
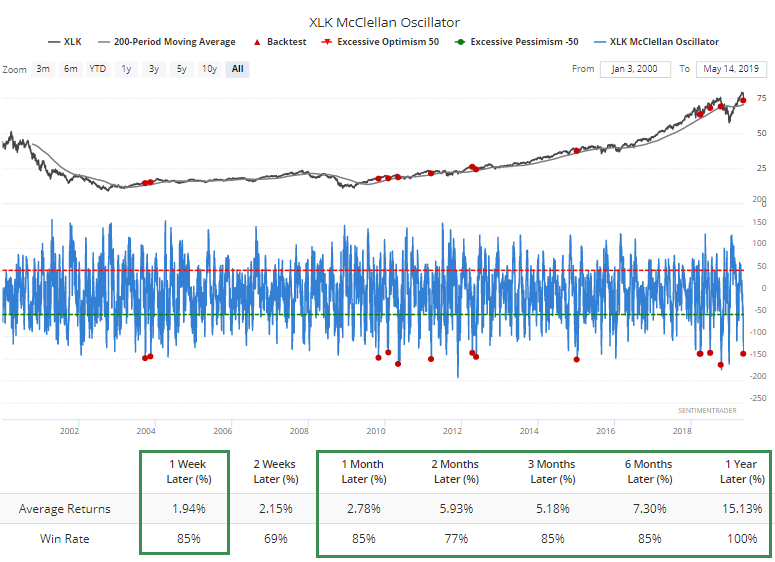
If we exclude the fact that XLK is in an uptrend and look at any time the Oscillator dropped to this low of a level, XLK still tended to rally.
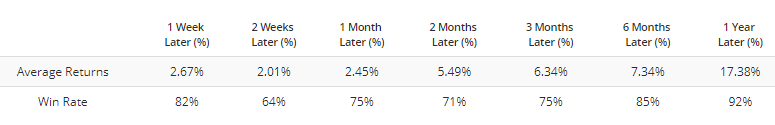
It wasn't just tech and financials that got hit, of course. Quite a few risk-on sectors were punished, including discretionary stocks, where 50% of them fell below their bands.
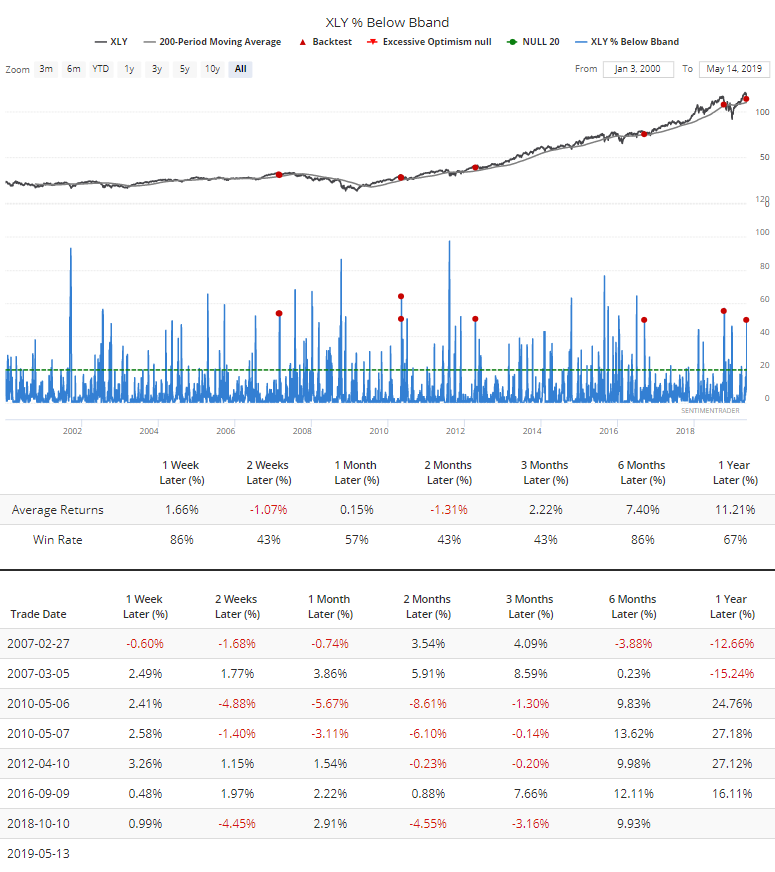
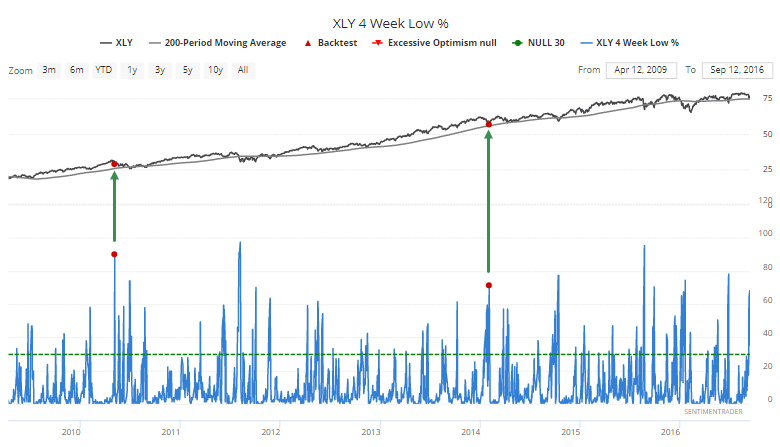
More than 70% of discretionary stocks fell to their lowest point in a month. While XLY held above its 200-day average, only two other dates in 20 years saw this many stocks hit short-term lows.
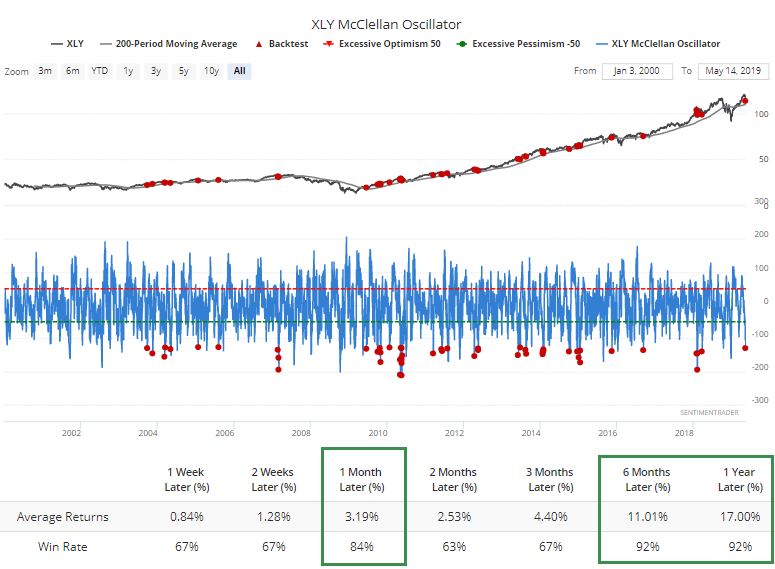
The Oscillator also fell to a very low level for an uptrending market.
Overseas Heat
The Heatmap shows a big cluster of funds with exceptionally low optimism on a daily time frame.
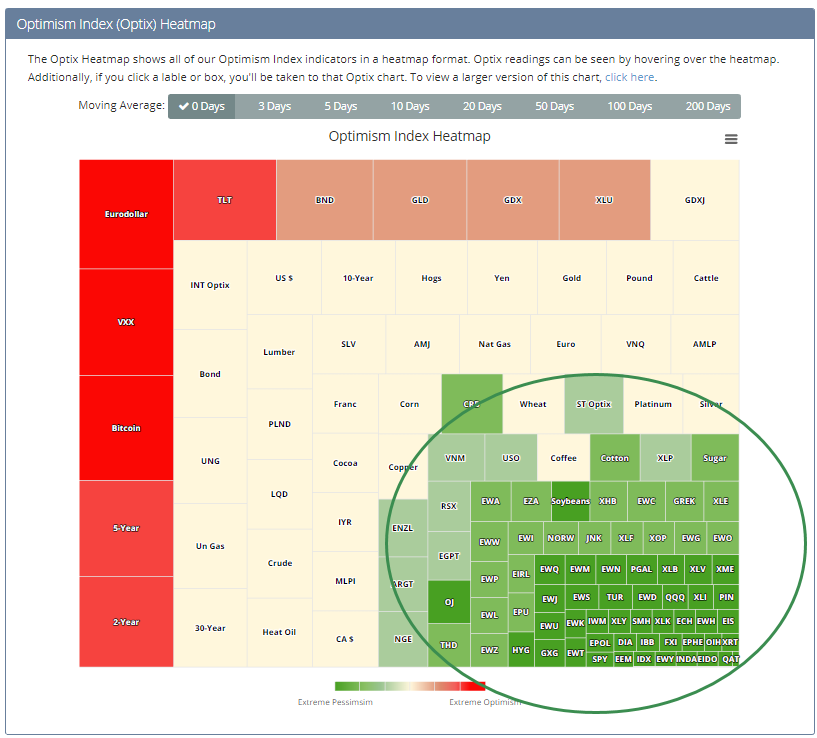
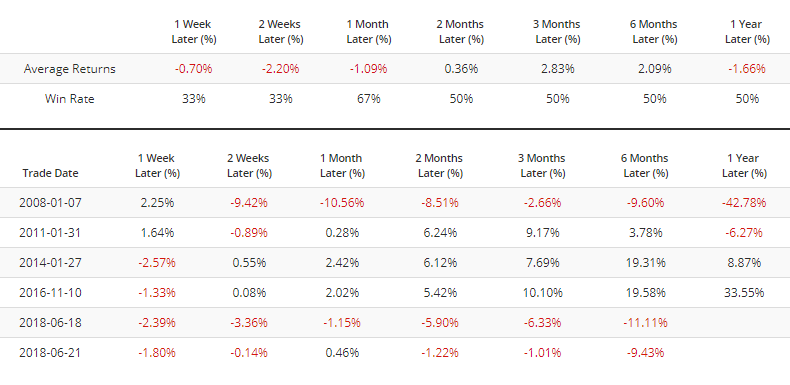
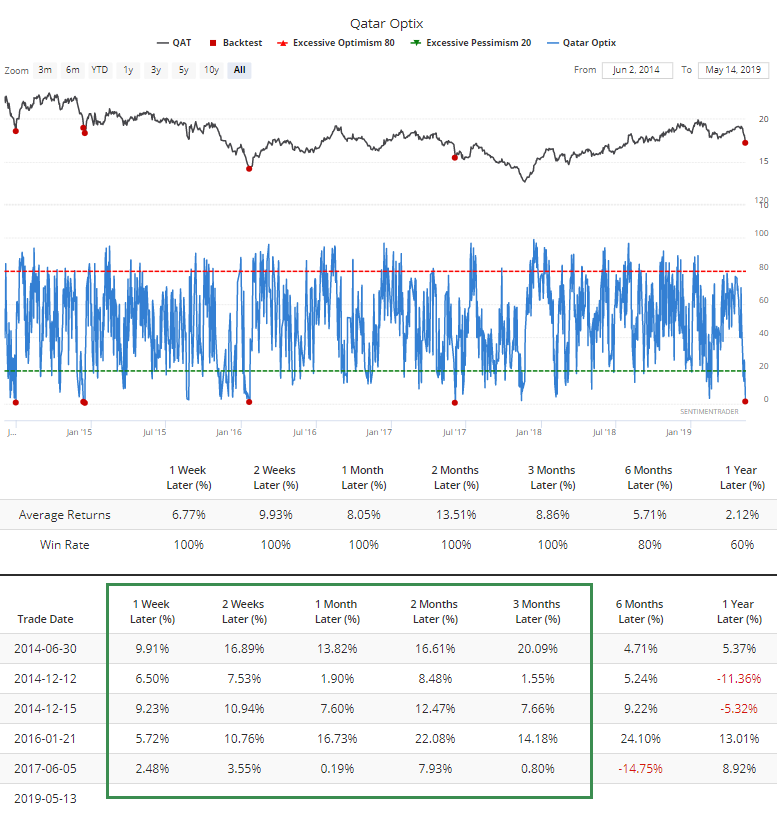
Chief among them is the Qatar fund, QAT. That's as low as it gets, with an Optimism Index of 1. We don't see that too often.
For that fund, it has triggered 5 other times, and its forward returns were...interesting. Nothing is ever 100% in markets, so hopefully it's obvious that a rebound is not guaranteed. Looks compelling, though.
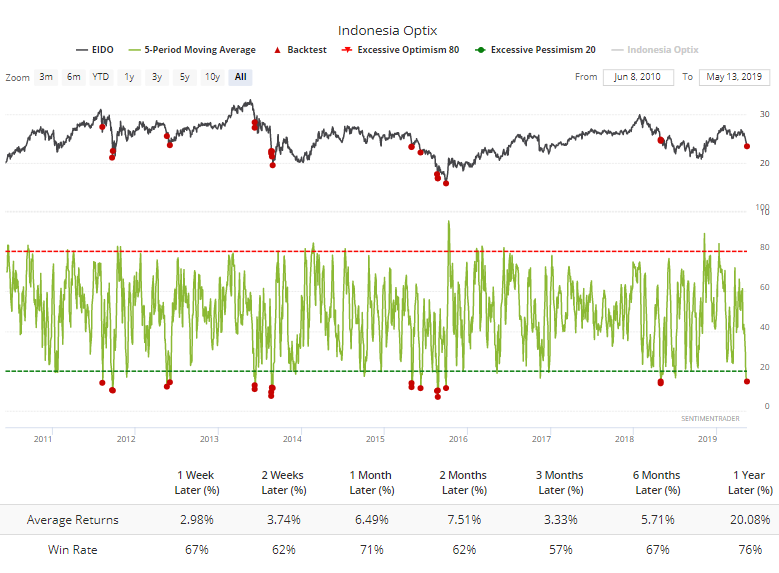
The Indonesia fund, EIDO, has a 5-day average Optimism Index below 15. Decent record at rebounding for a fund that has had trouble holding any upside momentum.
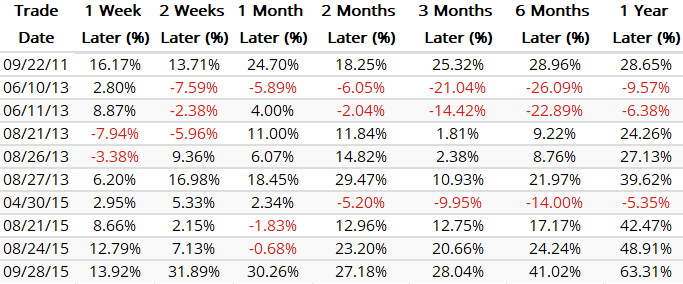
Same when it had single-day readings below 4, like it did on Monday.
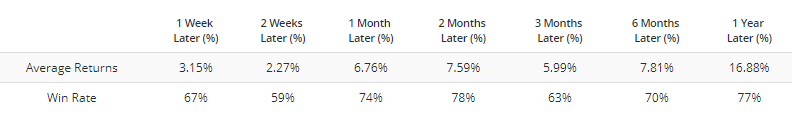
There were a handful of dates that both studies coincided. Again, decent record at preceding rebounds.
Other Screens
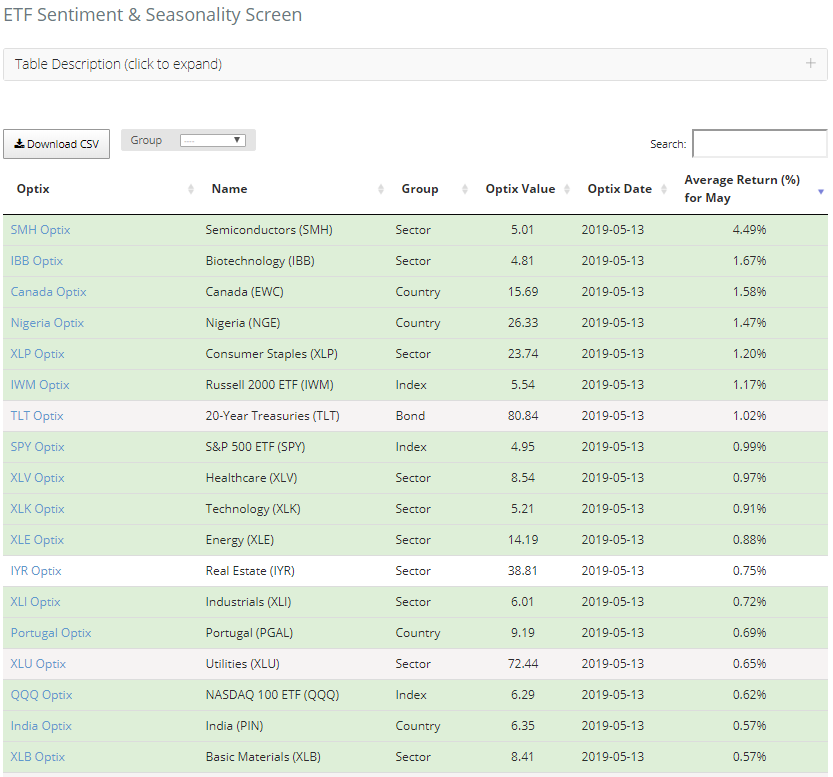
The ETF Sentiment & Seasonality Screen is showing a lot of green. These highlight funds with the most positive average returns in May that also currently have an Optimism Index below 30.
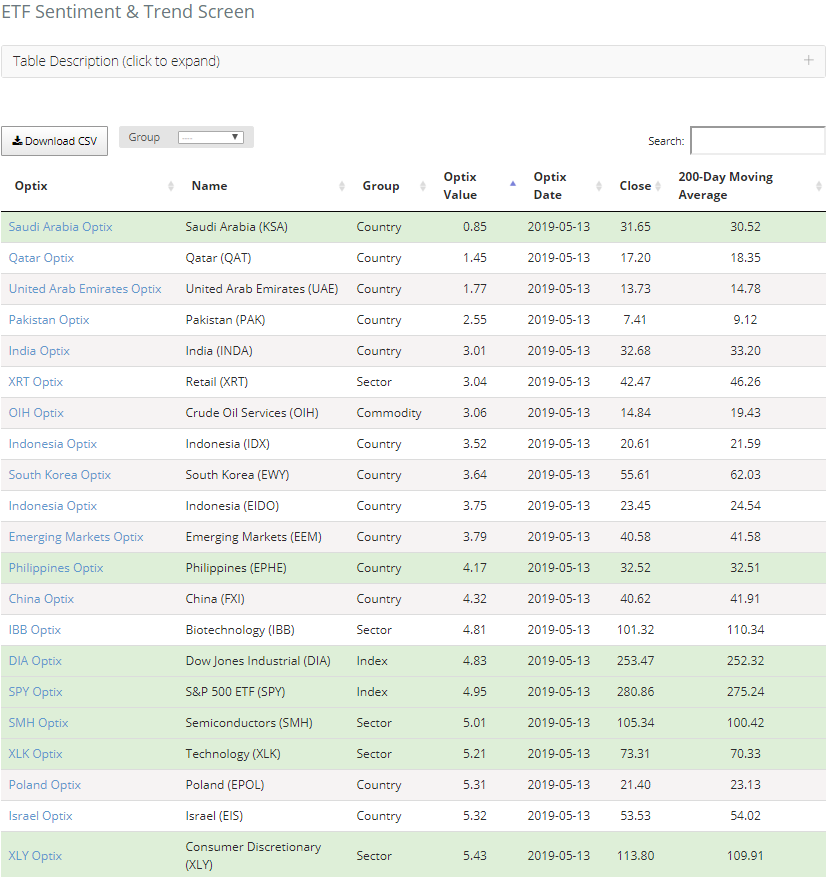
There are quite a few also holding above their 200-day averages on the Sentiment & Trend Screen.
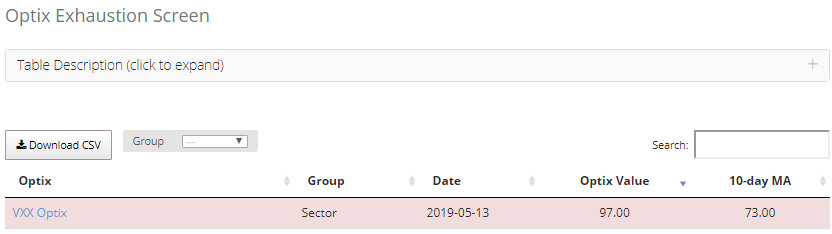
There are many also popping up on the Optix Exhaustion Screen. These show funds where optimism was already low, and then there was a *very* low reading. It suggests exhaustion.
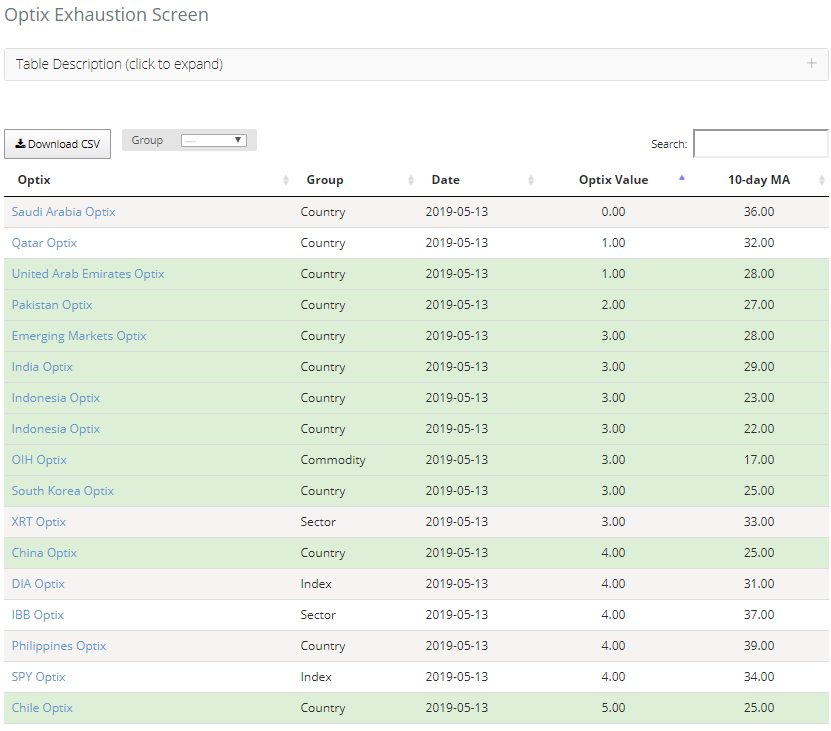
It's no surprise that the only fund with the opposite condition is VXX.