Tuesday Color - Post-Holiday Blah, September After Volatile August, Put Premiums And Climaxes, Mexico

Traders start to return from the summer with losses in stocks and scary headlines the world over. This kind of activity has preceded mixed outcomes, and that's becoming a them in the shorter-term, without a clear bias.
As Troy noted in an excellent recap over the weekend, the medium-term of several months continues to suggest a positive risk/reward ratio, but shorter-term (and longer-term) are looking mixed at best.
Post-Holiday Gaps
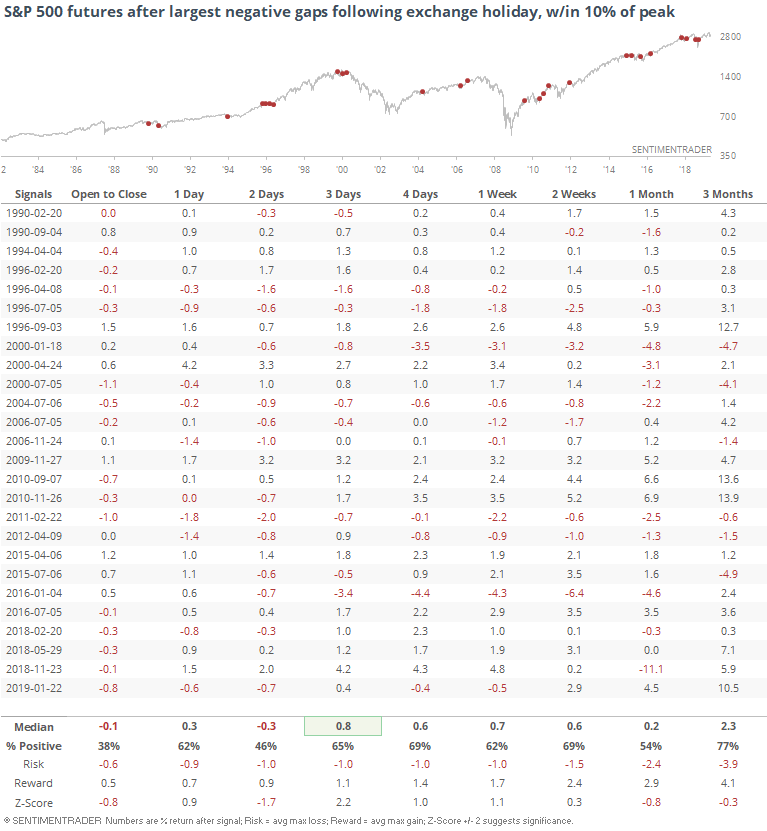
If we look at times when the typical post-holiday weakness took the form of at least a 0.5% opening gap down in the S&P 500 futures while the S&P was still relatively healthy, the opening weakness tended to continue over the next couple of sessions.
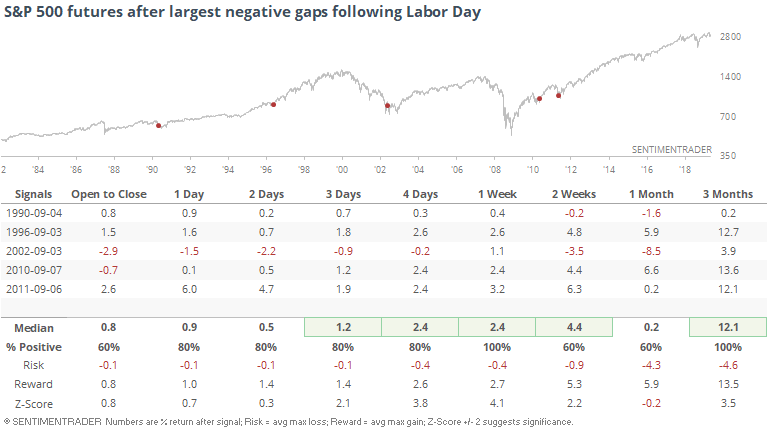
If we only look at big negative reactions following Labor Day, any distance from a peak, then that weakness wasn't as prevalent and in fact the futures rallied every time during the next week. The sample size is awfully small, though, since the futures have rarely gapped down this much after this holiday.
Post-August Volatility
Last week, we saw that when stocks start to gyrate wildly soon after being at a peak, it usually has not led to consistent losses. Someone pointed out that only a few of them were in August, and those returns were pretty weak over the next month.
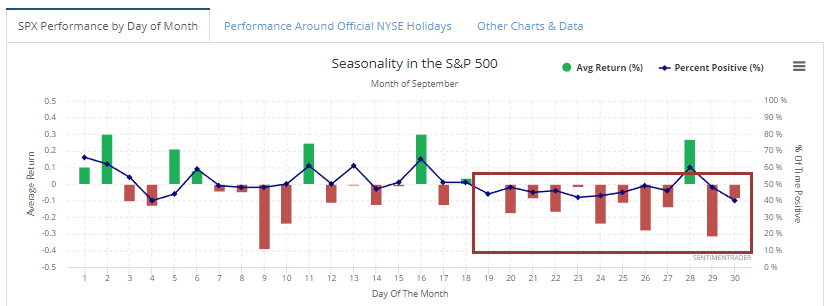
Generally, September has been blah for SPY.
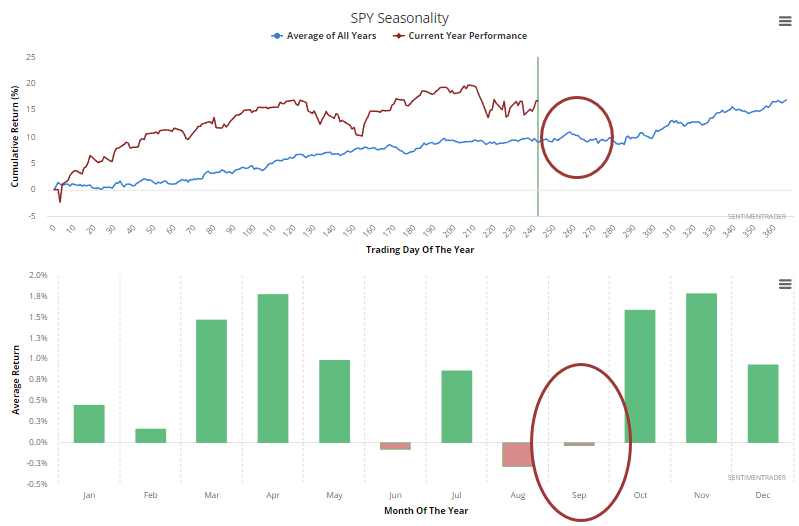
Longer-term, the S&P's returns during the month have been dragged down most consistently by the last half of the month.
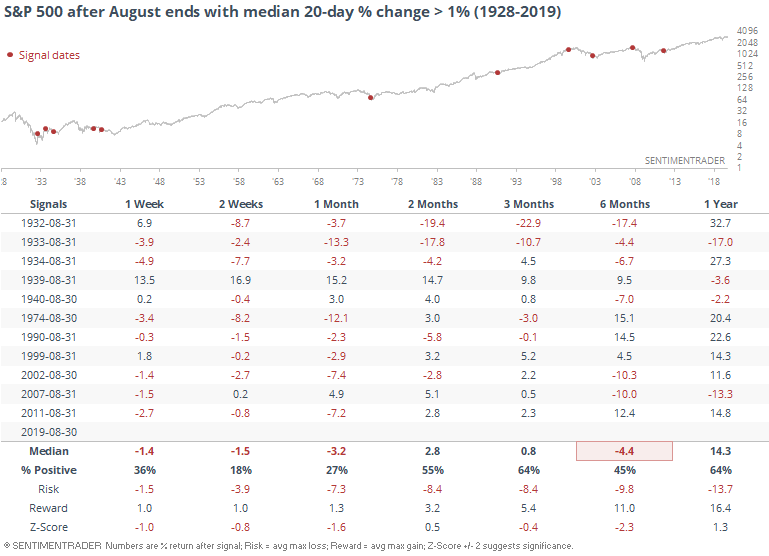
But, is September an even more troubling month when August is volatile?
Maybe so. Below, we can see returns following any August that had a 20-day median percentage change higher than 1%.
And here it is when August's 20-day median daily change was the highest in at least 3 months.
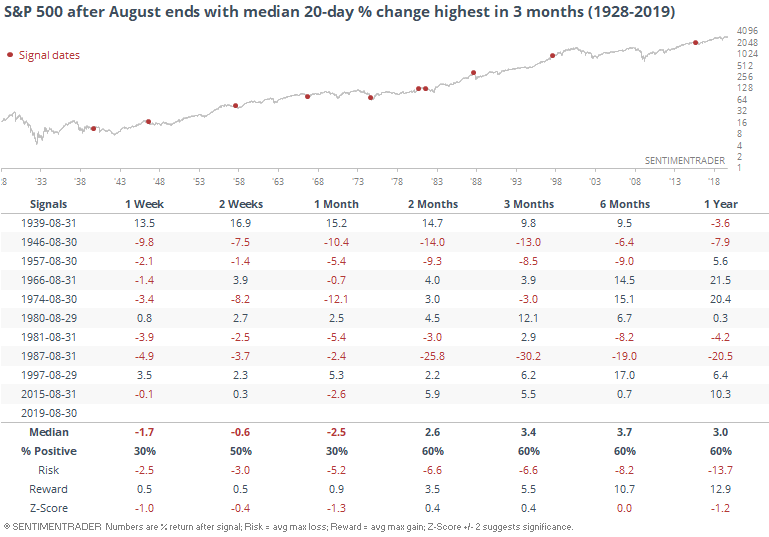
Both show weak returns in the shorter-term, with high risk.
Last Week's Selling
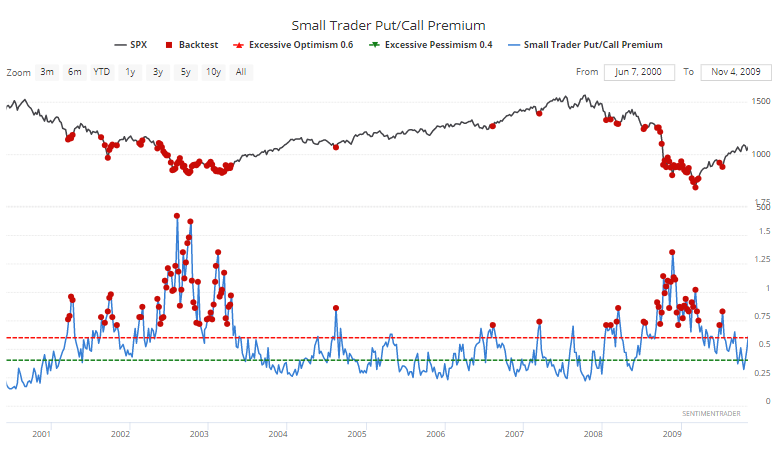
Traders seem to be betting on it. Premiums on puts paid by the smallest of options traders rose to 70% of call premiums, one of the highest levels since the financial crisis.
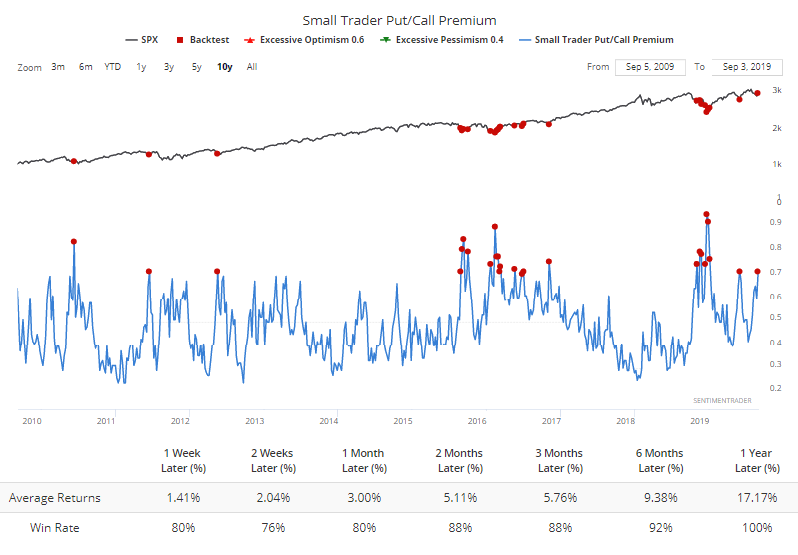
Only a few of those preceded any losses at all, though it did trigger several times last October-November before stocks ultimately bottomed in December, leading to some uncomfortable shorter-term losses.
Looking back at the last two protracted bear markets, the put premiums climbed much higher, so the bullish implications are heavily dependent on whether we're still in post-crisis mode, or midst-of-bear-market mode. The odds seem to favor the former.
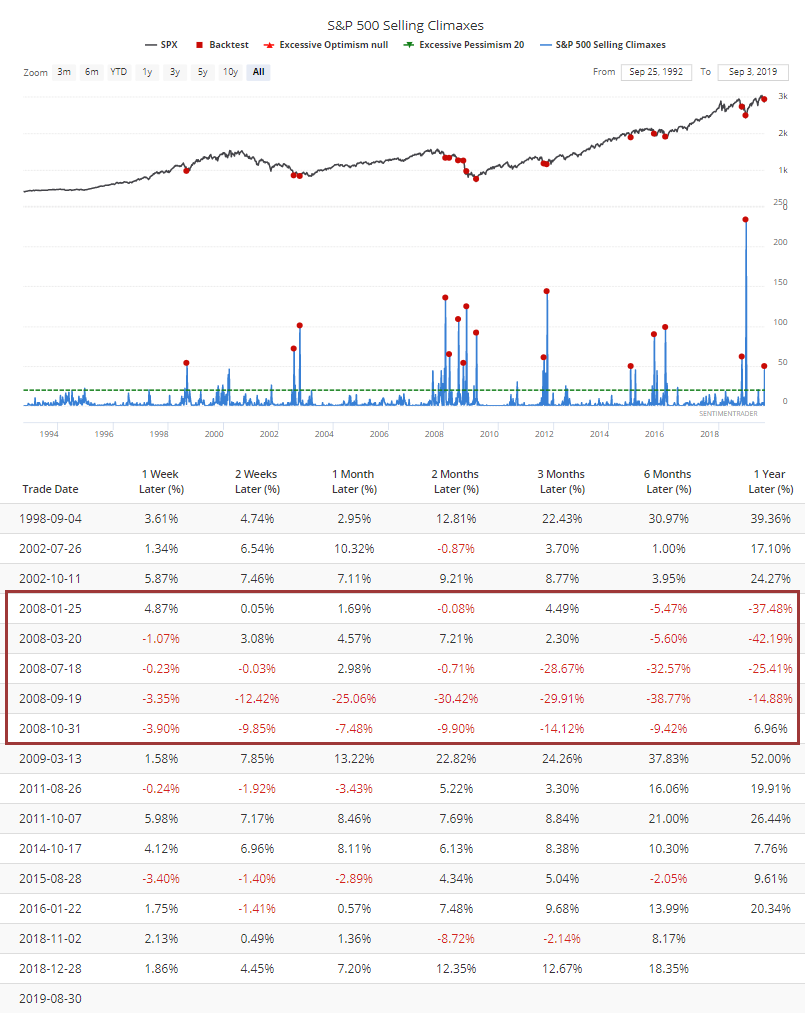
There were also a lot of selling climaxes last week. This is when a stock drops to a 52-week low then reverses to close higher than its close the prior week. Within the S&P 500, more than 50 stocks enjoyed such a reversal, one of the highest in 25 years. Almost all of the negative returns after so many internal reversals occurred in 2008. Outside of that year, it was a good sign of exhausted selling pressure.
Overall, it's a muddy picture when looking at the short-term. There are some compelling signs of extremes, and a lot of things we've been looking at have skewed to the positive side in recent weeks. That's over more of a medium-term time horizon of several months, and not necessarily the shorter-term of several weeks. Looking at those September returns following big swings in August, that short-term is looking less compelling, but if there are more swings to come on the downside in the coming week(s), there have been a lot of reasons to expect it to be temporary.
Sectors
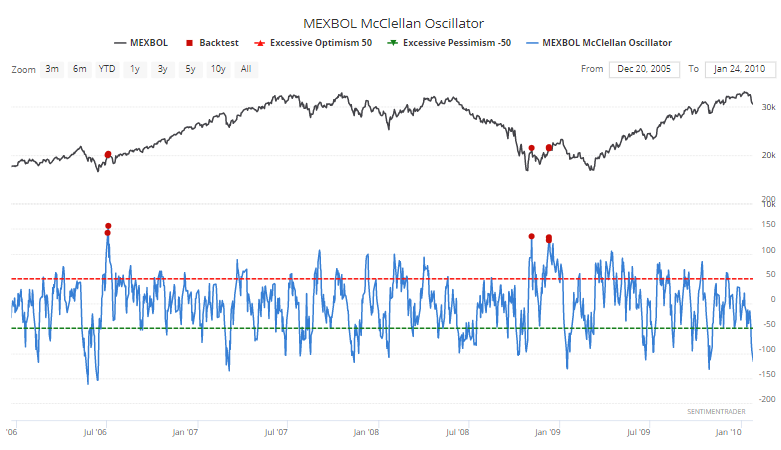
We spent quite a bit of time looking at the extreme pessimism and oversold conditions in the Mexican Mexbol index as those stocks suffered a near-historic level of selling pressure. The implications were that any further selling would likely be temporary and over the medium- to long-term, lead to positive returns.
Buyers have returned, and the index is started to show some extremes in the other direction - intense and widespread buying interest. As noted on Friday, this tends to lead to some very short-term digestion, but have mostly occurred at longer-term turning points.
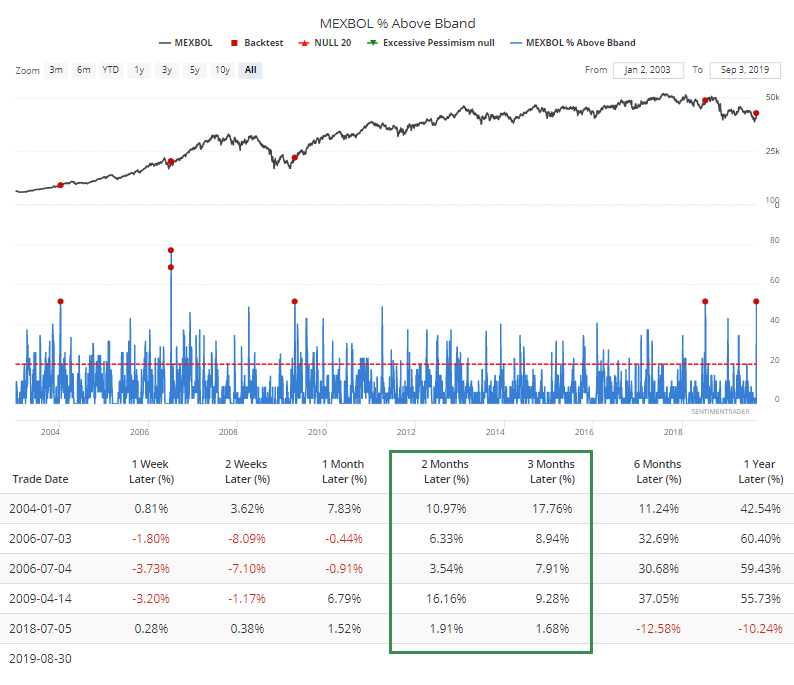
We see that as well with the huge spike in the percentage of stocks trading above their upper Bollinger Bands.
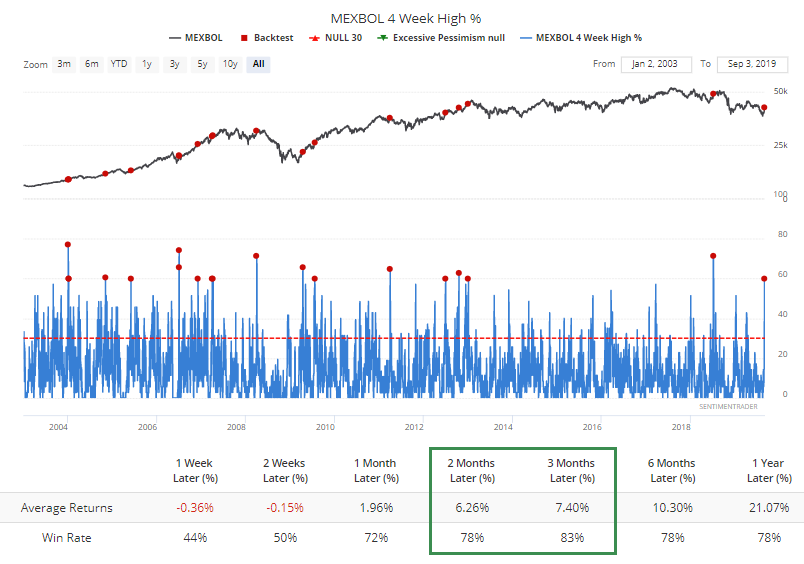
And 60% of the stocks have reversed enough of their losses to trade at one-month highs.
That has pushed the McClellan Oscillator to a near-record high.
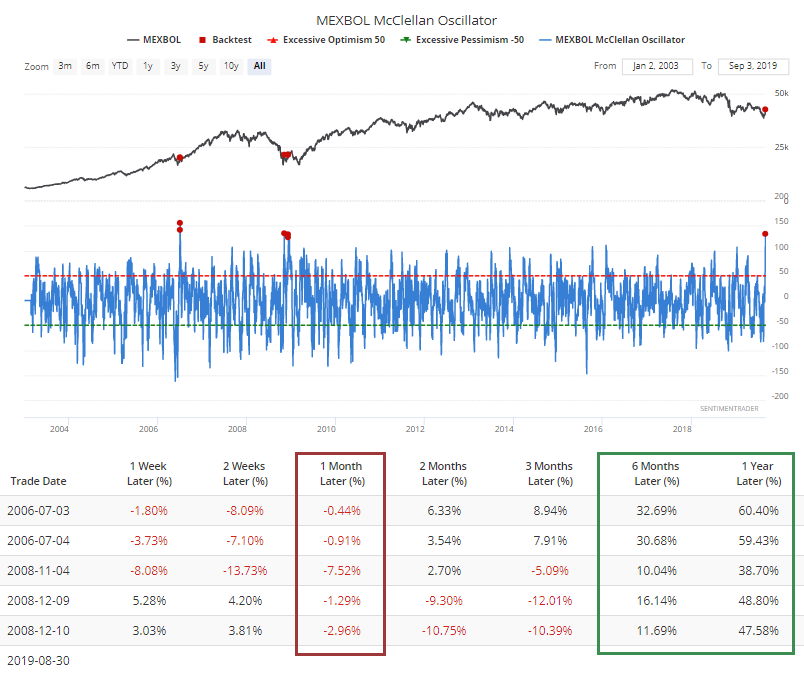
If we zoom in on the only two other times it got this high, we can see short-term volatility but long-term massive gains.