Tuesday Color - Opening Volatility, New Lows, Sector Extremes, Big Outflows

Here's what's piquing my interest as traders push the indexes into rebound mode.
Boing
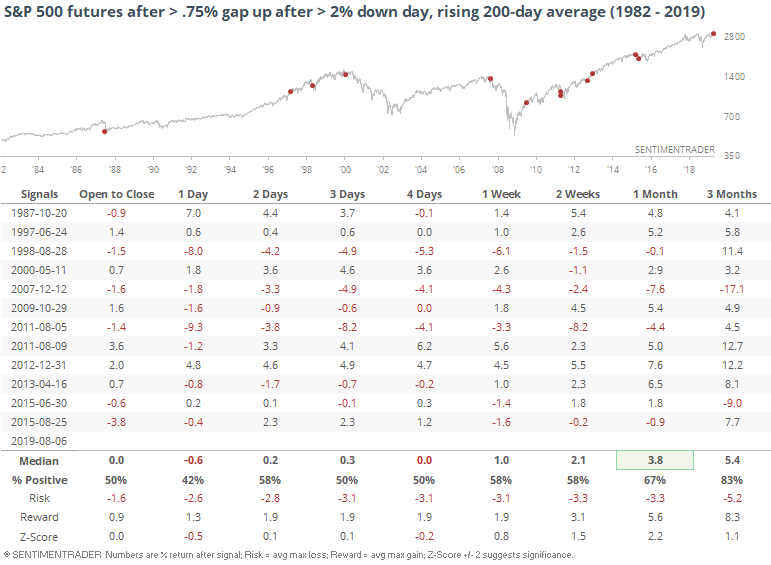
Futures are ramping higher this morning after an after-close plunge, triggering all kinds of overnight volatility. During a generally rising market, this would be the largest opening rebound after a big down day since August 2015.
Out of all the other precedents, only 1 managed to truly take off on uninterrupted upside following this kind of behavior, which was the last day of 2012. Seasonality likely helped play a part in that.
While a few of the others showed gains in the day(s) ahead, none really took off without looking back. V-shaped bottoms have become more common in recent years, but even so, it would be highly unusual to see a complete rebound from conditions like this. Who knows how it will turn out with geopolitical winds shifting in real-time via tweets, but that's the historical record.
Big Lows
The selling pressure on Monday was heavy enough to push more securities on the NYSE to 52-week lows than we saw in May. Accounting for more than 9% of issues on the exchange, it was one of the largest readings in 2 years, pretty unusual for a time when the S&P 500 was still holding above its 200-day average.
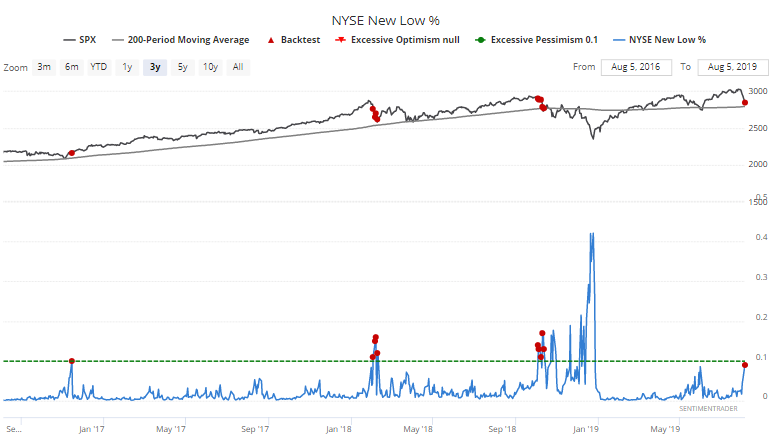
According to the Backtest Engine, this isn't necessarily a good thing. It shows a large number of failing stocks during a time when the major indexes are holding up, which should be a good sign, but more often is not, at least in the shorter-term.
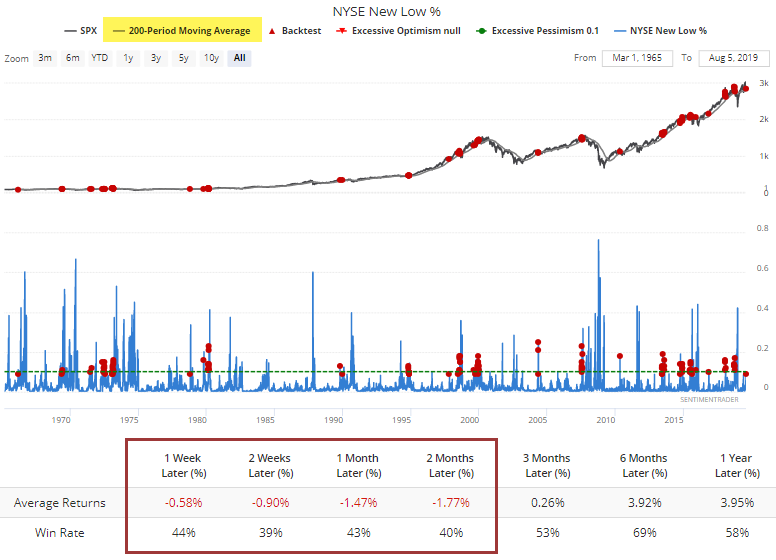
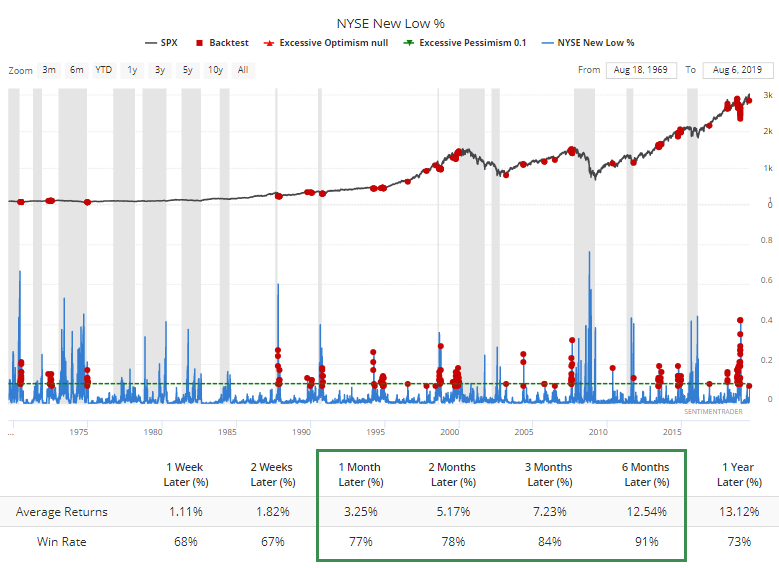
If we want to make some assumptions, it's perhaps not all bad. IF we assume that we're still in a bull market, and IF we assume that's going to continue in the months ahead, then this many 52-week lows has led to almost universally positive returns over the next 3-6 months.
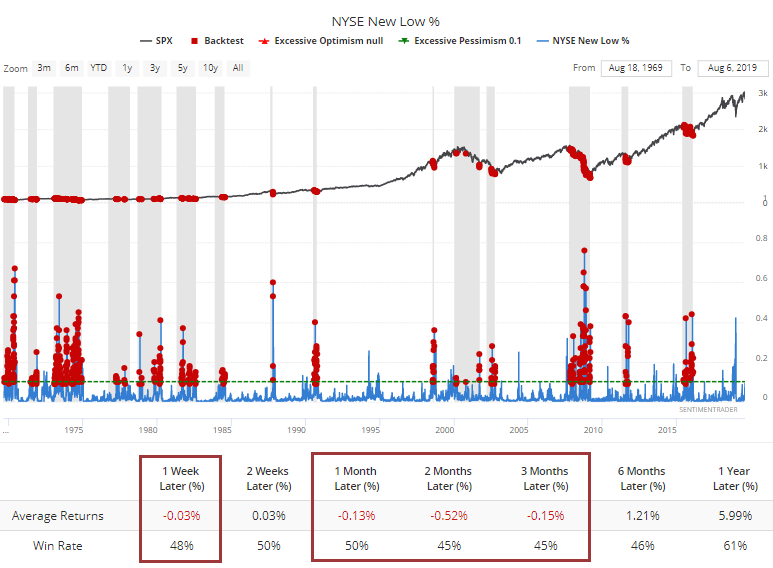
If we don't feel safe with that assumption, and it's possible that we're in a new bear market environment, then it takes a lot more new lows to trigger a contrary reaction.
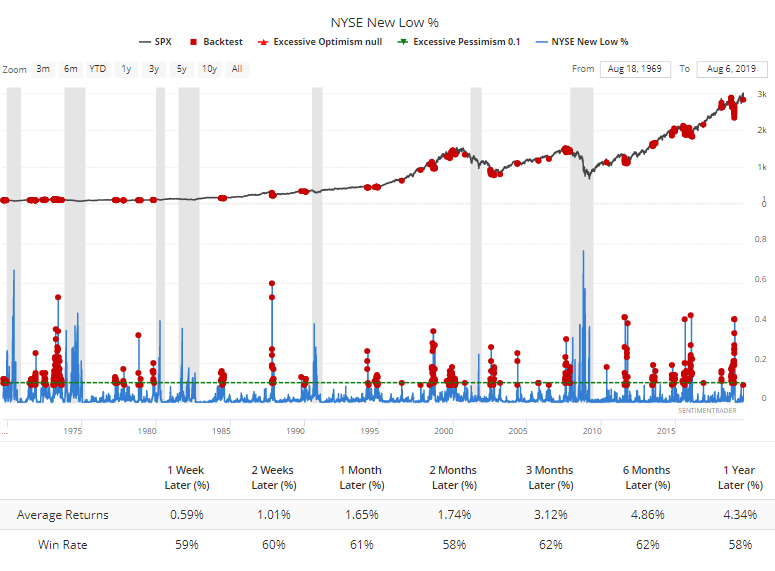
If we also assume that we're not in a recession, then this many lows has also generally led to good returns, but less than if we're specifically in a bull market.
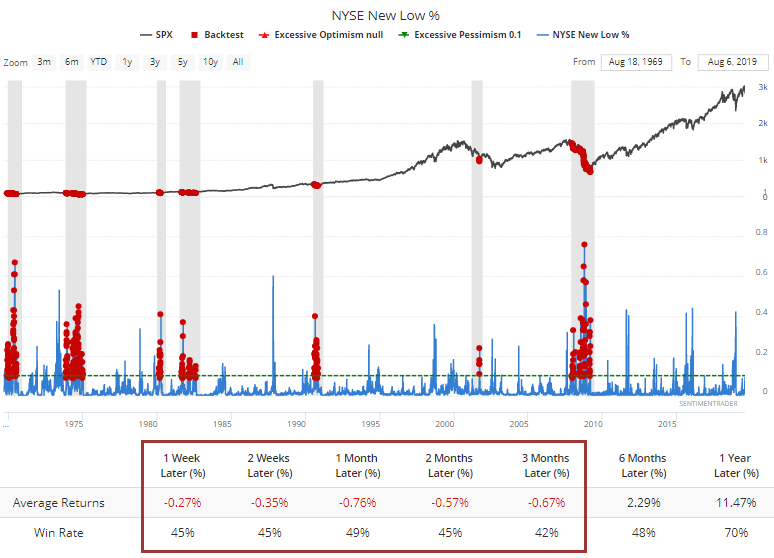
For the Negative Nellies who think we are in recession, then again, this is not enough 52-week lows to trigger a contrary signal.
Sector Breadth
The big drop on Monday triggered a large number of extremes among sectors and, especially, non-U.S. indexes.
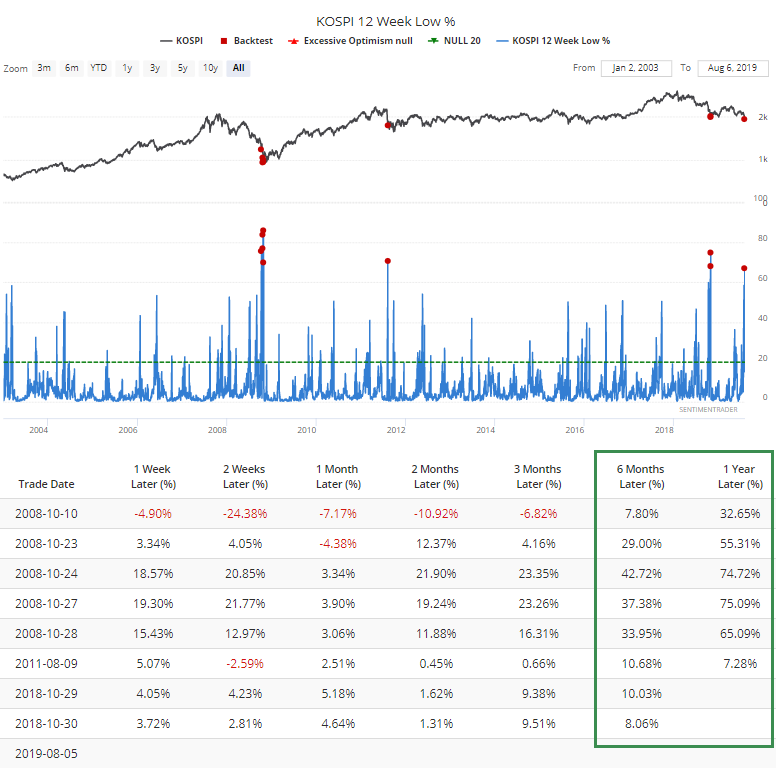
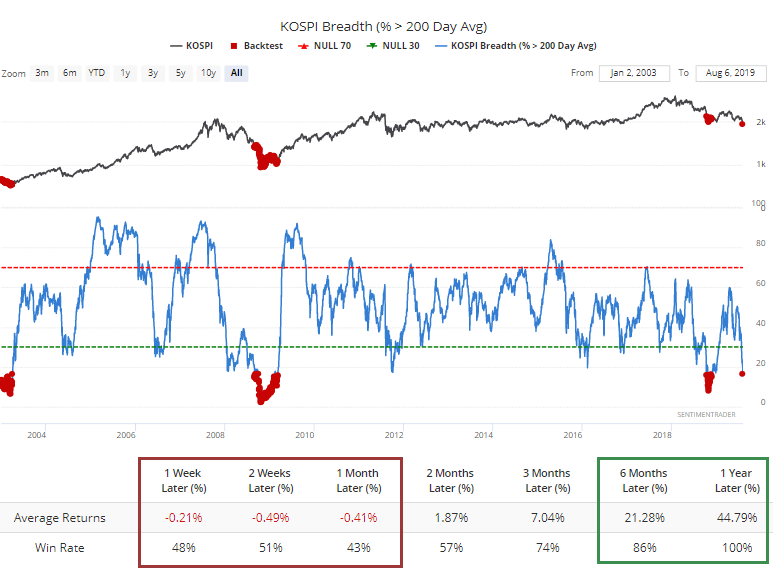
Chief among them were South Korea's Kospi index, where nearly 70% of stocks hit a multi-month low. Over the past 16 years, that has led to universally positive long-term returns.
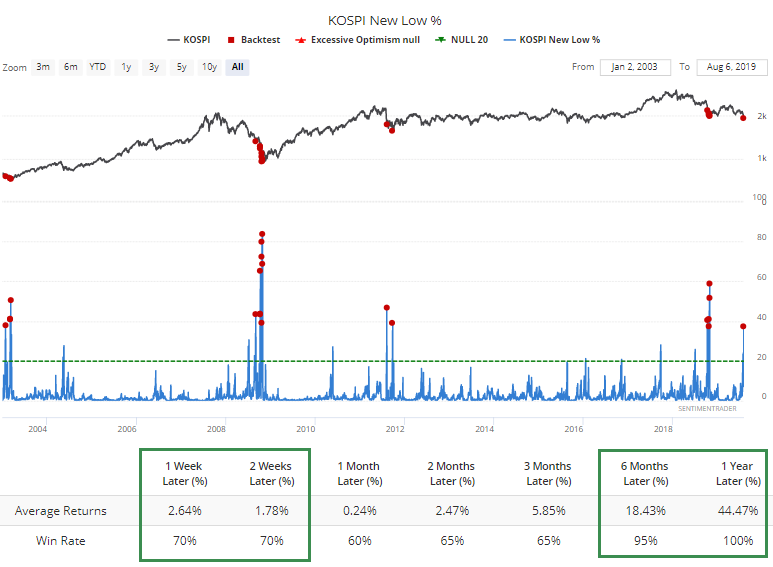
Nearly 40% of them not only fell to multi-month lows, but also 52-week lows. That matches some of the most extreme readings since 2003, with only the final plunge during the financial crisis heavily exceeding this reading.
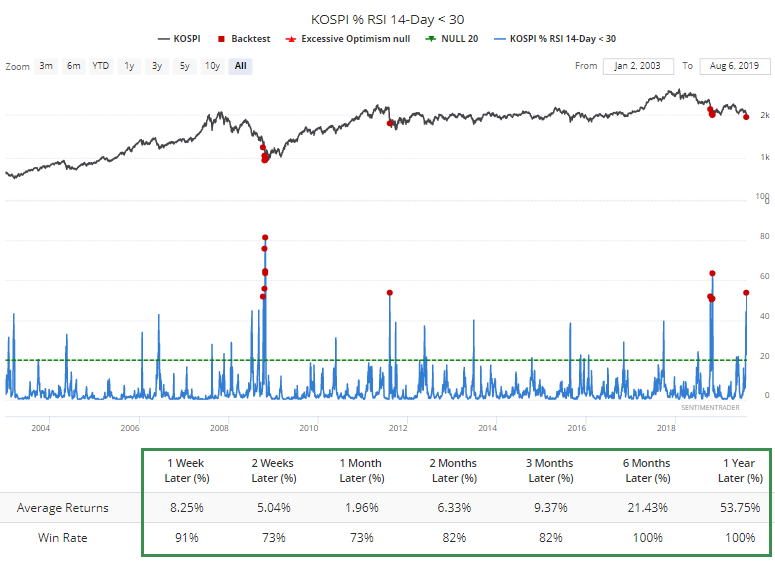
More than half the stocks have fallen far enough, and fast enough, to hit oversold levels.
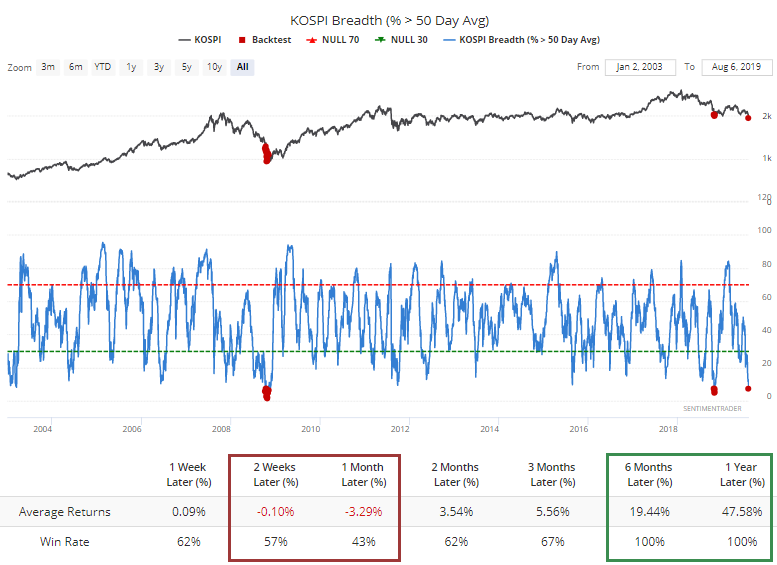
Fewer than 7.5% of those stocks have managed to hold above their 50-day averages. That's only happened two distinct times, after which there was some shorter-term volatility, but again higher longer-term prices.
Few have also been able to hold their long-term 200-day averages. By the time so few did this, the Kospi was entering the end game of bear market phases.
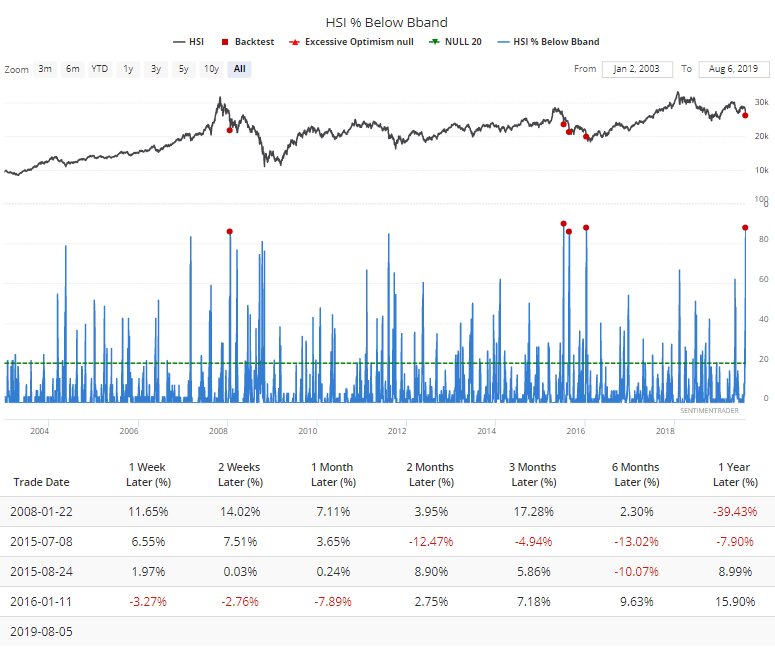
Among stocks in the Hang Seng, more than 80% of them suffered such a fall that they moved beyond their lower Bollinger Bands. That's a rarely-achieved level of selling concentration.
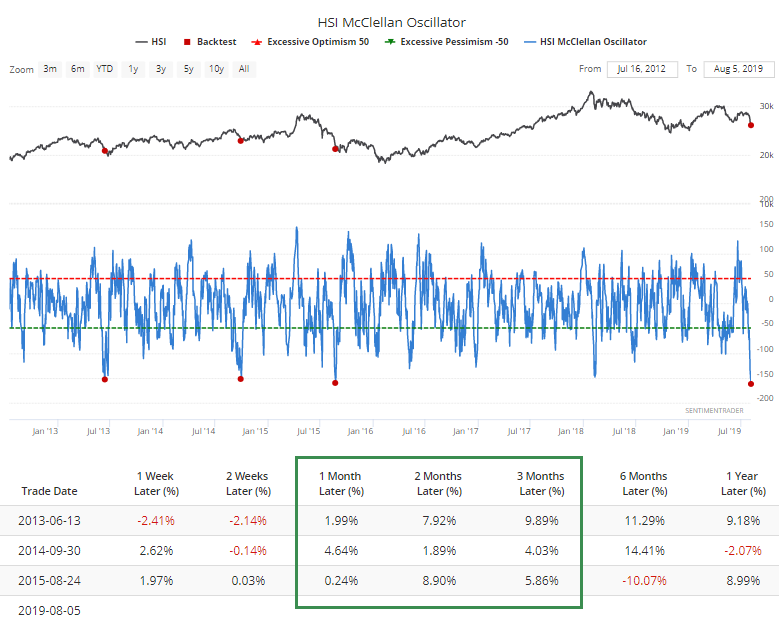
That has led to the lowest McClellan Oscillator we have on record. Other times it got below -150 led to strong rebounds.
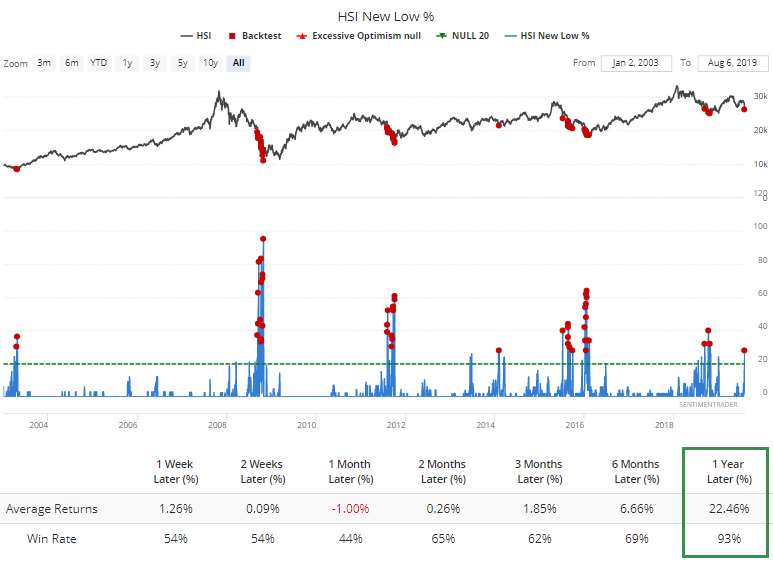
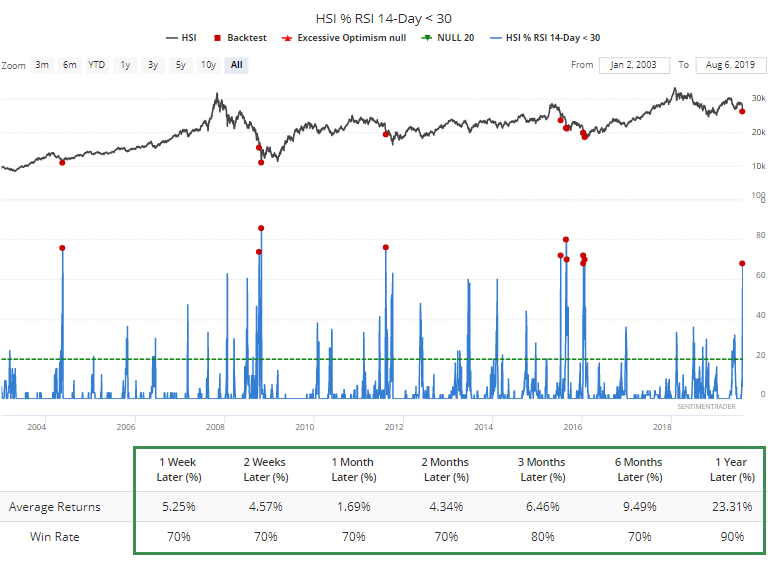
Nearly 30% of them slid to new 52-week lows, which is getting there but has been much higher. It typically triggered during the final phases of bear markets.
More than 2/3 of the stocks have sunk into oversold territory.
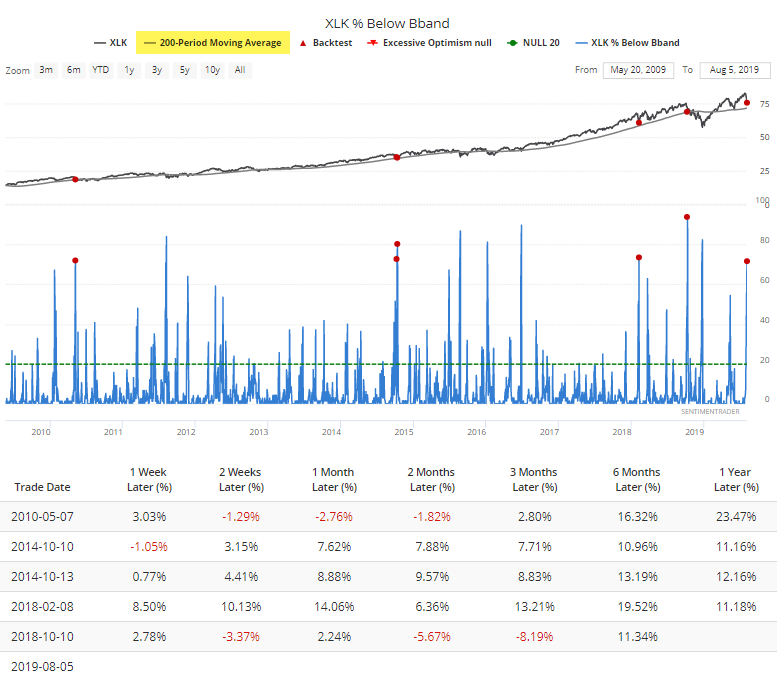
Among tech stocks, there was a surge in the number of them falling below their volatility bands, even while the broad tech indexes remain above their 200-day averages. This has only occurred since the financial crisis, so has been pretty good for a rebound.
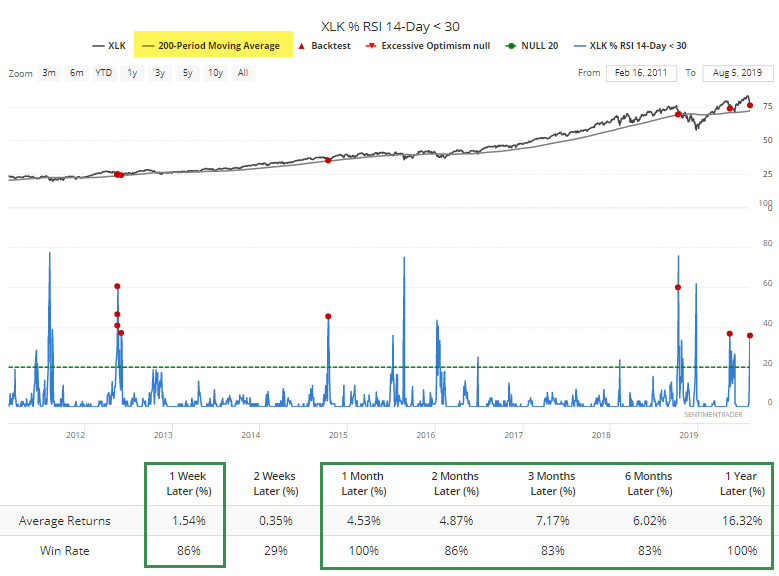
This is also one of the few times we've seen more than a third of tech stocks become oversold while the indexes are in uptrends.
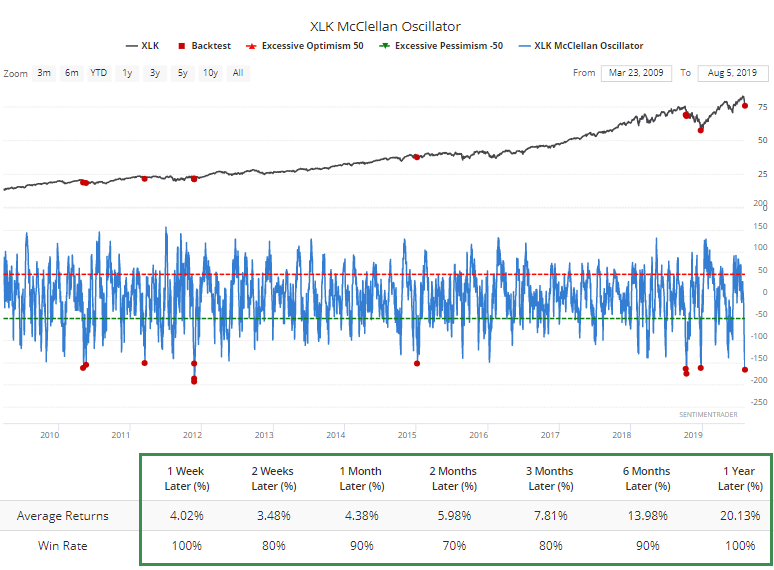
Even more remarkably, the Oscillator has dropped to -150, one of its worst-ever readings. A drop this much has been "so bad it's good" with snapbacks over the next week every time.
There are also some extremes in the French CAC 40 and American financials, but not quite to these extremes.
Fund Flows
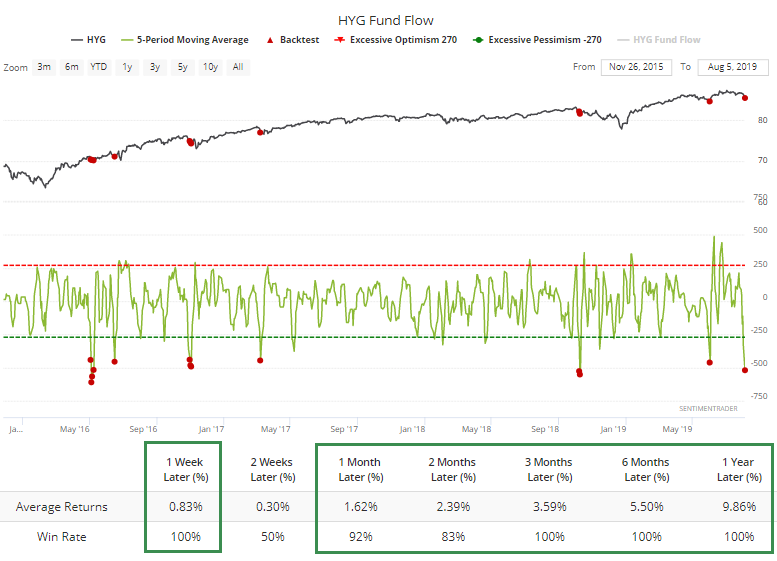
ETF flows can be tricky things, but it's worth noting that investors have fled some popular funds. The HYG junk-bond ETF has bled more than $400 million per day in outflows over the past week. That's been panic-level selling the other times it triggered.
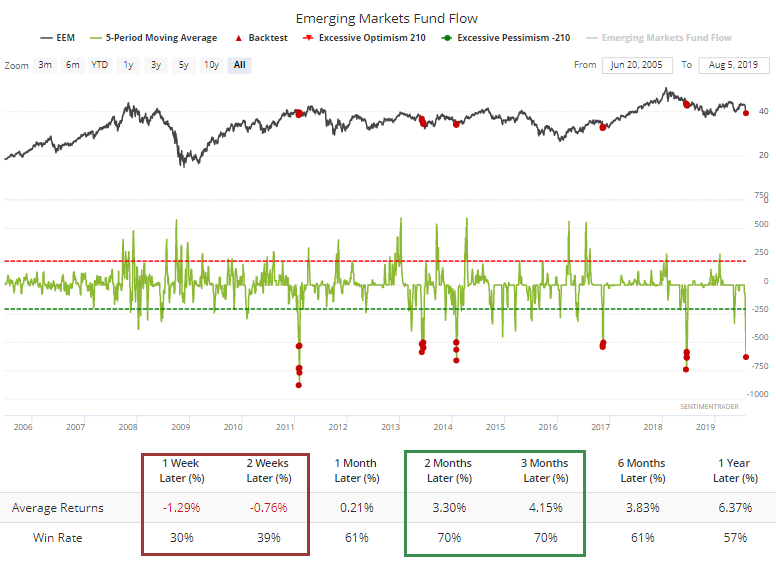
Well more than $500 million/day left the EEM emerging-markets fund.
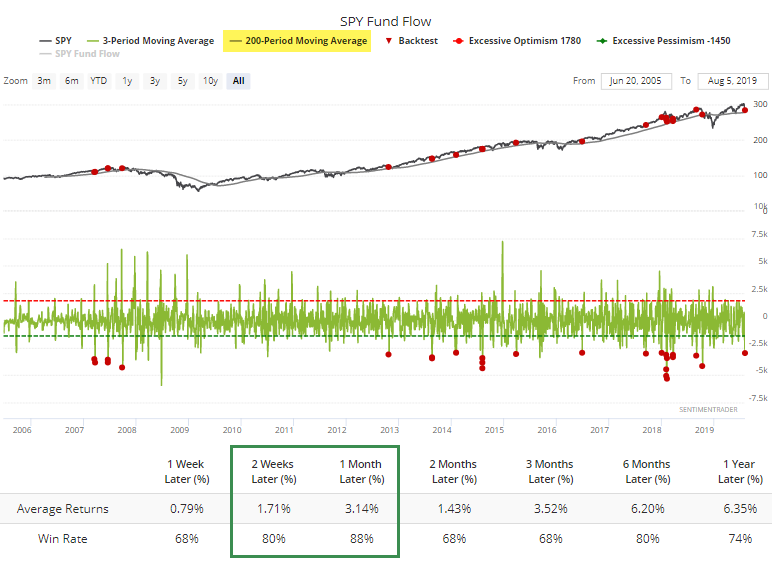
Almost $3 billion per day has left the S&P 500 SPY fund over the past three sessions.
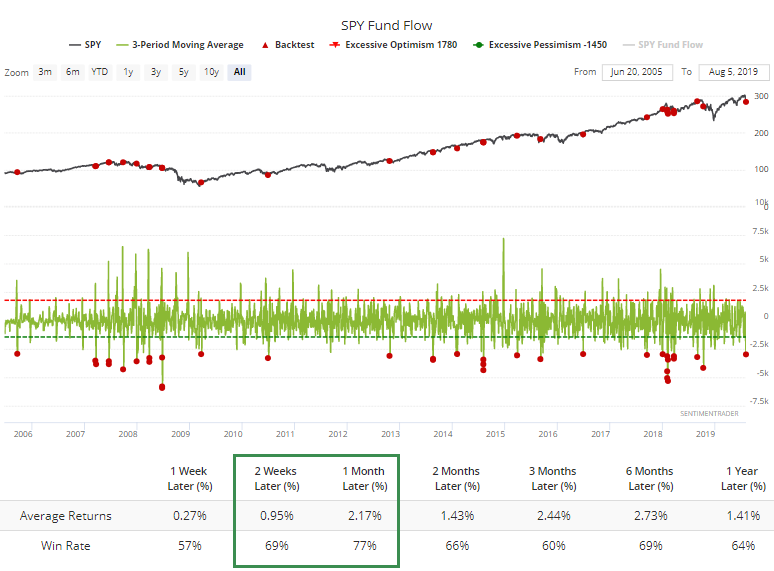
That's pretty remarkable given it's still above the 200-day average.
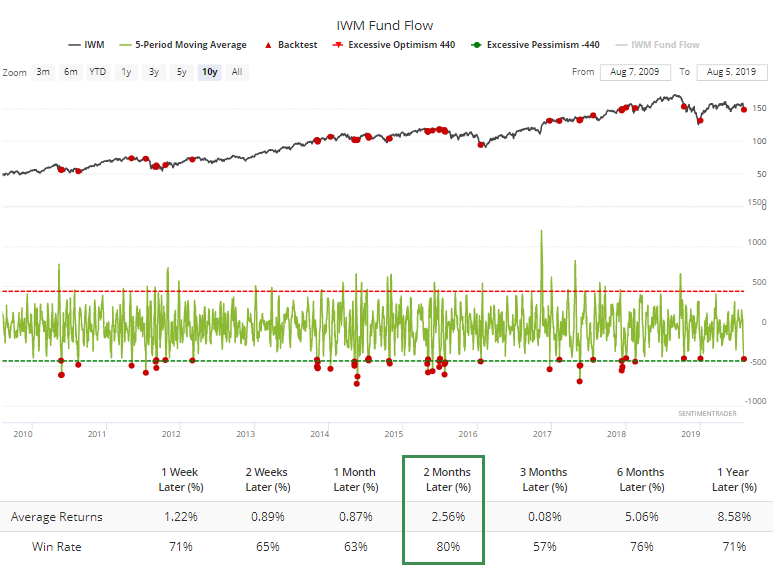
More than $400 million/day has left the IWM small-cap fund over the past week, a relatively large amount since the financial crisis.