Products
SentimenTrader Trading Tools
‍
Backtest Engine
My Trading Toolkit
Correlation Analysis
Seasonality
Market Prediction
Indicators & Data API
‍
Proprietary Indicators & Charts
Market Data API
Strategies & Scanner
‍
50+ Trading Strategies
Smart Stock Scanner
Smart Option Scanner
Research Reports
‍
Research Solutions
Reports Library
Free Resources
Simple Backtest Calculator
Simple Seasonality Calculator
The Kelly Criterion Calculator
Sentiment Geo Map
Public Research Reports
Education
Sentiment Indicators
Technical Indicators
Pricing
Company
About
In the News
Testimonials
Client Success Stories
Contact
Log inLoginSign up
< BACK TO ALL REPORTS

Tuesday Color - ISM plunge, currency flight to safety, eurozone surprises

Jason Goepfert
2019-10-01
null

Here's what's piquing my interest as markets continue their see-saw pattern of the past week.


Manufacturing Woes

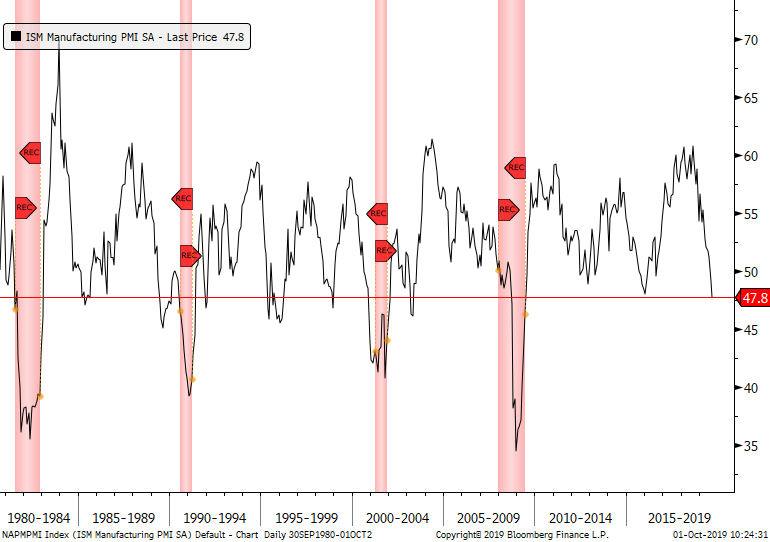
The big worry this morning is the plunge in manufacturing data. Troy has noted consistently in recent weeks that this is the weakest part of the economic data we monitor, though its impact on future returns is either mixed or heavily delayed.

Today's drop in the ISM Manufacturing survey marks the lowest reading in years.

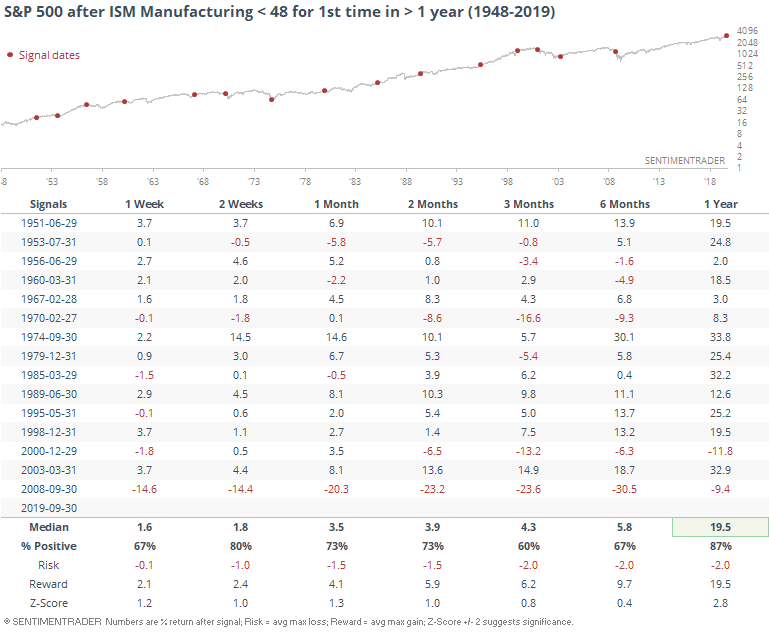
Over the past 70 years, though, by the time the ISM survey drops to this low of a level, stocks had already suffered much of their correction (if there was one). Clearly, there were exceptions, but generally it did not do well to sell the S&P 500 because of this bad of a reading.

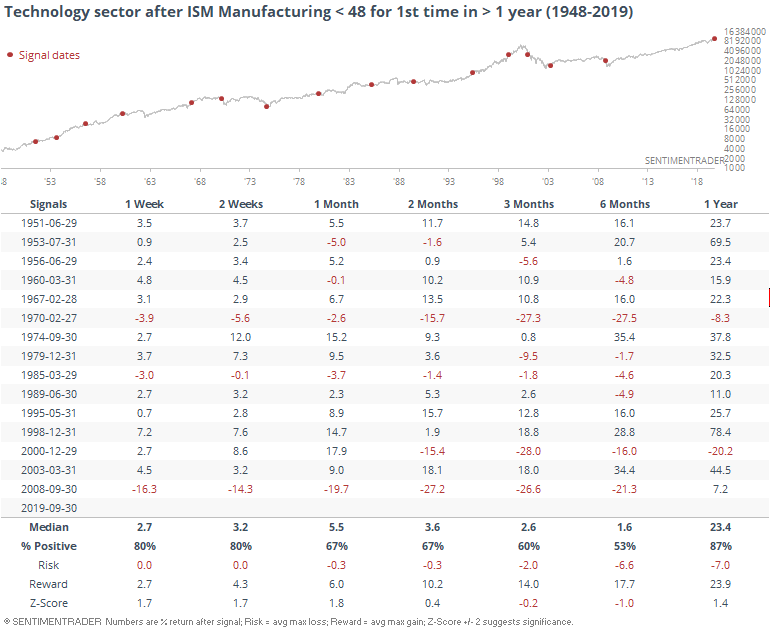
Tech stocks didn't do that well over the next 6 months, but a year later still only had 2 losses.

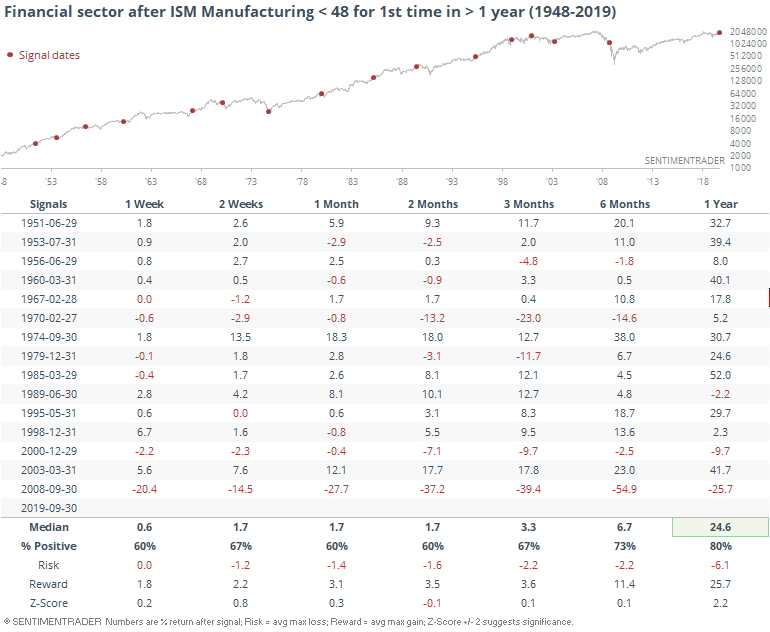
Financials weren't especially hard-hit, either.

If we add the condition that not only has the ISM survey dropped, but it's kind of collapsed over the past year by losing more than 10 points, then we get the following returns.

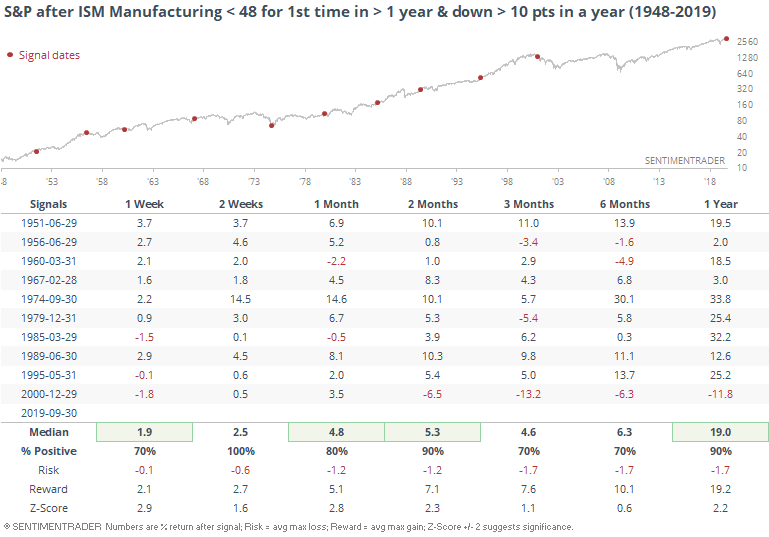
Again, it's hard to make the case that this data on its own is an explicit negative for stocks.


Flight To Safe Currencies

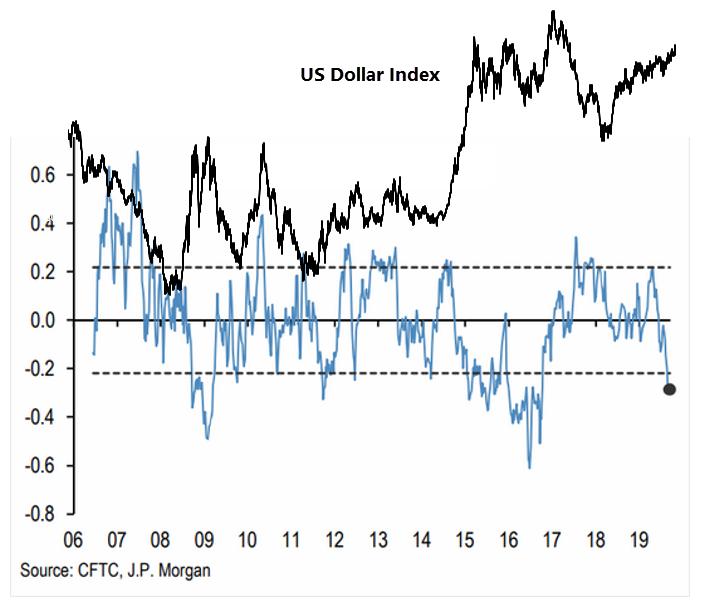
JP Morgan, via the WSJ, notes that speculators have moved into "safe" currencies at the expense of "risky" ones. The difference between them is the largest in a couple of years.

If we superimpose price action for the U.S. dollar over the speculators' positions, there hasn't been a consistent relationship.

But there has been a relationship between these positions and emerging markets.

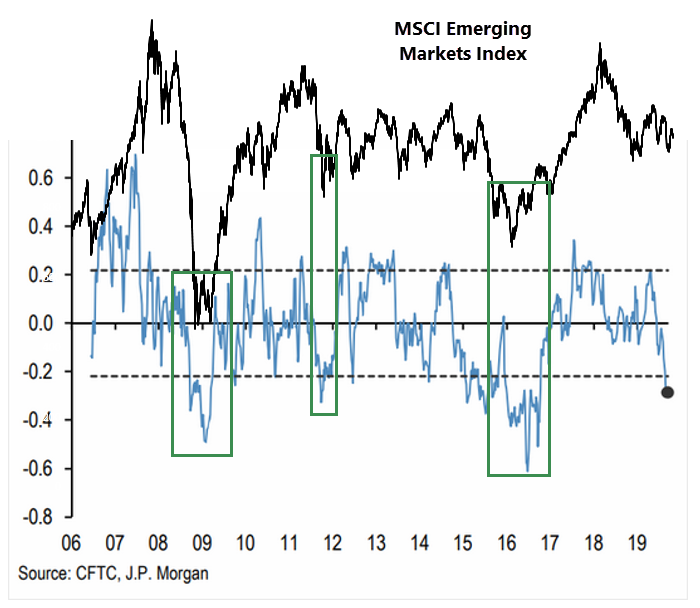
Based on prior movements, this should be a good sign for funds like EEM.
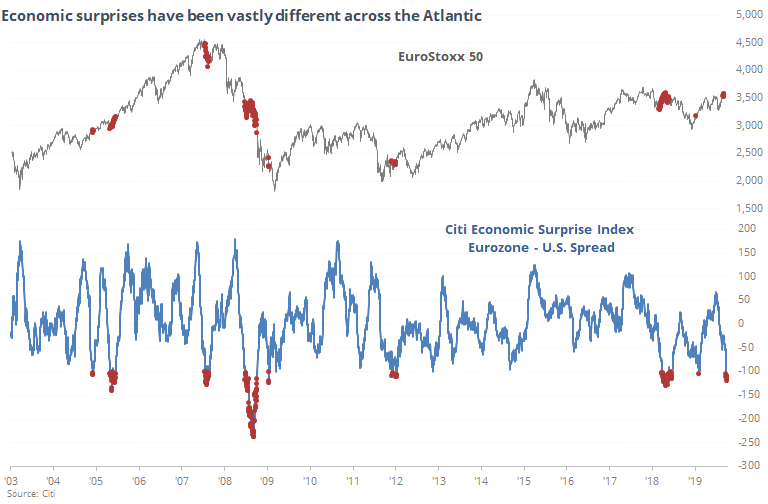
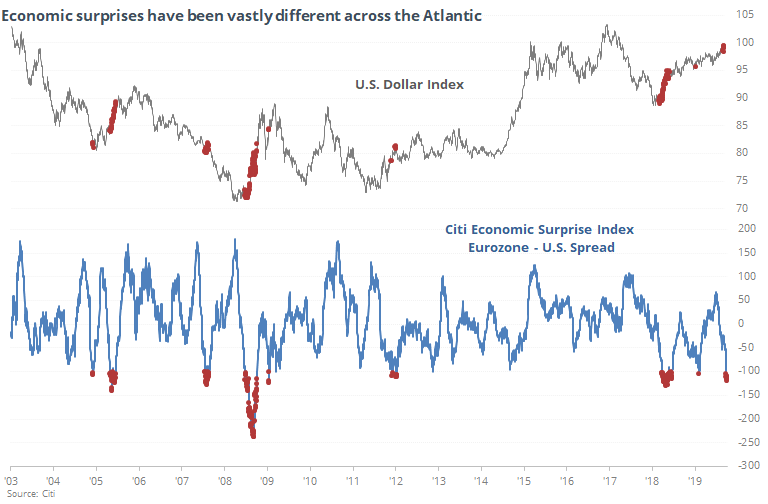

Eurozone Surprises

The Journal also notes that part of the reason for the positioning is likely the vastly different results in recent economic reports compared to economists' expectations across countries. In the U.S., surprises have been steadily to the upside; in the eurozone, quite the opposite.

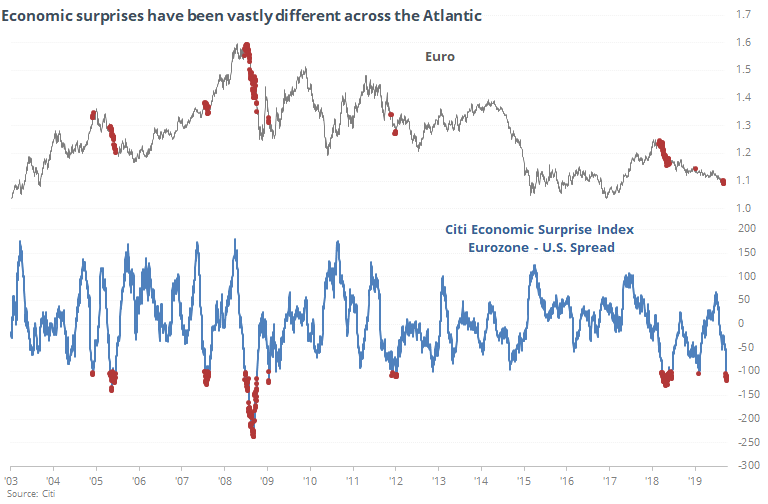
The spread between surprises in the two regions is nearing an all-time extreme. That has usually coincided with a period of a rising dollar, until the spread evens out or swings back to the opposite extreme.

Not surprisingly, the euro has typically been in decline when this happens.

It's been a mixed blessing for overseas indexes, like the DAX.

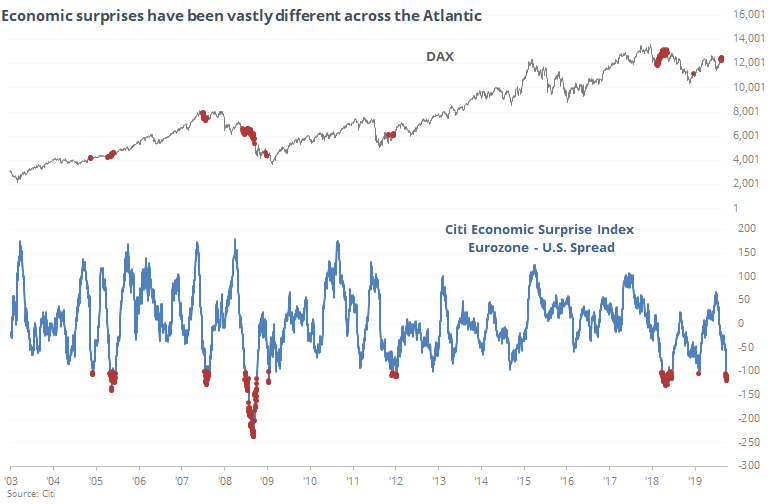
Same with the EuroStoxx.

PRODUCTS
SentimenTrader
Trading Tools
Indicators & Data API
‍
Strategies & Scanner
‍
Research Reports
FREE
RESOUrCES
Simple Backtest
Calculator
Simple Seasonality
Calculator
The Kelly Criterion
Calculator
Sentiment Geo Map
‍
Public Research Reports
‍
Education
Sentiment Indicators
‍
Technical Indicators
‍
Pricing
Bundle pricing
‍
FAQ
‍
Announcements
‍
COMPANY
‍
About
‍
In the News
‍
Testimonials
‍
Client Success Stories
CONTACT
‍
General Inquiries
‍
Media Inquiries
‍
Financial Professionals Inquiries
‍
© 2026 Sundial Capital Research Inc. All rights reserved.
Setsail Marketing
TermsPrivacyAffiliate Program
Risk Disclosure: The information and tools provided are for research and analytical purposes only and are not intended as investment advice. Market analysis involves uncertainty, and outcomes may differ from expectations. Users should conduct their own due diligence and consider their individual circumstances before making any financial decisions. Past performance is not necessarily indicative of future results.

Hypothetical Performance Disclosure: Hypothetical performance results have many inherent limitations, some of which are described below. No representation is being made that any account will or is likely to achieve profits or losses similar to those shown; in fact, there are frequently sharp differences between hypothetical performance results and the actual results subsequently achieved by any particular trading program. One of the limitations of hypothetical performance results is that they are generally prepared with the benefit of hindsight. In addition, hypothetical trading does not involve financial risk, and no hypothetical trading record can completely account for the impact of financial risk of actual trading. for example, the ability to withstand losses or to adhere to a particular trading program in spite of trading losses are material points which can also adversely affect actual trading results. There are numerous other factors related to the markets in general or to the implementation of any specific trading program which cannot be fully accounted for in the preparation of hypothetical performance results and all which can adversely affect trading results.

Testimonial Disclosure: Testimonials appearing on this website may not be representative of other clients or customers and is not a guarantee of future performance or success.