Tuesday Color - Gamma, Dislocations, Merval & Hang Seng, Emerging Fund Outflow, Bond Optix
Here's what's piquing my interest as we get some relief from the daily threat of trade dispute escalations. We'll have to see if this holds into the close and triggers another big up thrust day from the recent low.
New Indicators
You can now view the HiLo Logic Index for both the NYSE and Nasdaq on the site, as mentioned in yesterday's Report. These are the raw daily values, so plotting (and backtesting) using a 10- or 20-day moving average will probably give better buy and sell signals.
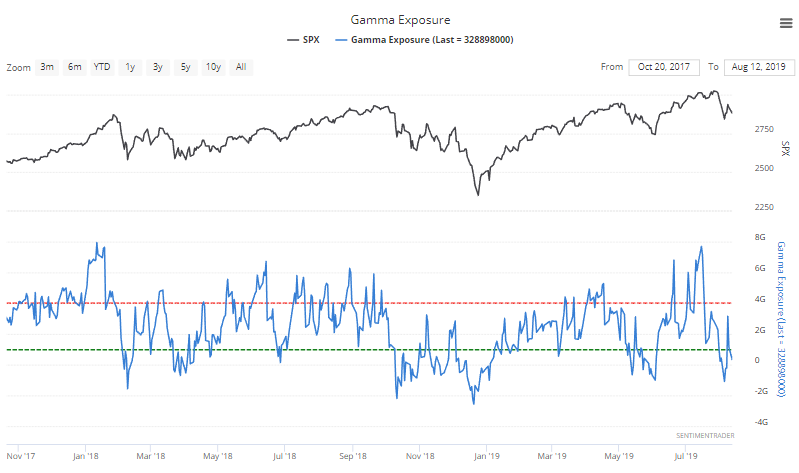
We also obtained permission from the folks at SqueezeMetrics to include their Gamma Exposure (GEX) index, an estimate of the shares likely needed to be bought or sold based on options trading in S&P 500 components.

We saw in a mid-July note that this was a worry, since it suggested there was heavy overhead supply. Now it has reversed and the GEX is relatively low.
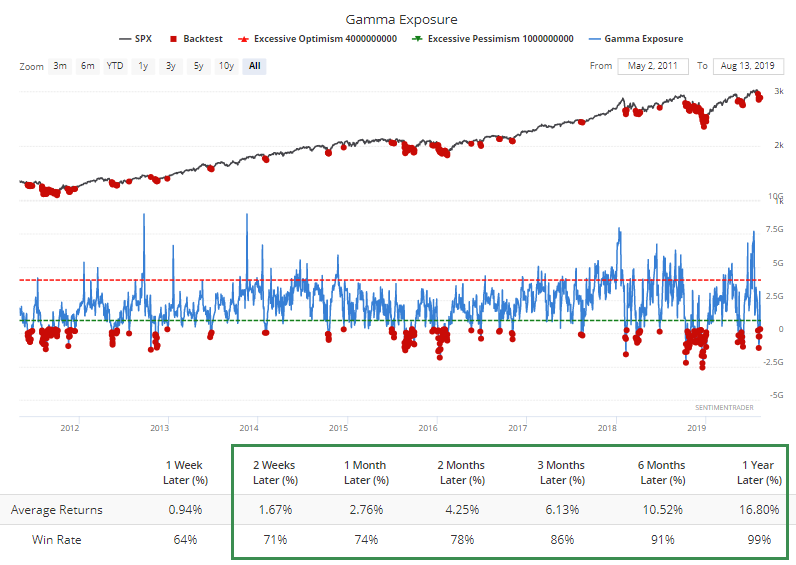
History is limited to mostly bull market environments, but this backtest shows good returns for the S&P when gamma exposure was this low or lower.
Dislocation
Investors aren't rushing into stocks, partly due to geopolitical strife. After a long period of relative calm, there are points of contention around the globe.
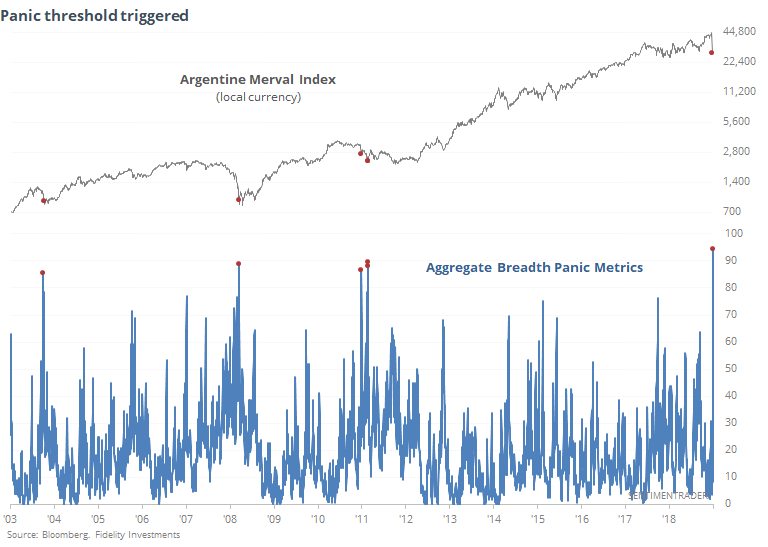
One concern is the massive plunge in Argentine stocks, with the Merval index losing nearly 38% of its value in a single session. That's the equivalent of the Dow Industrials losing 9,875 points in one day.
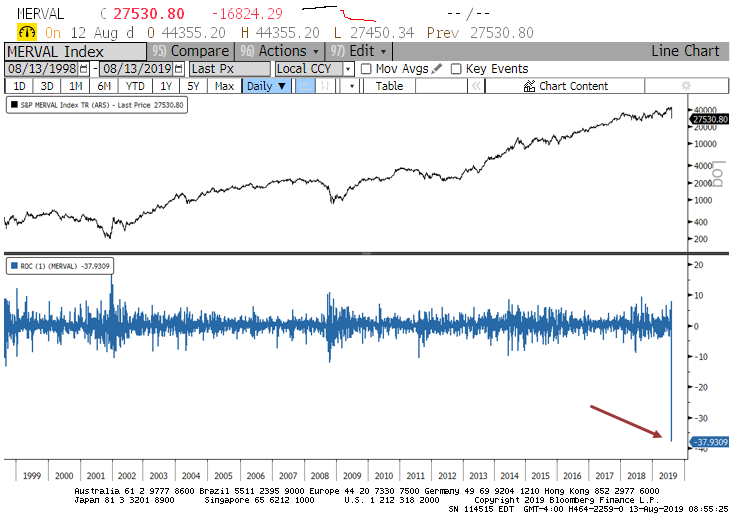
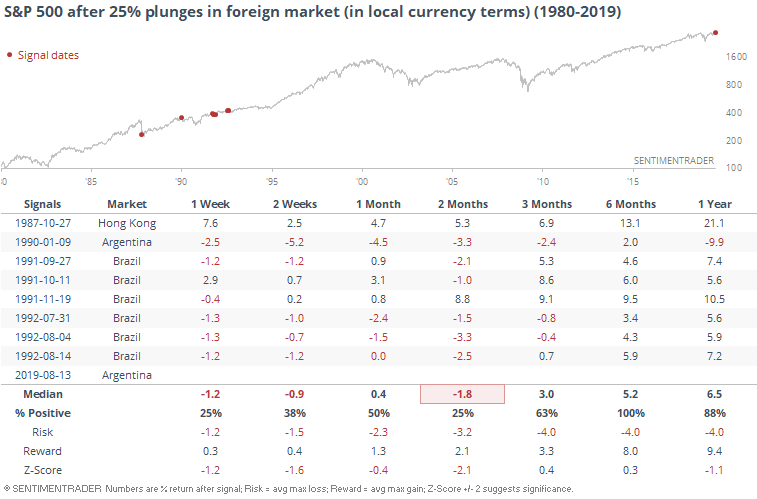
Moves like this always raise the potential for contagion. The history of one-day plunges like this is limited, with only a handful in the past 30 years, and all with their own unique circumstances.
If we take it at face value, though, it seems like it has been something of a worry in the shorter-term. But six months after a market lost more than a quarter of its value in a single session, the S&P 500 was higher every time.
With the move in the Merval, it's not surprising that few of the 20 members stocks in that index escaped severe damage. Every stock is below its 10- and 50-day averages, and only 1 is above its 200-day average. A handful are holding above their 52-week lows, but every stock has plunged below their lower Bollinger Band and all but 2 are oversold.
That has pushed an aggregate of breadth panic metrics to the highest level in 17 years. Other times it got nearly as high were all at/near the end of the selling pressure, but they also came after extended declines, and not one-day panics.
Hong Kong
It's not quite as bad on the Hang Seng, but it's getting there. That index is generating some readings now that have rarely if ever been seen in 17 years.
Over the past week, an average of more than 60% of stocks in the index have been oversold.
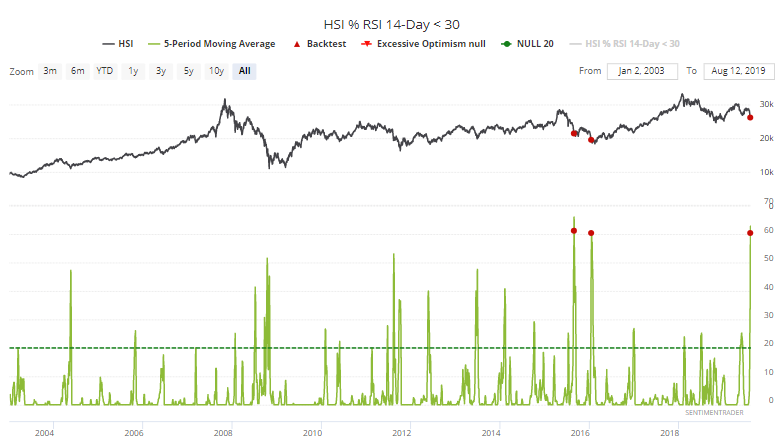
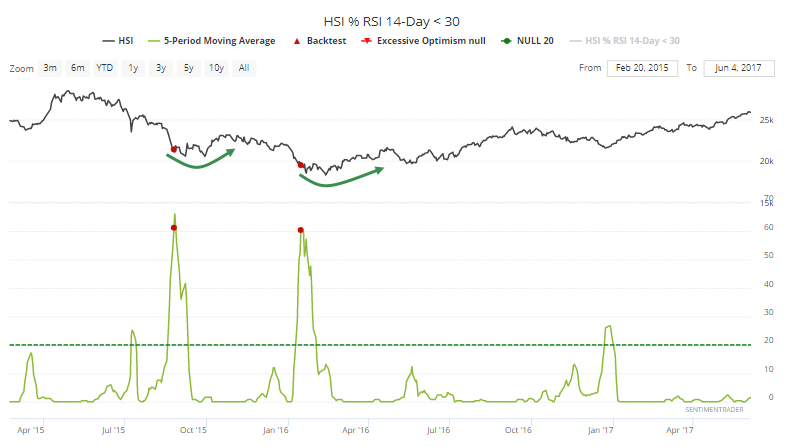
Two two other times that happened, in 2015 and 2016, the Hang Seng was forming rounded bottoms.
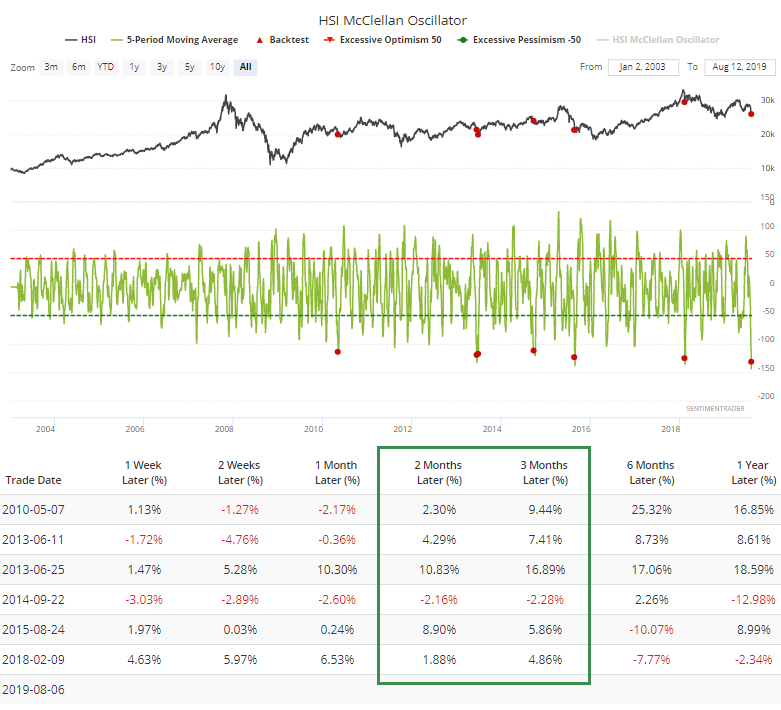
The selling has pushed the McClellan Oscillator to a record low. Other times the 5-day average dropped below -110, the index rallied all but once.
The persistently negative Oscillator has served to shove the Summation Index below -1050.
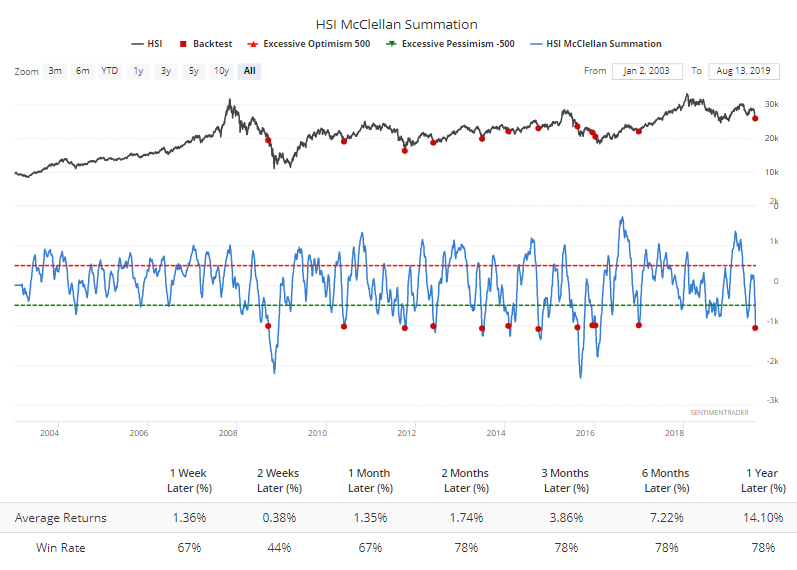
There isn't yet a clear-cut "this is it" sign of pure outright panic in these stocks, but most of the indicators are showing heavily oversold conditions that have consistently preceded medium-term rebounds.
Exodus
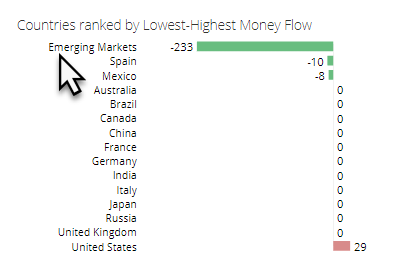
The constant drum of worries in emerging markets has caused traders to flee. Looking at the Ranks table on the Dashboard, we can see that emerging markets have had the worst money flow.

If you click the Emerging Markets link, it will bring up the chart.
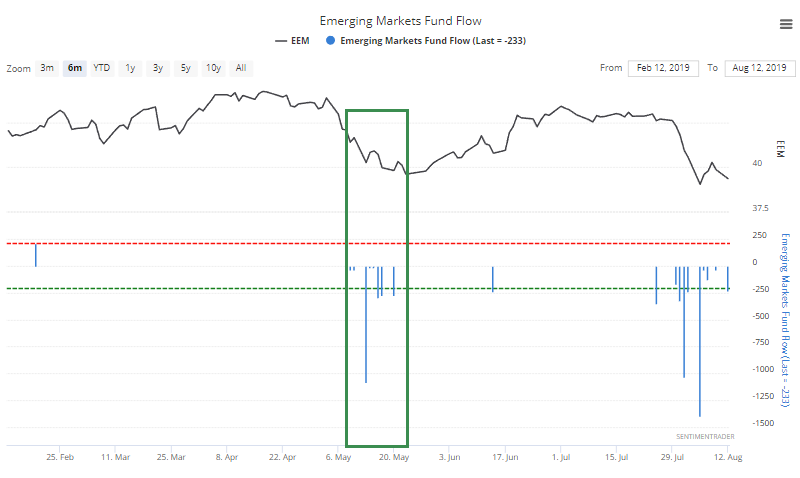
Most days lately have seen outflows, similar to May.
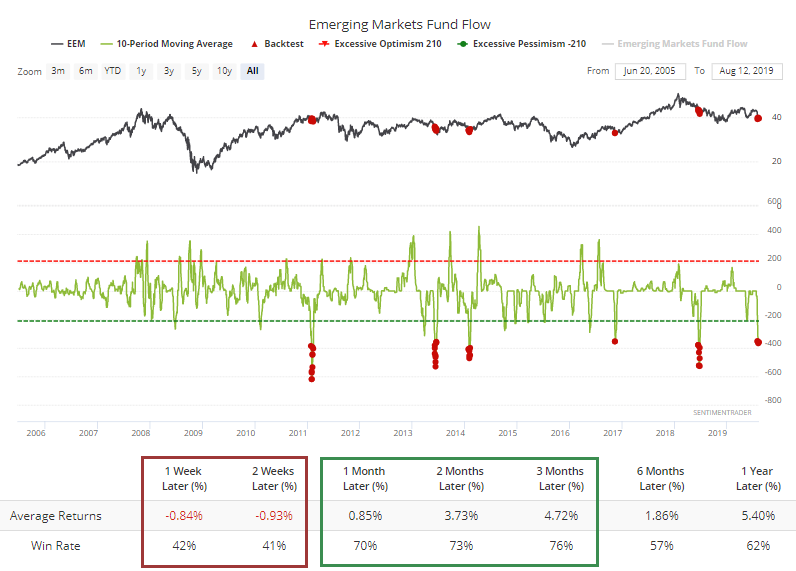
Over the past 10 days, EEM has suffered an average outflow of more than $350 million per day. If we test that to see what it's meant, we can see that it has usually coincided with pessimistic conditions that continued shorter-term but were mostly reversed in the medium-term.
Sector Breadth
Among U.S. sectors, the past week hasn't been enough to trigger many extremes. But among tech stocks, the 10-day average of the McClellan Oscillator has dropped below -90.
Over the past 20 years, when it has been this low, XLK was higher over the next 6 months after 46 out of 48 days, and one of those losses was tiny.
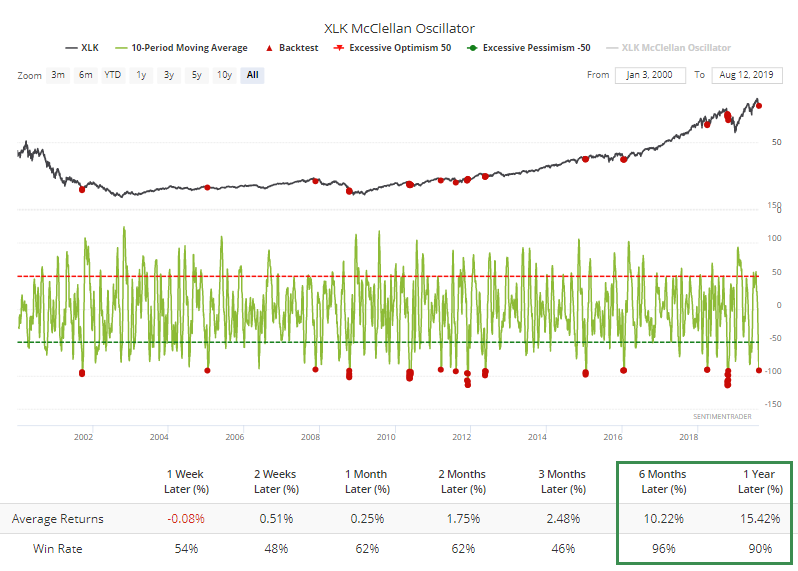
To run this exact test, click here and then click the Run Backtest button.
Selling pressure is getting there in financials, too, with the 10-day Oscillator averaging worse than -80.
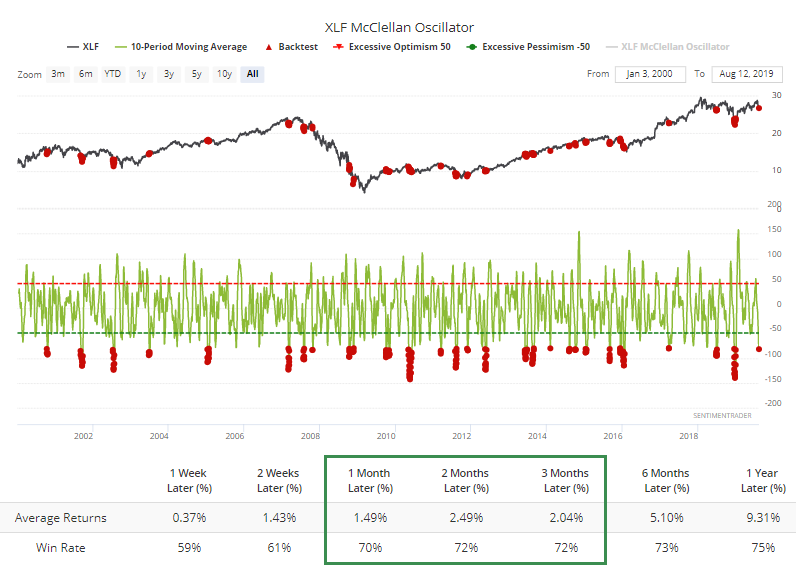
This isn't as extreme as that in tech, and its forward returns weren't as consistent, but it had a decent record at preceding positive medium-term returns.
Big Moves
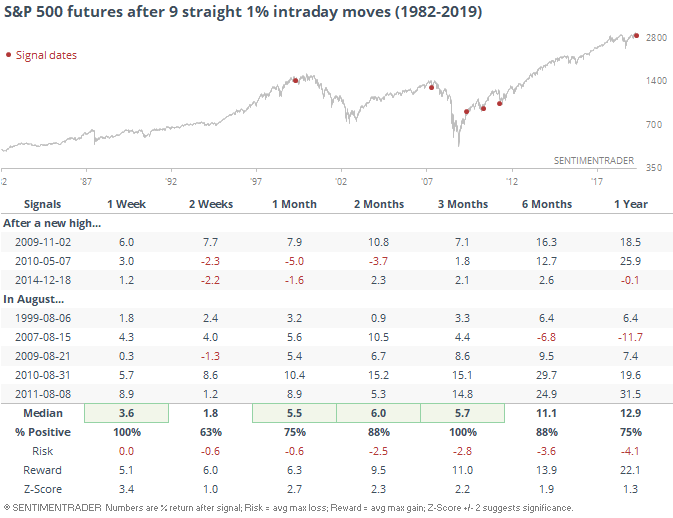
We saw in the report yesterday that long stretches of intraday volatility following a recent 52-week high OR during the month of August has led to higher prices. Not sure how much weight to place on this, but here are the dates and future returns for the S&P 500 futures.
Bonds, Again
The risk-off mentality has helped bonds once again, and the Heatmap is showing big red squares for the go-to ETFs.
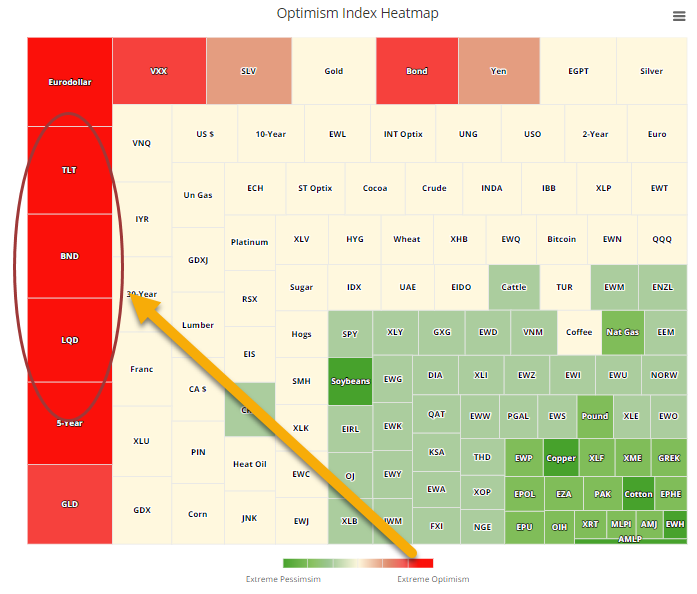
The 10-day average of the Optimism Index for TLT has pushed above 80. According to the Backtest Engine, future returns were horrid.
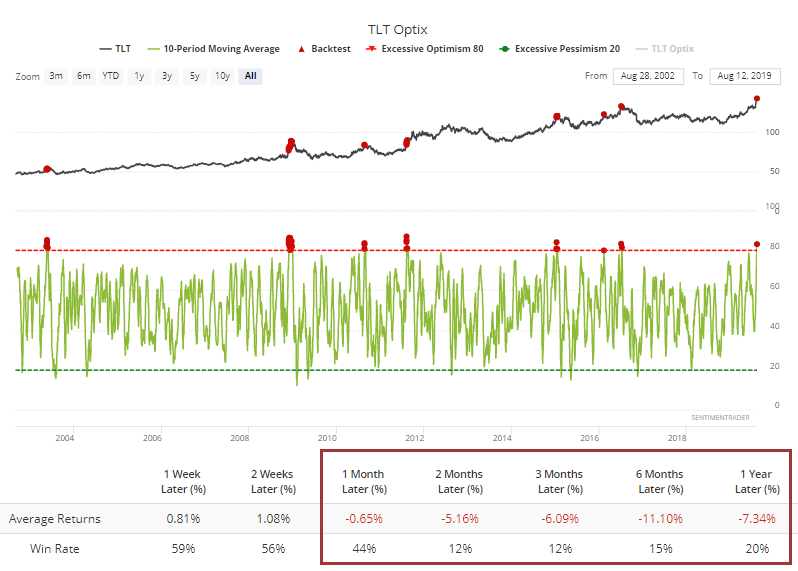
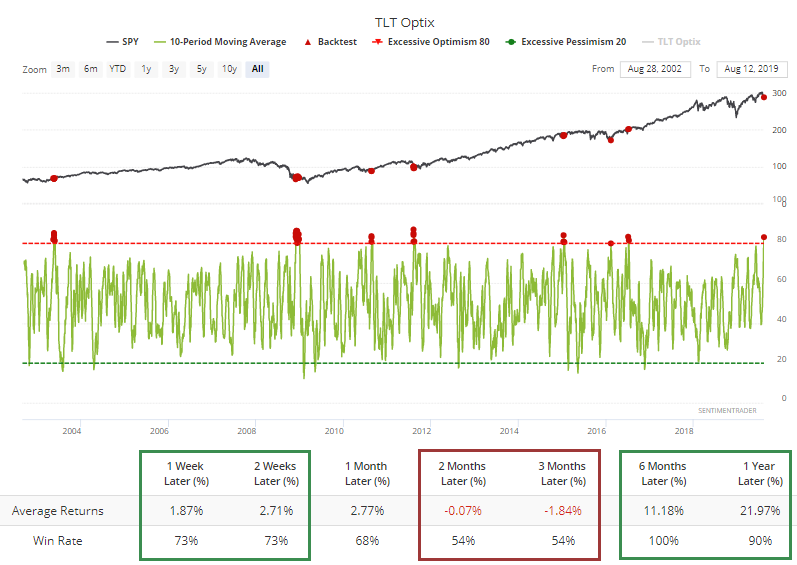
If you pull up that backtest, you can change what's being tested. For example, we can swap out TLT for SPY to see if this kind of extreme optimism on bonds meant anything for stocks.

Doing that and then clicking Run Backtest again will show that SPY tended to jump shorter-term, had mixed returns medium-term, but showed a perfect record of gains over the next 6 months.
Bad Attitude
Sentiment toward european equities is significantly worse than for those in the U.S. That was brought into stark relief by the latest ZEW survey of German economic sentiment. This month, it plunged to the lowest in 8 years.
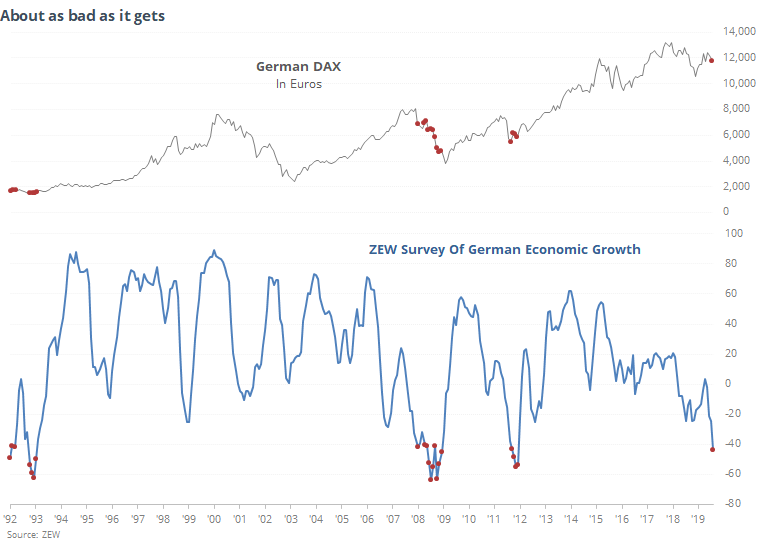
There have been 3 distinct periods since 1990 when it got this low or lower. Two led to almost immediate and lasting recoveries in the DAX. The other was during the worst of the financial crisis. It's hard to imagine we're heading for a repeat, but Germans seem to be anticipating it.

