
Tuesday Color - Earnings, ETF Flows, Gold vs Baltic Index, XLY, New Moon

Here's what's piquing my interest as traders start to position themselves ahead of a deluge of earnings.
Earnings Parade
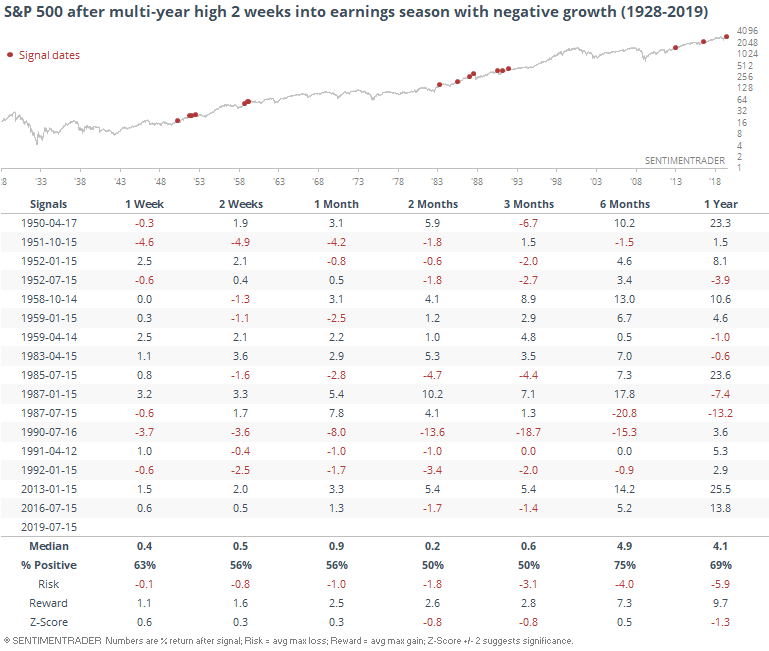
Much is being made of the potential slowdown in earnings as companies begin to report in earnest over the next couple of weeks. We've seen in years past that "earnings recessions" are not necessarily a sell signal, but it's still relatively unusual to see stocks hovering at or near highs when earnings growth is negative.
That, too, hasn't been a clear sell signal, but it did lead to more risk than reward over time.
Especially when it was this quarter.
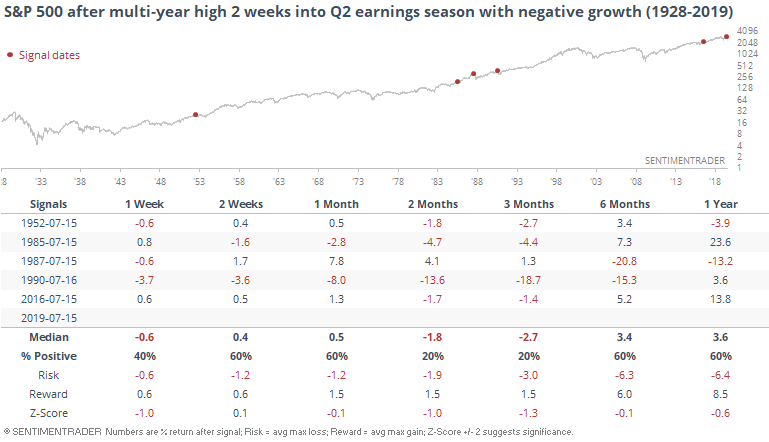
After each of these, the S&P 500 ran into trouble in the months ahead. Not one of the 5 managed to sustain any gains, with each of them showing a loss either 2, 3, or 6 months later.
Rushing In
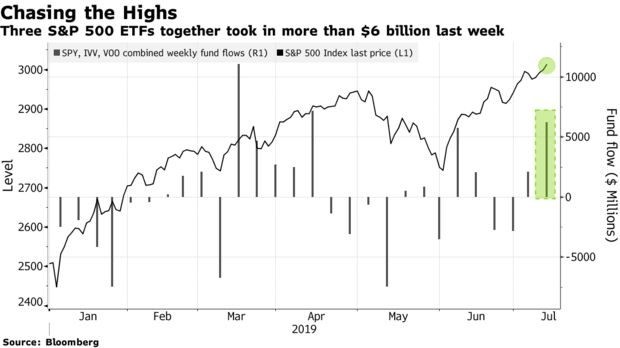
Bloomberg notes that investors have plowed into the S&P 500, shoving more than $6 billion last week into the 3 primary ETFs that track that index.
If we go back further, we can see that this is still a lot of dough, but it has been much, much higher. And like we often see with ETF flows, there wasn't a clear correlation between how markets performed and when traders decided to move into and out of the funds. Some of this is also shorting activity.
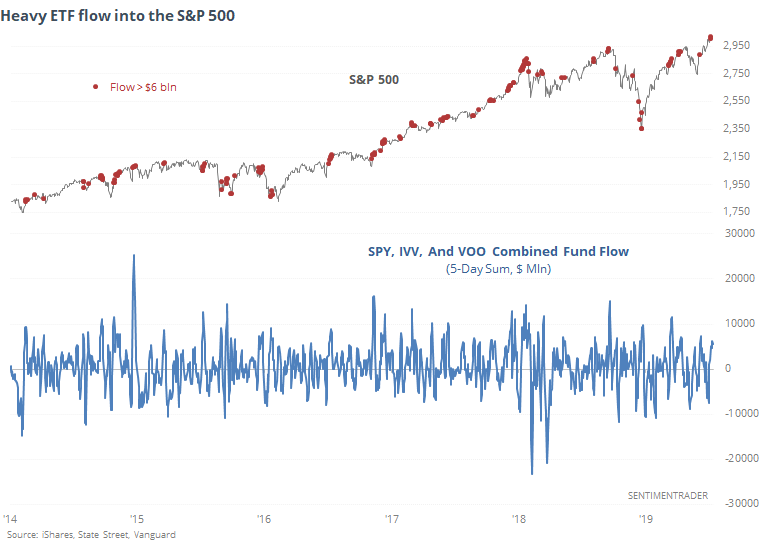
Because the funds have ballooned so much, $6 billion in a single week doesn't mean so much anymore. It's only about 1% of total assets, and that's not all that extreme.
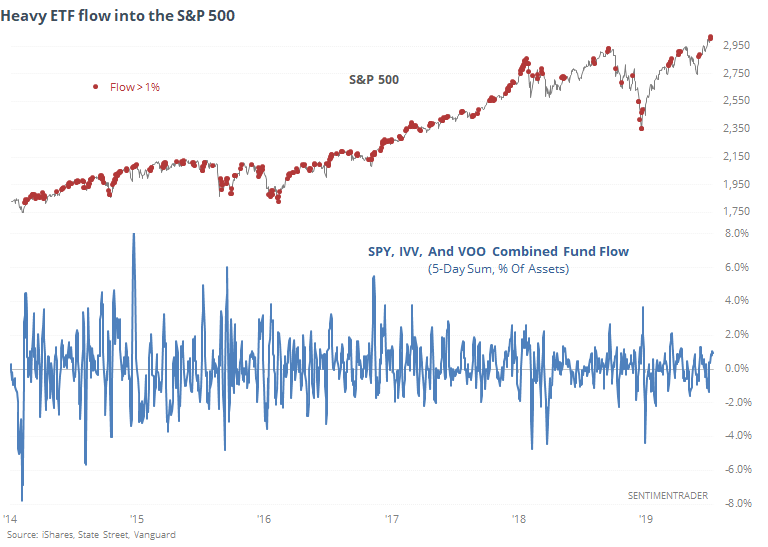
If we filter out the instances so that we're only looking at times when traders added more than 1% of assets to the S&P funds when the index was sitting at a 52-week high, then there were still more than 60 days that qualified, but it was a minor drag on returns over the next 1-3 months.

High And Dry
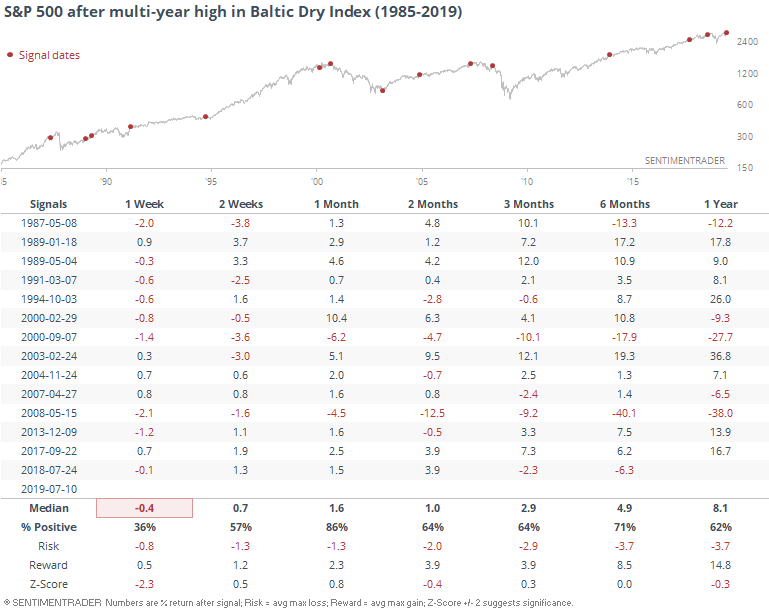
The Baltic Exchange Dry Index, a measure of shipping freight costs, is soaring. This is one of those favored esoteric indicators that gets trotted out every now and then.
In theory, it makes sense to use it as an indicator of global economic activity. In practice, it has been much less useful.
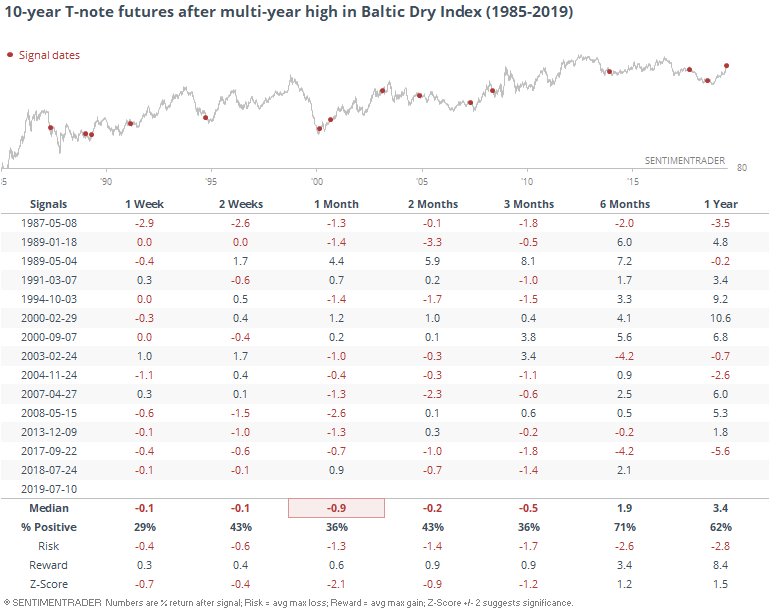
For U.S. stocks, it hasn't been a great sign when the BDI breaks out to a new multi-year high. The S&P 500's forward returns were about in line with random across all time frames and if anything, its risk/reward was underwhelming.
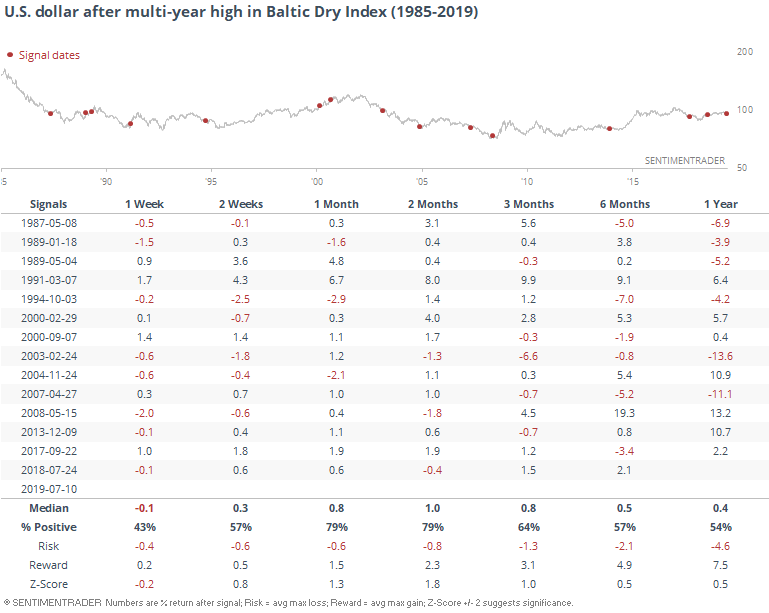
It was a decent sign for the dollar, especially over the next 1-2 months.
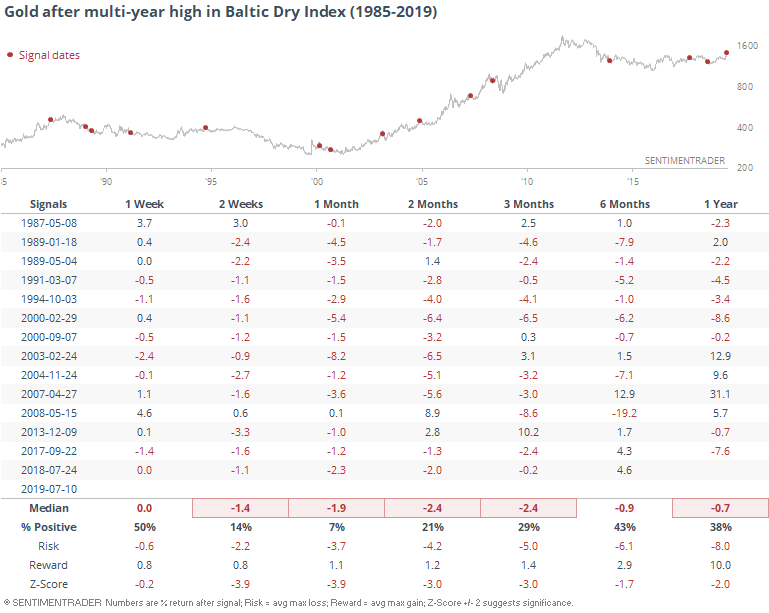
Because the dollar did okay, gold did not, and with extreme prejudice. Over the next month, it managed to show a (tiny) gain only one time.
Bond prices also didn't fare so well, with declining prices (rising yield) across all time frames up to 6 months later.
Sector Breadth
We saw yesterday that streaks of momentum in consumer discretionary stocks have led to almost universally higher prices over the next couple of months. Not many of those have triggered in recent decades, with the only recent precedents being in 2013 and 2017. One led to a choppy medium-term market, the other a nice rally, so *shrug*.
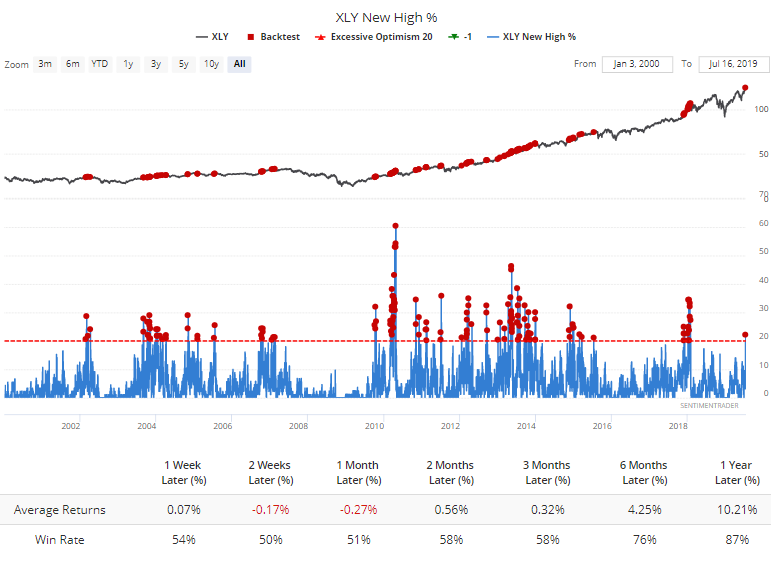
It has been enough of a push that more than 20% of discretionary stocks hit a fresh 52-week high on Monday, the most in over a year. While XLY still rallied more often than not over the next 2-4 weeks, its average return was negative.
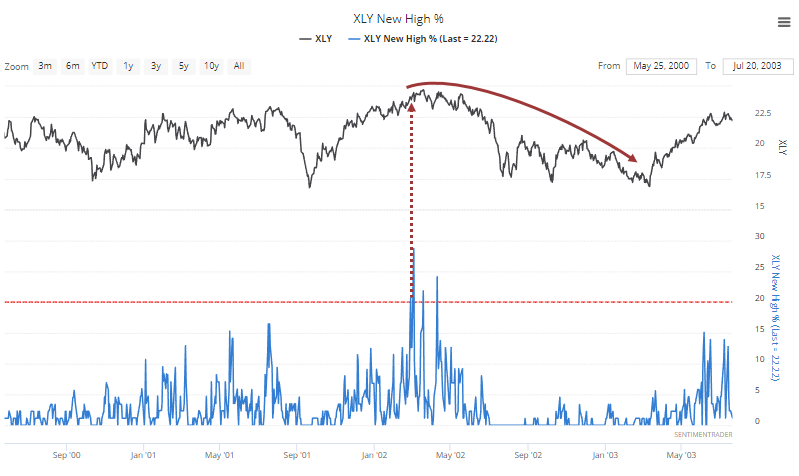
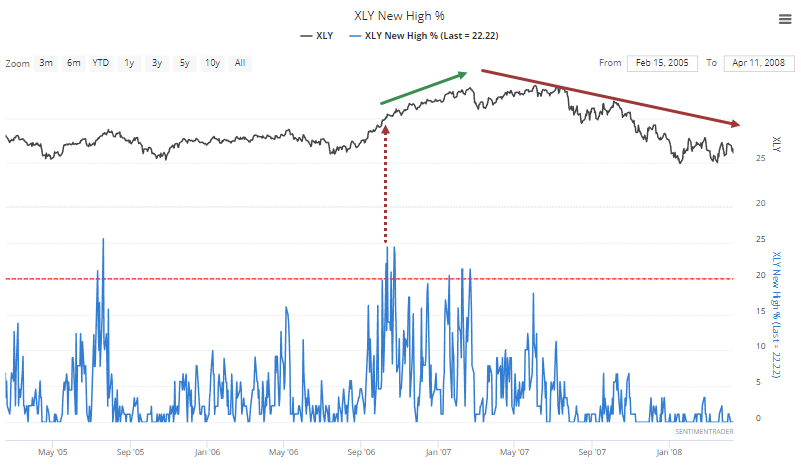
 Let's focus on the first time there was a spike in new highs in over a year. In 2002, XLY managed to add some short-term gains, but those were short-lived.
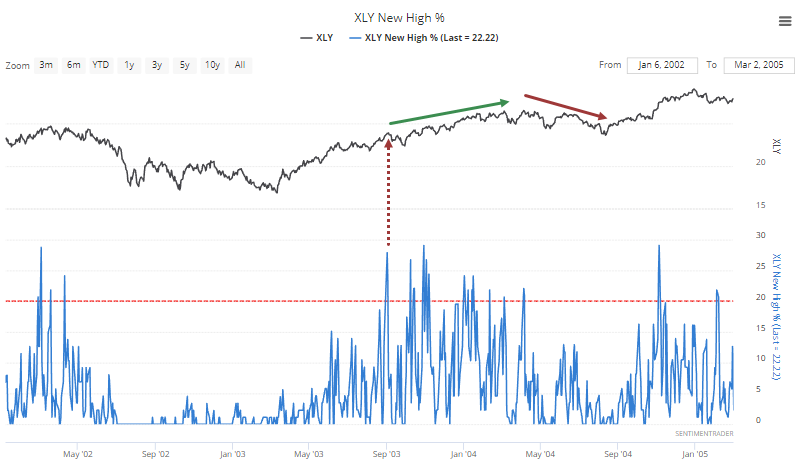
The initial spurt out of that bear market led to a short-term pullback, then months of grinding higher in 2004 before a pullback subsequently erased all of those gains.
When there was a spike in new highs in 2006, XLY continued to march higher without interruption for months...then rolled into the financial crisis.
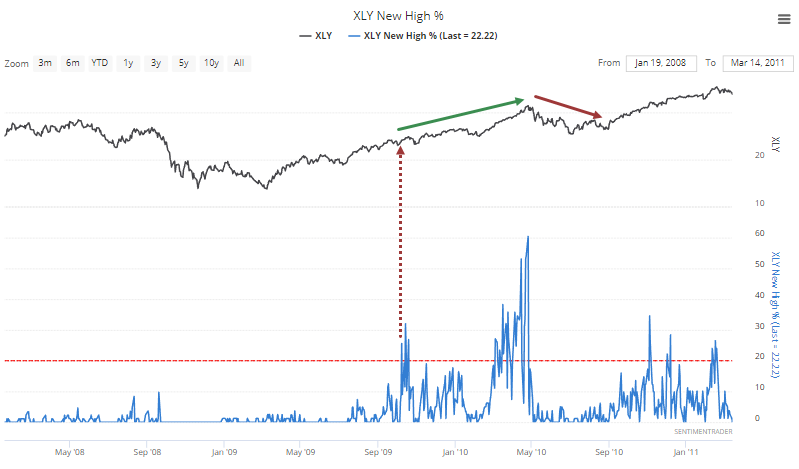
The emergence from that bear market led to another short-term pullback once there was a spike in 52-week highs, but it didn't last long and XLY tacked on tremendous gains into the spring of 2010, but once again a subsequent pullback erased most of those temporarily.
The last time this happened was in late 2017, after which XLY continued to rocket higher into the January 2018, erasing much of that gain during the next pullback.
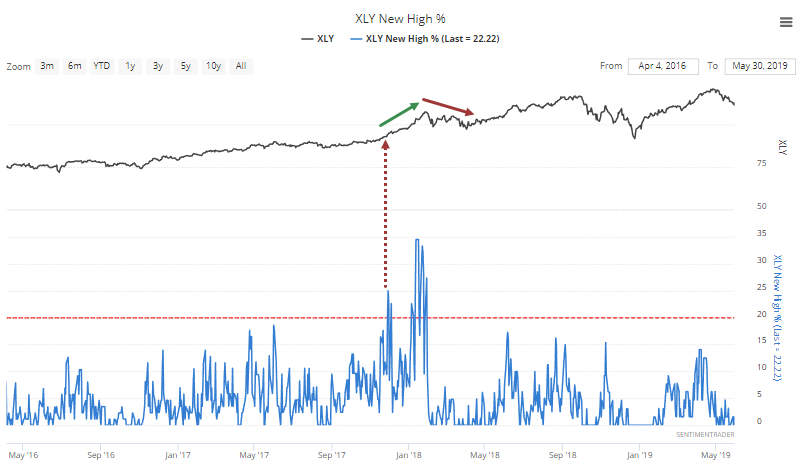
Overall, there isn't a strong case that this is an immediate negative for the sector. But it has been very tough for XLY to hold its subsequent gains.
No Liquidity Needed
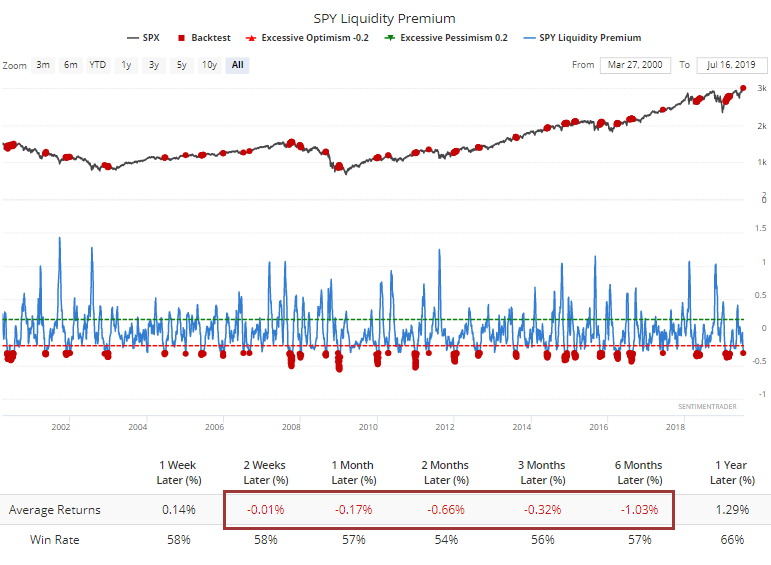
One of the indicators we created about 15 years ago is the Liquidity Premium for SPY and QQQ. This looks at volume in the most liquid ETFs versus the volume in their underlying component stocks. The theory was that during times of duress, traders would place a premium on the most liquid trading instruments, which were the ETFs, compared to trying to trade individual stocks.
It has mostly worked out that way, with extremely high ETF volume typically occurring during times of panic, and extremely low volume during times of comfort and complacency. If everything looks rosy, then traders see little need for the relative safety (or at least liquidity) of the best trading vehicles.
That's a bit of a worry now because the indicators are showing extreme complacency, and that has preceded weak returns for SPY.
Buck Moon
Depending on how many full moons there have been in a year, July's is typically referred to as the Buck Moon. According to Native American lore, this is about when bucks begin to grow new antlers.
Bulls are wondering if this is the time to pull their own horns in, as there is some mysticism surrounding solar and lunar events. An old market trope is that stocks tend to struggle following new moons.
There really isn't much to this, but it's true often enough to perpetuate the cliche. Below, we can see every time since 1928 when the S&P 500 had been at a 52-week high within the past few sessions, and there was a full moon in July.
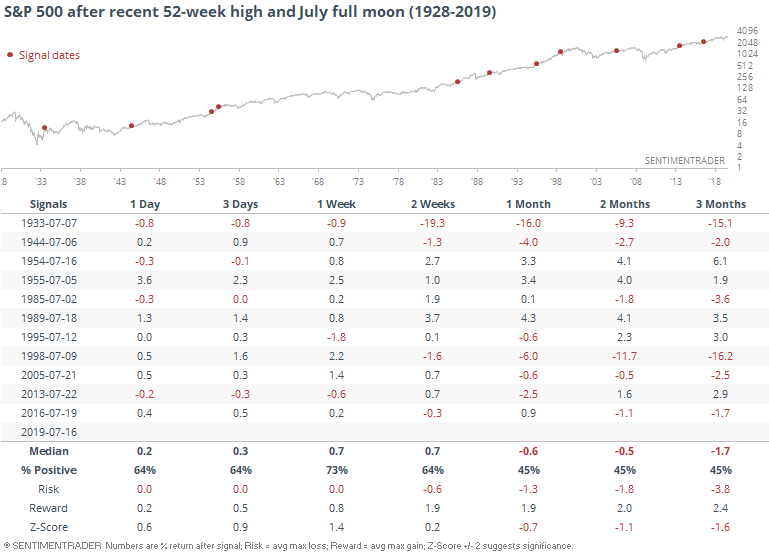
It's not enough to cause bulls to howl (if bulls did, indeed, howl) but is a bit of a medium-term worry.