
Tuesday Color - Fund Manager Panic, New Model, OEX, UAE, Miners

Here's what's piquing my interest as stocks jump on the latest hopeful headlines.
Fund Manager Panic
We've already seen evidence that individuals have reached near-panic conditions over the past few weeks. They took out a massive number of hedges, they've said they're near a record level of pessimism during a relatively health market with breadth at a new high, and they've pushed heavily into bonds and defensive sectors. Even hedge fund managers haven't been immune.
Now there is some evidence that the largest investors are right there along with them.
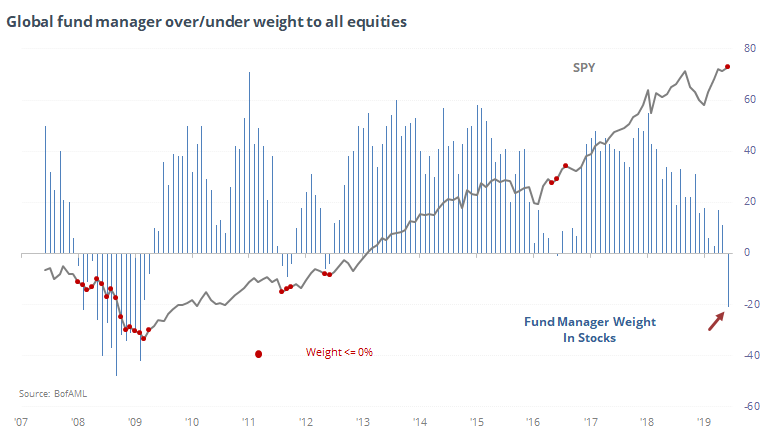
The latest monthly fund manager survey from Bank of America Merrill Lynch showed a heavy under-weight in equities. They haven't been this pessimistic since the financial crisis, which was actually an excellent call. When they went underweight stocks, stocks tanked. Since then, though, it has been an excellent contrary indicator with large gains triggering soon after they went underweight.
It was also their 2nd-largest monthly drop in allocations to stocks in over a decade. The only month that saw a larger decline was July 2011, when they went from 38% overweight down to 5%. Stocks still managed to drop soon after, then took off to the upside.
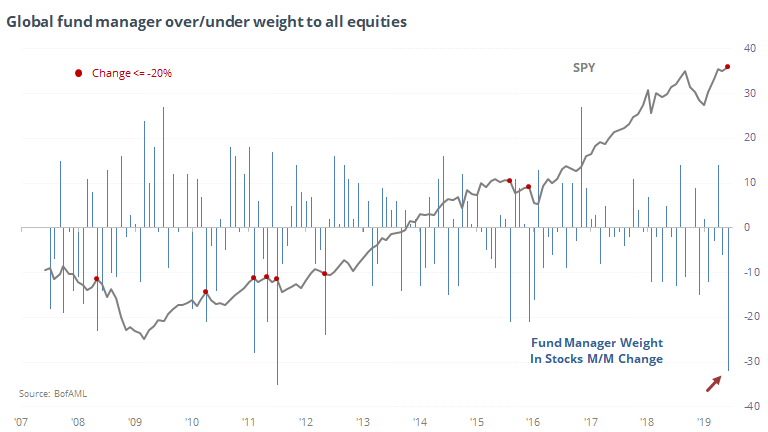
While the absolute level of their weight has been a good contrary indicator, big drops month-over-month have not (dates are approximate - the survey typically comes out about mid-month).
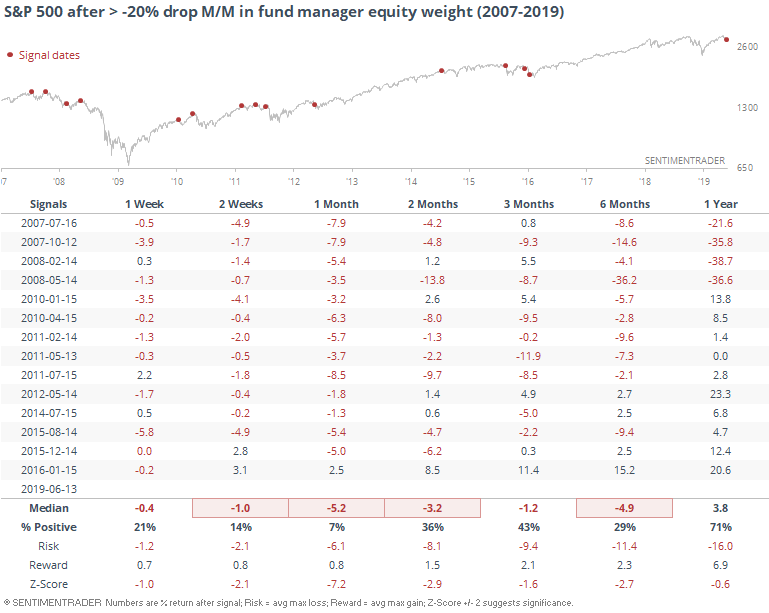
How can we reconcile this? I dunno. These big month/month drops are compelling, but their equity exposure is so low now that really the only precedents are from the financial crisis, and it seems like more than a stretch that we're in a similar environment now. I'd lean toward the idea that this might be shorter-term negative and longer-term positive.
While managers dropped their equity exposure, they upped the bond exposure. The difference between the two is now the smallest since - again - the financial crisis. That was the only time these folks had more exposure to bonds than stocks. But again, that wasn't necessarily a contrary indicator, as stocks greatly underperformed relative to bonds.
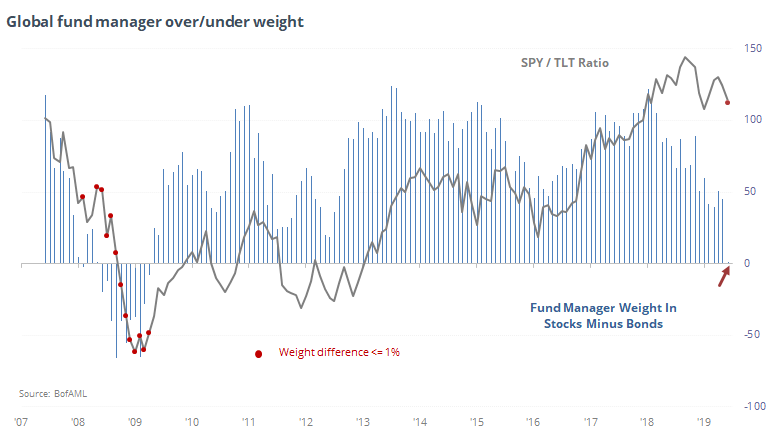
Overall, the survey is a confusing data point. It *seems* like it should be a good sign for stocks and bad for bonds. But it's not as simple as it appears on the surface.
Combined Model
Yesterday, I mentioned the new model that Eric created and updates on the site. It is a composite of 14 shorter-term indicators updated daily on the site, and uses machine learning to determine how to combine them. While it is meant to be a short-term measure of broad extremes, using a moving average can be effective as well.
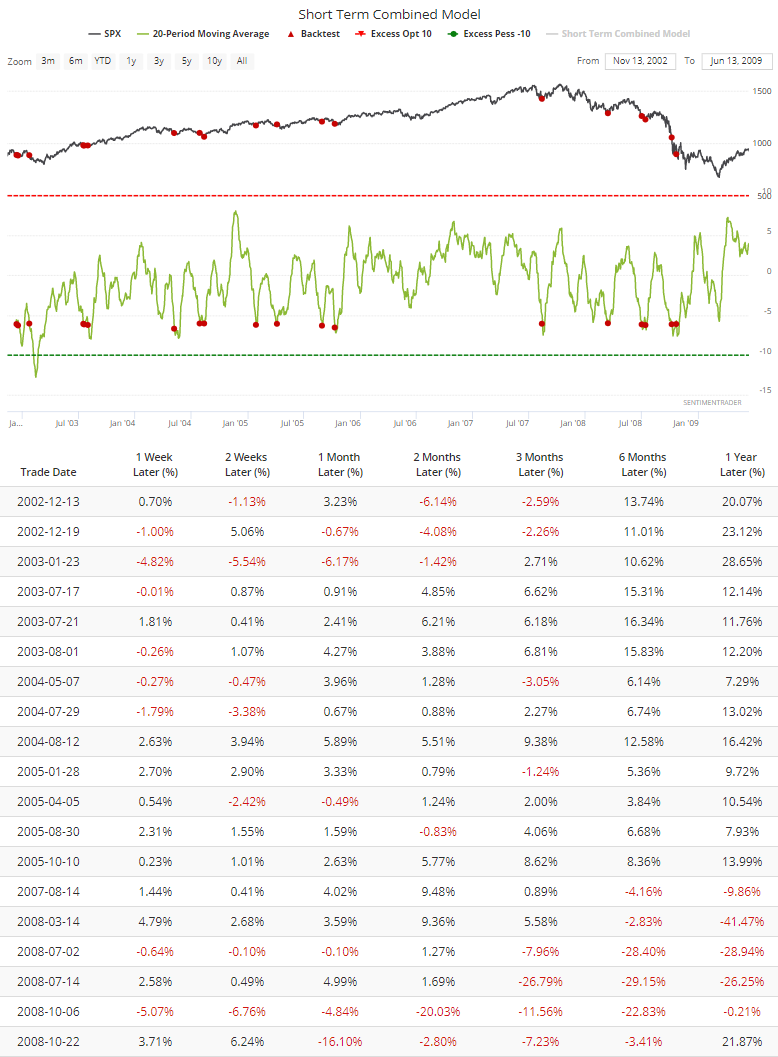
The 20-day average of the model dropped below -6 earlier in June, and while stocks have already jumped significantly since then, in the period since the financial crisis, an average reading this low has preceded more sustained gains.
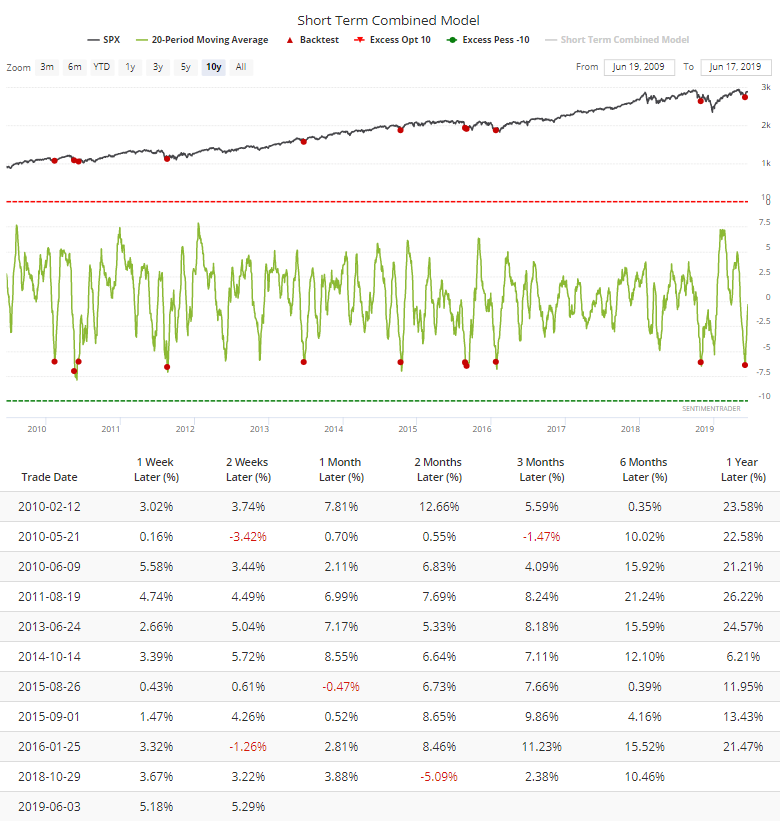
Prior to the financial crisis, there were some failures, particularly in 2008, of course.
I think it's a valuable addition and will be watching it daily.
Smart Money (?) Options Traders
When I was primarily trading options 25 years ago, the S&P 100 (OEX) index was the go-to contract. It was the most liquid, and volume was tremendous. Interest in the contract has steadily declined, moving to S&P 500 options, the futures market, and now ETFs.
On an average day, barely 1,000 contracts change hands now, so its relevance is greatly diminished. It might even be finished. But we still follow the OEX put/call ratio and a couple others, more for old time's sake than anything.
Put turnover has jumped in recent days. On an average day over the past two weeks, more than 250 puts have traded for every 100 calls. Historically, that would have been a sign that big "smart money" traders are negative on stocks, but that's been an iffy conclusion in recent years.
It was prescient in 2016 and again last summer, but had two false signals, too.
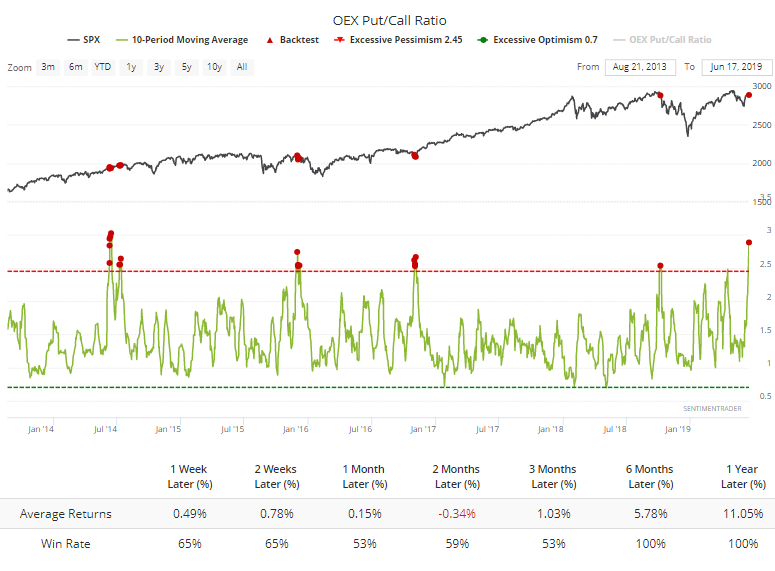
It makes me a little bit nervous, but that's mostly because I used to like the indicator. There isn't much evidence to suggest it's a major negative now.
Country Pessimism
Among all country ETFs we follow, none has more pessimism right now than the UAE.
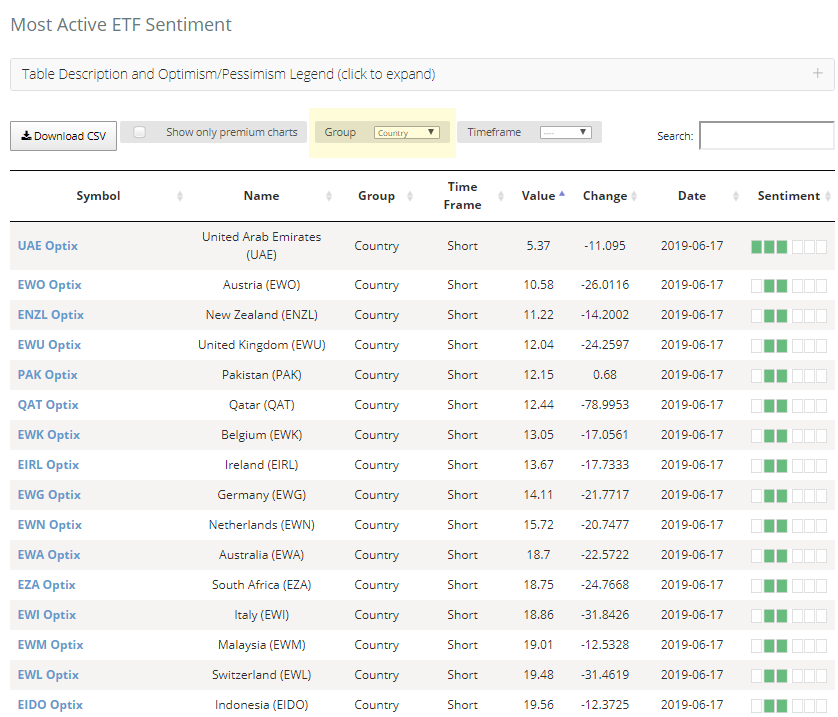
Over the past 3 sessions, the Optimism Index has averaged less than 12, the lowest since 2016.

If we zoom in on 2015-16, when optimism got this low, it was within days of the end of selling pressure. The longest it took was 4 sessions.
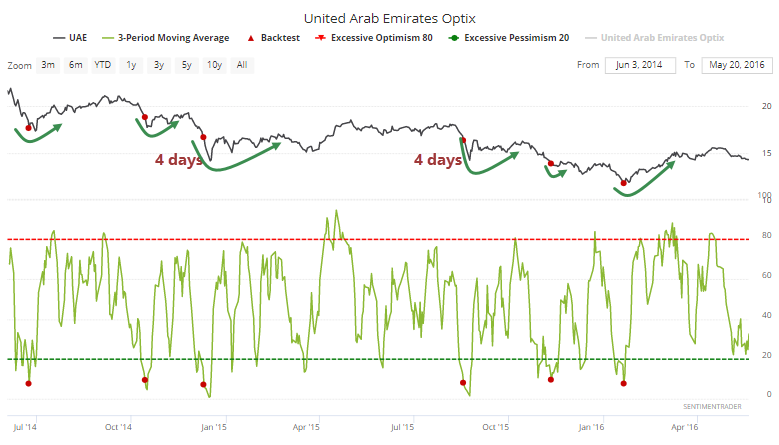
For those interested in that market, we should be on the lookout for signs of exhaustion, which should be here or very near.
Major Miners
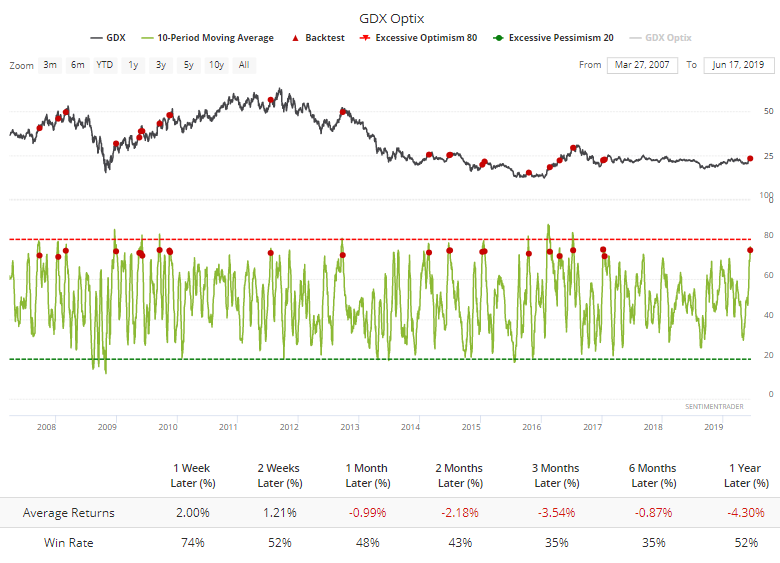
Gold miners have performed extremely well lately, even with only tepid moves in gold. The 10-day Optimism Index for GDX jumped above 75, and has started to relax a little. Since the inception of the fund, when the 10-day crosses below 75, it has had a lot of difficulty resuming its momentum.
Folks on Twitter have also become enthused about the group. Over the past 10 days, there have been fewer than 80 negative messages about GDX than positive ones.
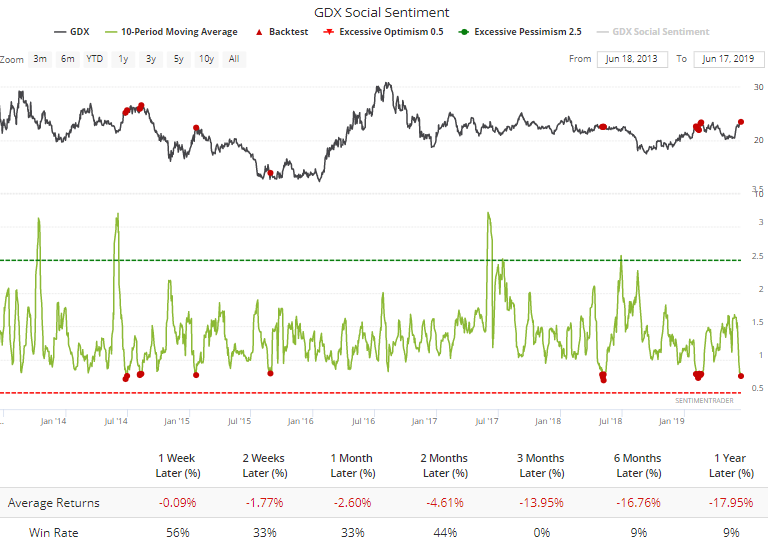
Neither of these are major warnings, but they will prove to be a good test for the nascent trend. As always, if the fund continues to attract buyers in the face of readings like this, it strongly suggests "this time is different" and there are larger secular forces at work.