Tuesday Color - Gaps Up, Bond Flow, Weird Volatility, Sector Highs

Here's what's piquing my interest on another gap-up morning.
Another Gap
Near the depths of pessimism a couple of weeks ago, we saw that traders were extremely anxious, pushing stock futures lower almost every morning. They've reversed the tide, now futures are gapping up every day.
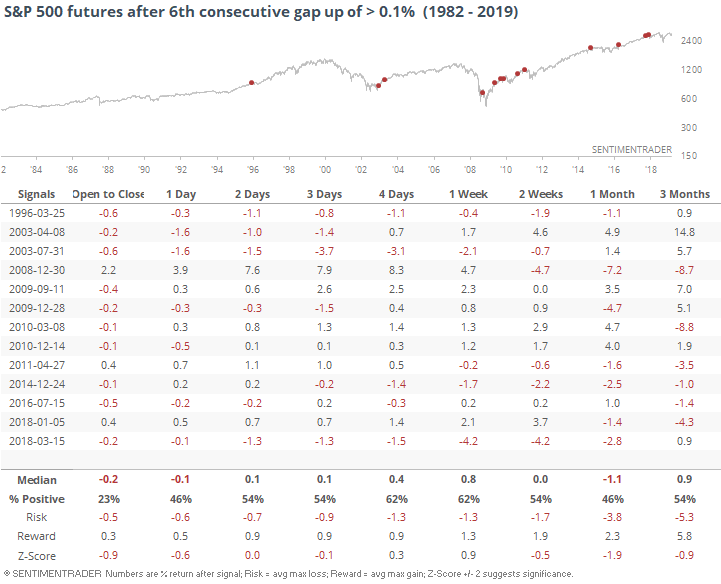
This will be the S&P's 6th consecutive day with a gap up opening of at least 0.1%.
It was tough for buyers to sustain this kind of opening enthusiasm in the very short-term, but wasn't much of a consistent sign after that.
Bond Flow
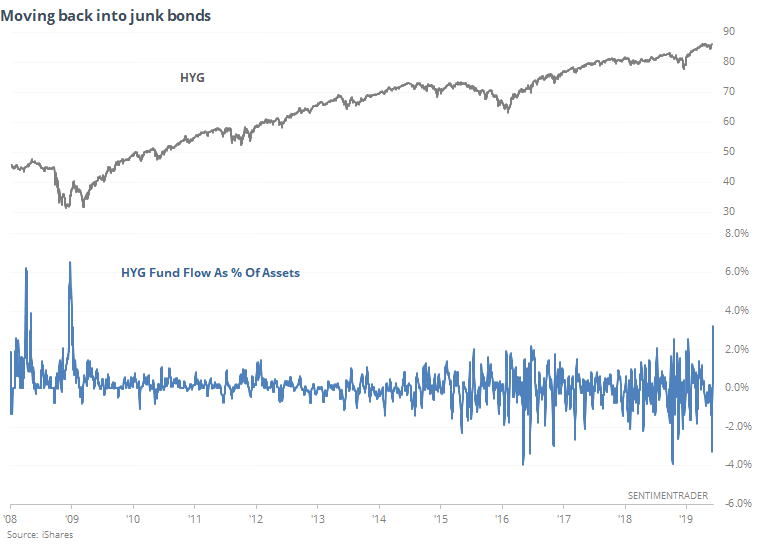
After pulling a near-record amount from high-yield bond funds, traders have moved back in to a record degree over the past five days. The HYG fund has seen an average inflow of nearly $500 per day over the past week, far surpassing any prior record.
As a percentage of assets, it's not a record, but is the highest since the bottom of the financial crisis. The fund hasn't suffered all that much volatility lately, but these kinds of asset swings have normally been seen after a period with wild swings and bottoming behavior.
It's happening in investment-grade bond funds, too, with LQD adding more than 1% to its assets on average each day for the past week.
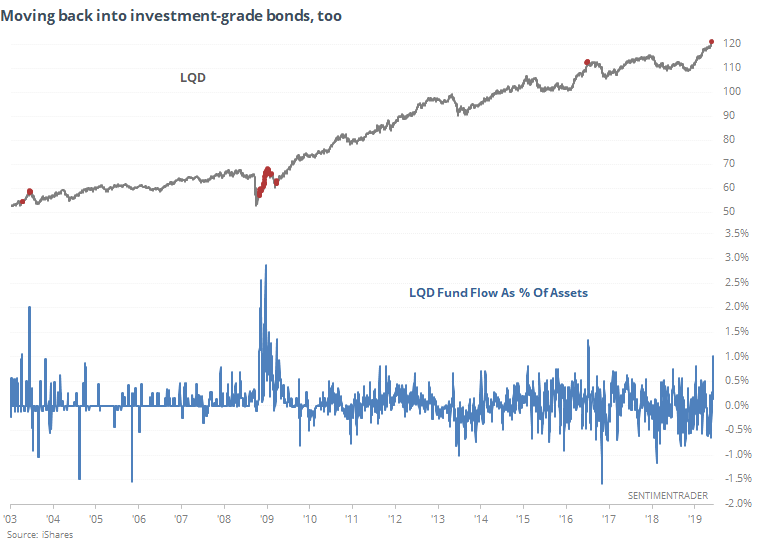
This happened near the peak in 2016, but also as bonds were bottoming at the end of the financial crisis. Tough to say what it likely means, but my take would be that since it's not happening after a period of extended volatility, and for LQD in particular it's occurring when bonds have had a rapid run, it's likely more negative than positive. Fund flows don't necessarily give a straight answer, but this looks a lot more like the peak in 2016 than the recovery from panic in 2008.
Weird Vol
There is some concern that despite stocks pressing continually higher, options traders are seeing "something". The VIX fear gauge isn't falling like it should be given the big move up in stocks. Volatility can rise when stocks do, but it's almost always the opposite.
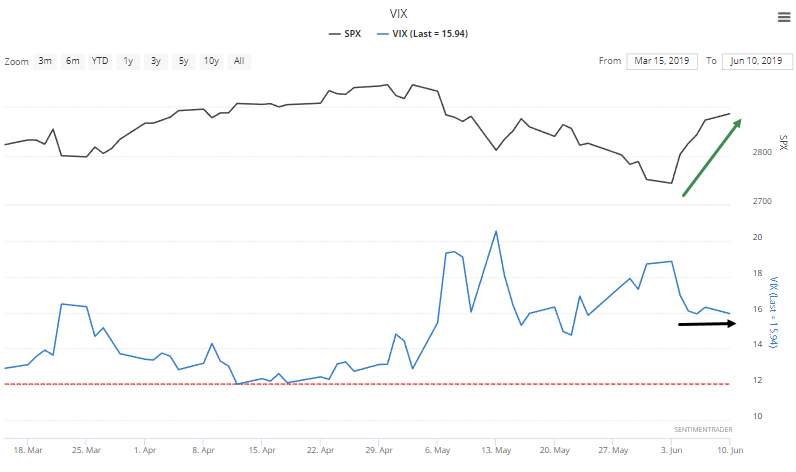
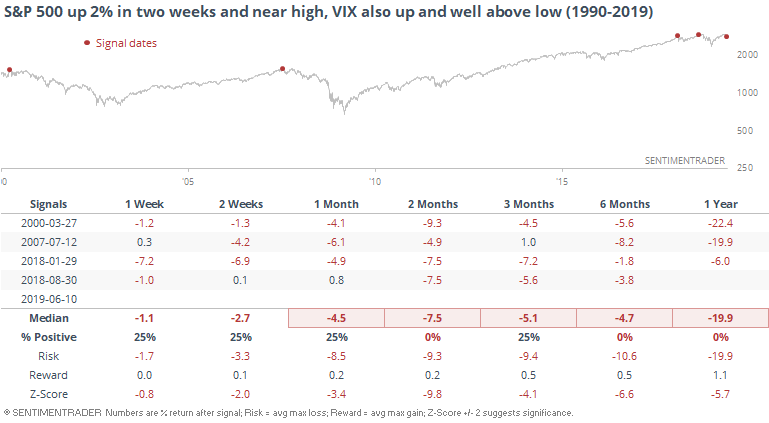
Over the past two weeks, we've seen the S&P 500 rally more than 2% and within 2.5% of its peak, while the VIX also rose and is more than 40% above its low. Those are very specific conditions, which is a caveat, but it is somewhat troubling that this was last seen at peaks in 2000, 2007, and twice in 2018.
But if we go back further, it was almost universally positive.
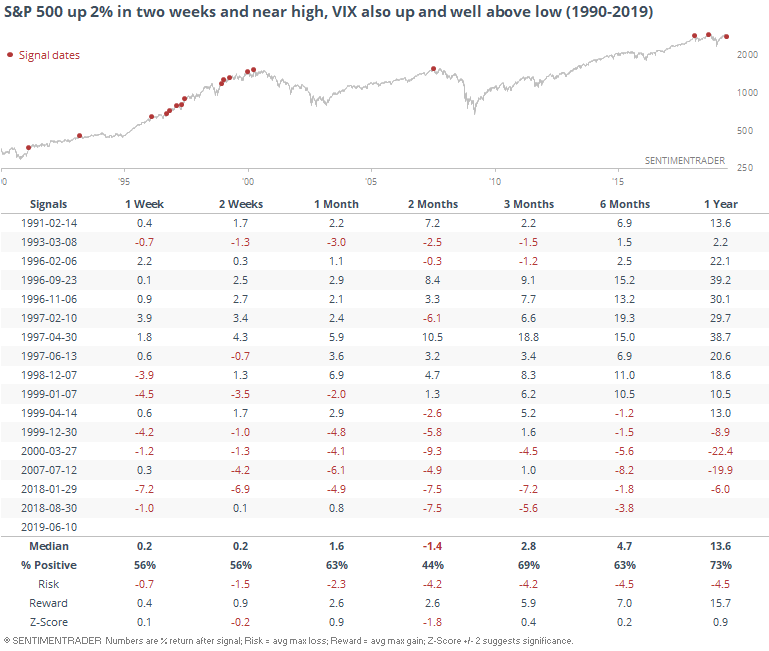
Not quite sure what to make of this. It could be a one-off thing due to the volatility surrounding the tariff threats, but it's still troubling that this occurred near those recent peaks. The fact that it wasn't at all negative prior to 2000 is something of a relief. I guess we'll have to see if the VIX continues to hold up in the coming day(s) even if stocks rally.
Breadth Concerns
Another concern is that the spike in new 52-week highs among S&P 500 stocks last week was dominated by defensive sectors. Per Bloomberg:
Stocks that made new highs last week came primarily from defensive sectors, such as utilities, real estate and consumer staples. Back in early 2018, it was technology and cyclical shares that dominated the list.
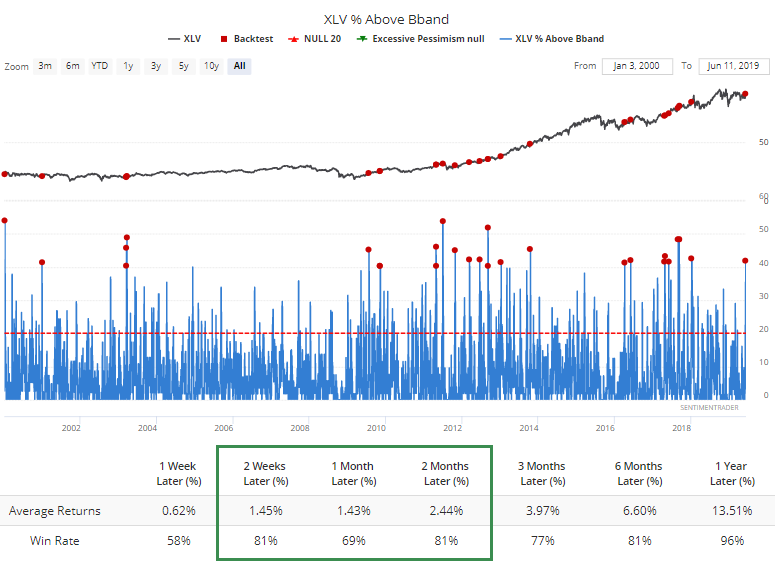
If we look for any day when more than 20% of S&P members hit a 52-week high and those new highs were dominated by defensive sectors (utilities, staples, and health care), then we can see that it wasn't necessarily a bad sign.
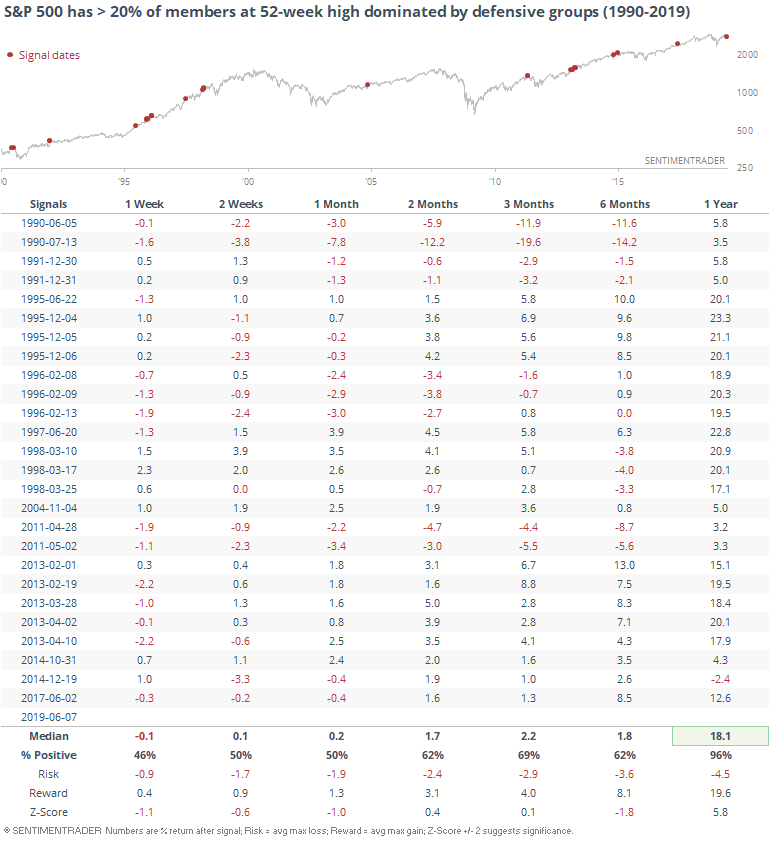
There were a lot more days (more than 80) when the new high list was dominated by non-defensive groups...and the S&P's returns after those days were poorer than when the defensive groups were leading.
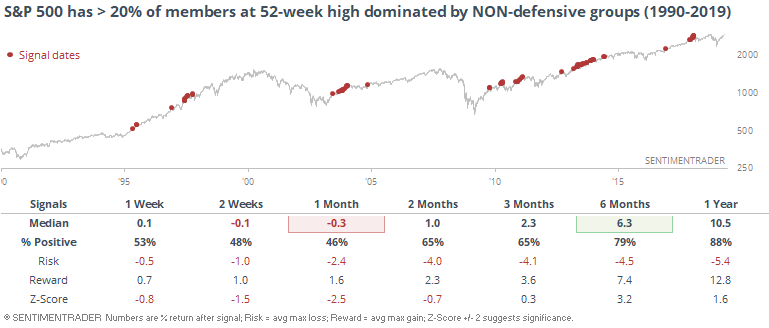
This doesn't look like a valid, or at least consistent, reason to worry.
Some of those defensive groups, especially staples and utilities, have a very strong tendency to struggle in the weeks following broad surges, as we saw from the Backtest Engine yesterday. Health care stocks have also jumped, but by one metric at least, haven't had the same kind of tendency to pull back immediately. It was more of a good sign of momentum.