TSLA Yes, TSLA No, TSLA Maybe
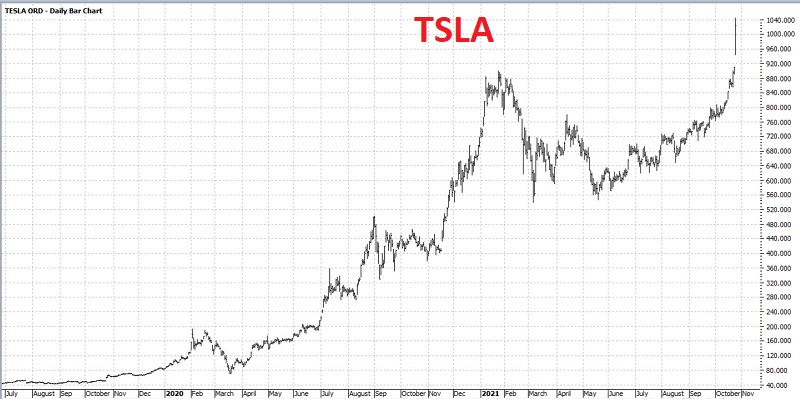
Trading opportunities - like beauty - are in the eye of the beholder. Take TSLA (Tesla), for instance.
One trader will look at the daily chart below (courtesy of ProfitSource) and see a stock that has just launched into the next massive up leg. Another trader will look at the same chart and see a stock that could reverse very quickly.
 Who will be right, and who will be wrong? It beats me. But whatever happens, there is opportunity at the moment.
At the same time, the problem for many traders is that TSLA is trading at over $1,000 a share. So, to buy 100 shares of stock requires a commitment of at least $100,000. Likewise, selling short 100 shares of TSLA would involve a hefty sum of margin (not to mention the assumption of unlimited risk). The explosive price action combined with the high stock price likely explains the massive trading volume in TSLA options of late (over 3 million options traded on both 10/25 and 102/26).
So, let's consider alternatives for both a bullish and a bearish scenario. From there, we will combine the two to create an example position that will - hopefully - offer a high probability of profit.
We will look at a bullish call calendar spread and a bear put calendar spread for this piece. As always, the examples that follow are just that - examples - and NOT "recommendations." Please also note that these examples were created using daily closing prices from Monday, 10/25/2021. By the time you read this, prices may be significantly different.
A GLIMPSE AT VOLATILITY
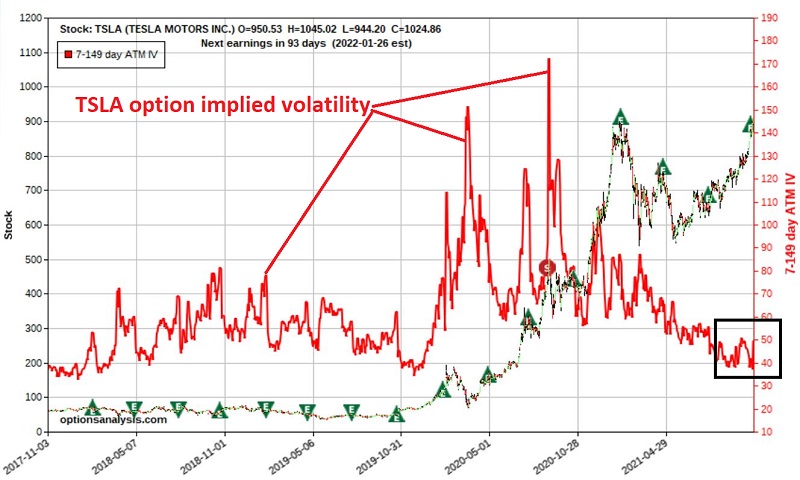
The chart below displays a 5-year price chart for TSLA and the implied volatility changes (red line) for TSLA options. It would seem that the only thing more volatile than TSLA stock is the volatility of TSLA options.
 THE SHORT LESSON ON IMPLIED VOLATILITY
Implied volatility tells us generally how much time premium is built into the price of the options for a given security:
- High IV = A lot of time premium, i.e., option prices are "expensive," i.e., a good time to sell premium
- Low IV = Little time premium, i.e., option prices are "cheap," i.e., a good time to buy premium
- In between = You make the call
As you can see in the chart above, IV (red line) of late has been on the low end of the historical range. This would seem to argue that this is a favorable time to consider a strategy that"
- Buys premium
- Can benefit from an increase in implied volatility
TSLA YES
Our example bullish trade involves:
- Buying 1 TSLA Nov19 1175 call @ $17.45
- Selling 1 TSLA Nov05 1175 call @ $10.07
The particulars and risk curves appear in the screenshots below (courtesy of Optionsanalysis).

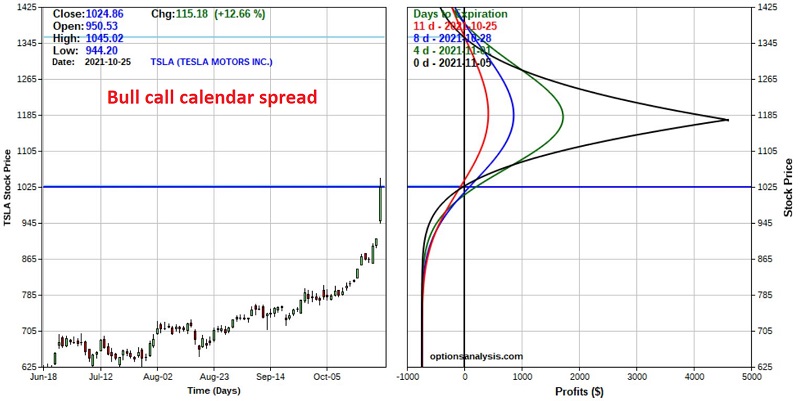
This trade profits if TSLA rises into and remains within a particular price range through Nov05 expiration.
Things to note:
- At the time of entry, this trade has 11 days left until Nov05 expiration
- Buying a 1-lot gives this trade a delta of 4.85. This means that (for now) this position will behave like a position holding roughly 5 shares of TSLA.
- The cost to enter this trade is $738 versus $5,125 to buy 5 shares of TSLA stock.
- The maximum profit potential is approximately $4,627 if TSLA is at $1175 a Monday share at Nov05 option expiration (this number could rise if option implied volatility increases or decline if option implied volatility decreases).
- The maximum risk is -$738 (if TSLA plummets or soars before Nov05 expiration).
- If volatility remains unchanged at November options expiration, this trade will show a profit if TSLA is between $1,027 and $1,358 a share.
Now let's talk real-world trading.
A trader might consider this trade if they expect:
- TSLA to keep trending higher in the short-term
The goal is for TSLA to remain within the profit range and for time decay to eat away at the price of the Nov05 calls while the Nov19 call held long retains more of its time value.
To witness the effect of time decay on this position, note how each of the colored lines moves to a higher profit level within the profit zone of $1,027 and $1,358 in the risk curve chart above.
A trader might resolve to:
- Either cut their loss if TSLA stock reverses and drops OR simply hold on until Nov05 expiration, content to risk $738
- Take a profit if TSLA stock approaches the $1175 level (i.e., at the point where the risk curves would begin to "rollover")
TSLA NO
Our example bearish trade involves:
- Buying 1 TSLA Nov19 875 put @ $11.77
- Selling 1 TSLA Mar05 875 put @ $4.72
The particulars and risk curves appear in the screenshots below (courtesy of Optionsanalysis)
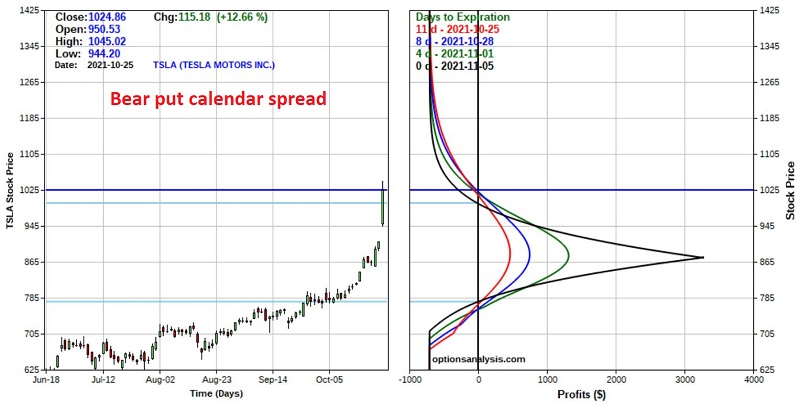 This trade profits if TSLA declines into and remains within a particular price range through Nov05 expiration.
Things to note:
- At the time of entry, this trade has 11 days left until Nov05 expiration
- Buying a 1 lot gives this trade a delta of -5.01. This means that (for now) this position will behave like a position holding short 5 shares of TSLA.
- The maximum profit potential is approximately $3,307 if TSLA is at $875 a share at Nov05 option expiration (this number could rise if option implied volatility increases or decline if option implied volatility decreases).
- The maximum risk is -$705 (if TSLA plummets or soars before Nov05 expiration).
- If volatility remains unchanged at November options expiration, this trade will show a profit if TSLA is between $777 and $996 a share
Once again, let's talk real-world trading.
A trader might consider this trade if they expect:
- A quick reversal in the price of TSLA
The goal is for TSLA to remain within the profit range and for time decay to eat away at the price of the Nov05 put while the Nov19 puts held long retain more of their time value.
To witness the effect of time decay on this position, note how each of the colored lines moves to a higher profit level within the profit zone of $777 and $996 in the risk curve chart above.
A trader might resolve to:
- Cut a loss if TSLA stock moves a certain level higher and/or a loss of a specific predetermined "uncle" point is reached.
- Take a profit if TSLA stock approaches the $875 level (i.e., at the point where the risk curves would begin to "roll over."
TSLA MAYBE
One other possibility is to enter BOTH trades simultaneously. The (rather odd-looking) risk curve at Nov05 expiration for the combined trade appears below.
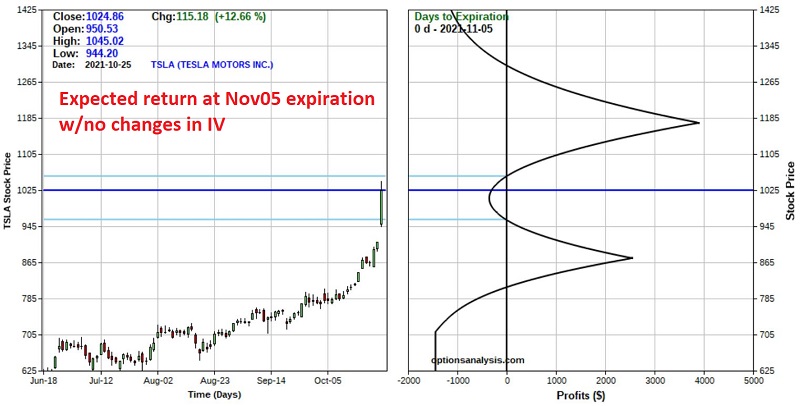 The chart assumes no change in implied volatility (which would affect the price of the Nov19 options). As you can see, for a profit on 11/5, TSLA would have to be:
- Above $1,056 and below $1,302
- OR
- Below $960 and above $812
In real-world trading, most traders would likely take a slightly different approach than simply waiting around for Nov05 expiration.
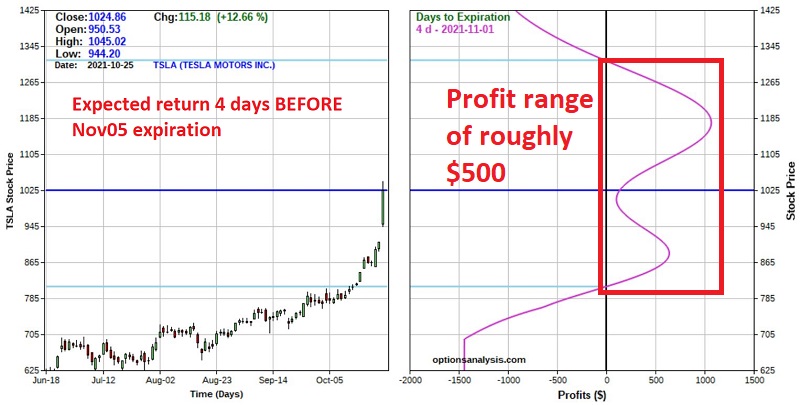
The chart below displays the expected risk curve 4 DAYS before Nov05 expiration (again assuming no changes in IV).
At the same time, the trader must develop a contingency plan in case price moves outside of the profitable range. The basic choices are:
- Cut a loss at a specific dollar amount
- Adjust the trade somehow
- Let it ride until expiration
THE ROLE OF IMPLIED VOLATILITY ON A CALENDAR SPREAD
There is another reason a trader might opt for one of the calendar spread example trades detailed above: If they expect (or simply want to make a play in anticipation of) higher implied volatility.
The Short Lesson:
- Because it reaches expiration earlier and because time decay accelerates as expiration nears, the short option in a calendar spread will lose its time premium much more quickly than the long option
- By the time the short option expiration is reached, the short option will lose ALL of its time premium, while the long option will still retain some of its time premium
- Changes in implied volatility will affect the long option much more than they will affect the short option
Therefore a RISE in IV after a calendar spread is entered can inflate the profit potential for the trade. Why? Because:
- The long option will gain time premium due to the increase in IV
- While the short option will still lose all of its time premium by the time it expires
Still with me? Good.
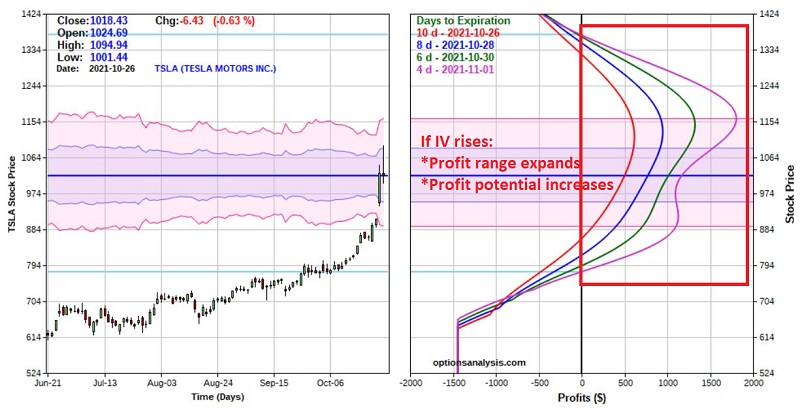
Let's look at what would happen if implied volatility on TSLA options rose 20% between the time of entry and 4 days before the expiration of the short option on Nov05.
In the previous risk curve chart 4 days before Nov05 expiration:
- The profit range was about $500 ($811 to $1313)
- The maximum expected profit on the upside was roughly $1,142
- The maximum expected profit on the downside was roughly $553
If IV rose 20%, the long Nov19 options would gain more time premium than the short Nov05 options, thus:
- The profit range would expand to roughly $594 (with breakeven prices of $778 to $1372)
- The maximum expected profit on the upside was roughly $1,806
- The maximum expected profit on the downside was roughly $1,129
The chart below displays the updated risk curves if IV rises 20%.


