
TSLA Naked Put Example

Key Points
Selling naked puts may afford an investor the opportunity to:
- Generate income from selling options
- Generate an above-average return on available cash
- Buy a stock at far below current market price levels
Overview
For the sake of example, let's assume that a trader has a favorable opinion of TSLA stock and is willing to buy shares, but either doesn't want to buy at the current price level or does not have enough cash to buy at the current price (as this is written the cost to buy 100 shares of TSLA is roughly $63,000).
Let's look at an example of how the trader can sell a "naked put" and either a) generate above-average income on cash on hand and/or b) buy the stock at a price roughly 40% below the current market price.
TSLA Naked Put
On June 16:
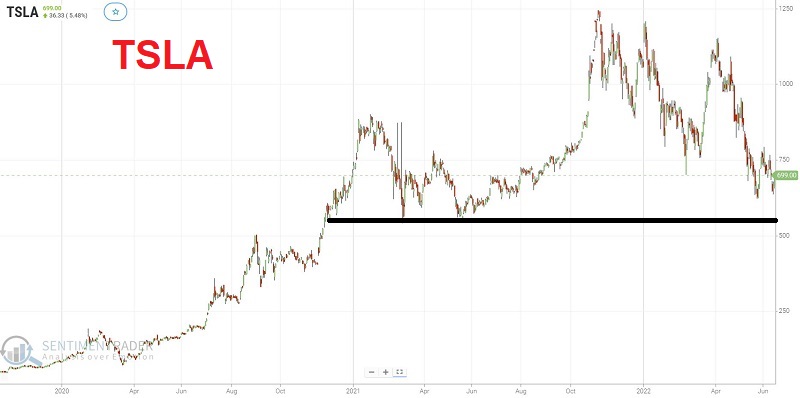
•Shares of Tesla Motors (TSLA) traded at $629.75 a share, down from a high above $1,240 in November 2021
•The stock has support near $539
•The implied volatility for TSLA options has risen to a high level. This high IV means that there is a lot of time premium built into the price of TSLA options (all charts and figures below are courtesy of Optionsanalysis)
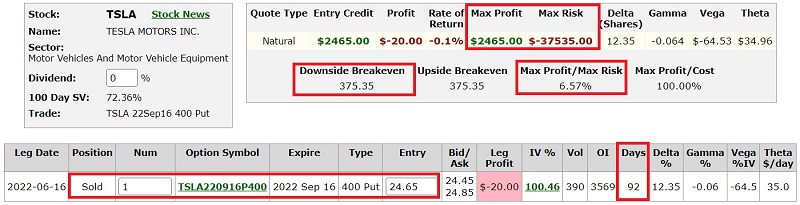
•At this time, the September 2022 400 strike price put (which was 36% below the price of the stock) could be sold for $24.65 apiece.
•There are 92 days left until option expiration.
To enter the naked put position, a trader must have enough cash to buy 100 shares at the strike price of $400, less the option premium received. In other words, the trader would need $40,000 minus the $2,465 premium received for selling the put. The trader would have to put up $37,535 of their own cash.
The trade particulars appear below and the risk curves appear directly below that.
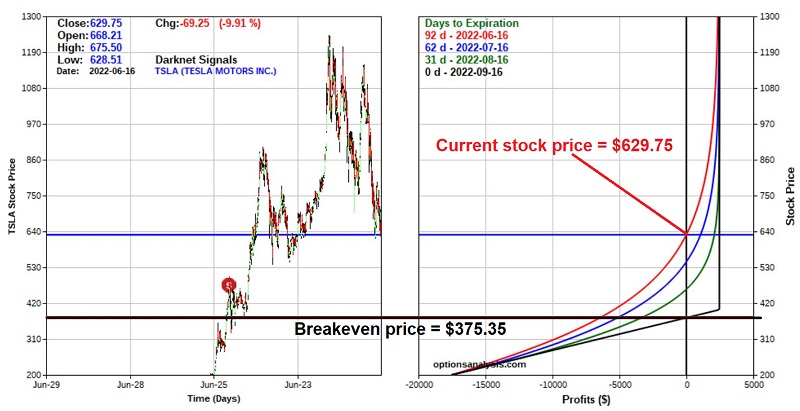
From here, there are essentially three potential outcomes.
Potential Outcome #1: The option expires worthless
If TSLA shares remain above $400 a share between now and the September options expiration date, the $400 strike price put option will expire worthless, and the trader will keep the premium of $2,465. In this case, the trader would earn 6.57% ($2,465 / $37,535) in 92 days.
For example, we will assume that a trader sells one put at $24.65. The maximum profit is $2,465, and the maximum risk (if TSLA shares are traded at $0) is $37,535.
Potential Outcome #2: The option is exercised at $400
If TSLA shares drop below $400 and the put option is exercised, the trader in this example will be required to buy 100 shares of TSLA stock at $400 a share. The share purchase cost is reduced by the $2,465 premium received when the put was originally sold. As a result, the trader in this example will own 100 shares of TSLA at an effective cost of $375.35 a share. From there, the trader must decide if they want to hold the shares or sell them.
Potential Outcome #3: The option premium declines, and the trader buys back the put before expiration
Let's say that one month goes by, and at that time, TSLA shares are unchanged at $629.75, but implied volatility has fallen from 100% to 70%. Under this scenario, the expected price for the September 2022 400 strike price put would be approximately $3.30 (due to one month of time decay plus the reduction in premium caused by the decline in implied volatility).
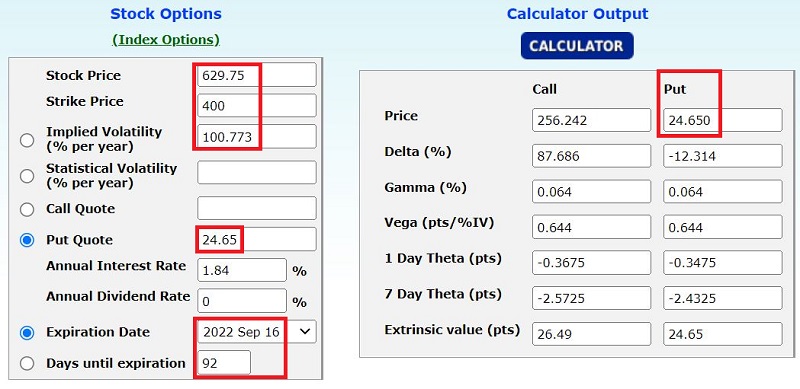
The figure below displays the option calculator on the day of entry.
The figure below displays the option calculator 31 days after entry and with IV down to 70% from 100%.
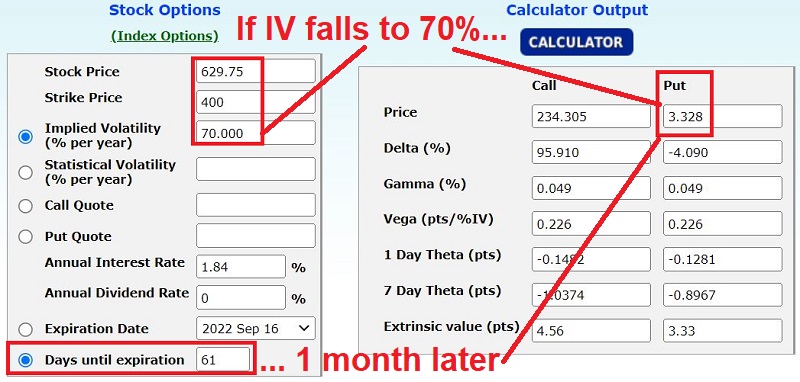
Under this scenario, the trader might decide to buy back the naked put at $3.30 and book a profit of $2,135 (or a gain of 5.7% in one month).
What the research tells us…
Selling naked puts is not for everyone. But for individuals with the right temperament and patience, it can be a helpful strategy that allows them to generate income on cash on a portfolio and/or to buy shares of stock at a lower price than currently available. The key to success with this strategy is to formulate a clear plan before entering any position and then stick to it.