Data &
Technology
Research
Reports
Report Solutions
Reports Library
Actionable
Strategies
Free
Resources
Simple Backtest Calculator
Simple Seasonality Calculator
The Kelly Criterion Calculator
Sentiment Geo Map
Public Research Reports
Free Webinar
Pricing
Company
About
Meet Our Team
In the News
Testimonials
Client Success Stories
Contact
Log inLoginSign up
< BACK TO ALL REPORTS

Trend indicators for the S&P 500 shift to a bullish status
Dean Christians
2023-11-20
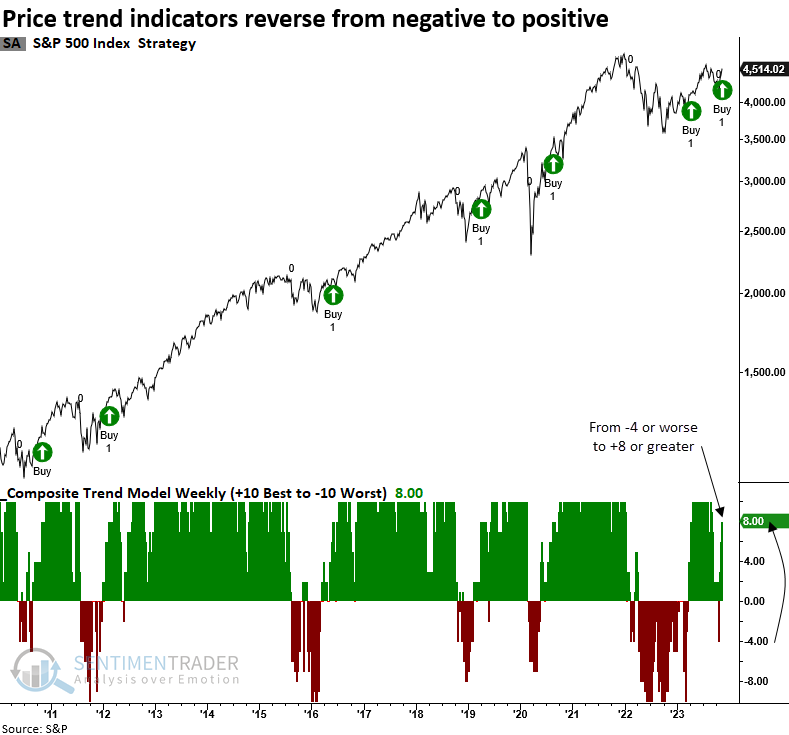
A composite that contains ten trend-following indicators cycled from a bearish to a bullish status, triggering a buy signal with a 90% win rate over the subsequent six months for the world's most benchmarked index.

Key points:

  • A composite that contains ten trend-following indicators cycled from negative to positive
  • Comparable reversals over the past 90 years preceded robust returns for the S&P 500 
  • Growth-oriented sectors consistently exhibit the highest composite trend scores

Trend-following indicators point toward a resumption of the uptrend

In April, I published a research note highlighting a bullish reversal for a composite that contains ten trend-following indicators. The shift in price trends provided a timely alert as the S&P 500 steadily rose over the following three months.

As the July to October drawdown persisted, the composite score steadily dropped, hitting the reset threshold at -4. However, since late October, the subsequent rebound in price trends propelled the trend score to +8, triggering a new buy signal.

The recent alignment of internal and external price trends paints an encouraging picture for the seasonally strong months of November and December.

How I construct the weekly composite trend model 

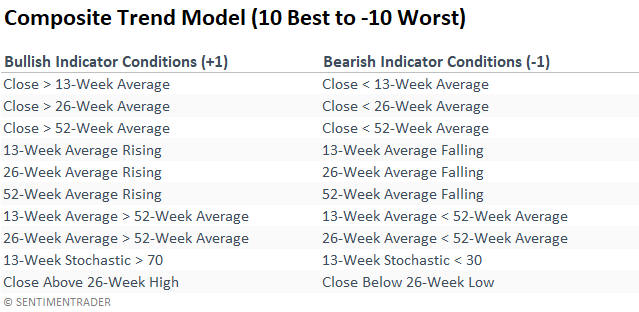
The composite assigns an individual score of +1 or -1 to each component in the model based on the following conditions.
Similar reversals preceded outstanding results

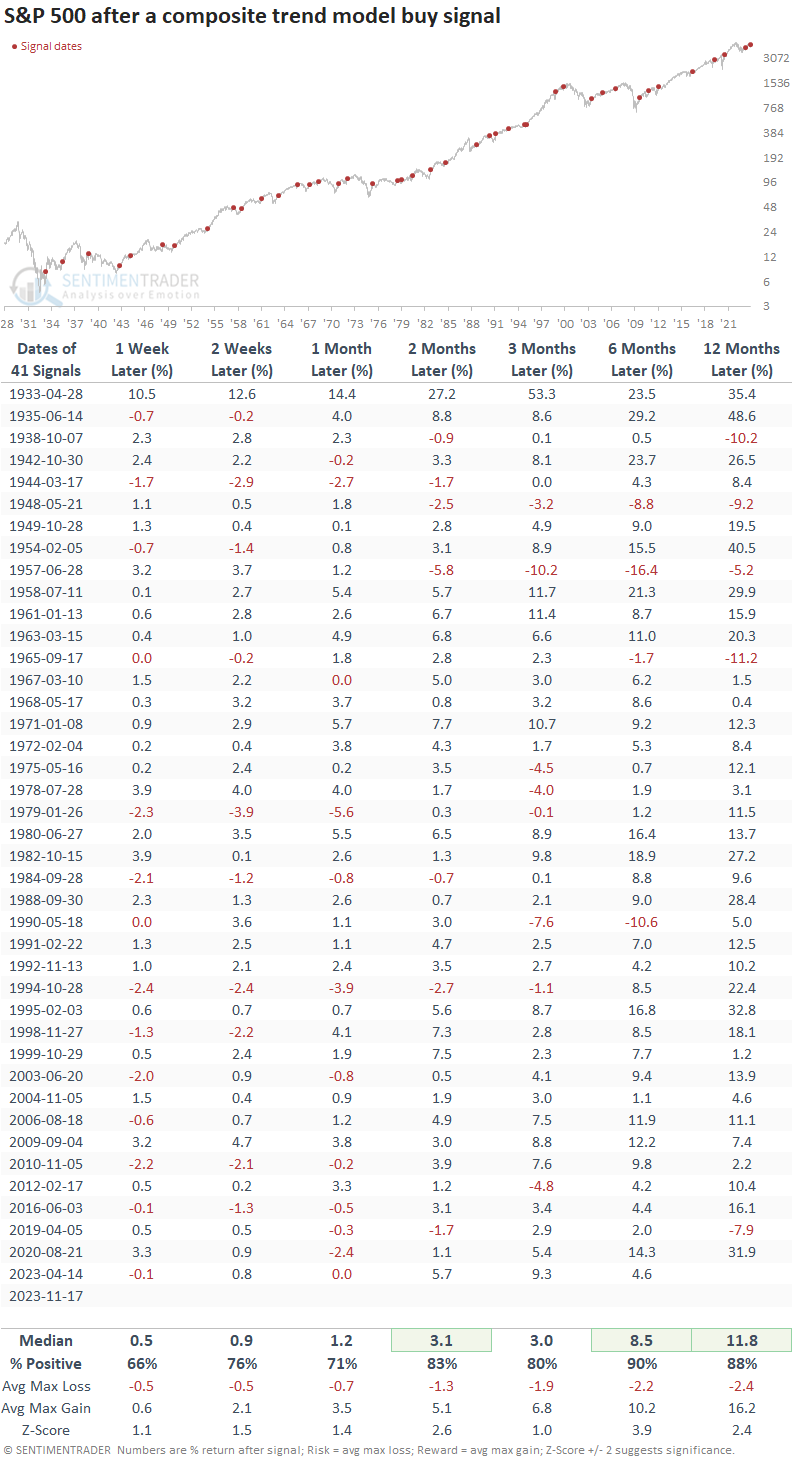
When the composite trend model cycled from -4 or worse to +8 or better, the S&P 500 rose 90% of the time over the subsequent six months.

The previous signal in April saw the S&P 500 struggle in the first month, with a max loss of -2%. Sometimes, a trend change shift leads to a short-term pause. However, that precedent recovered nicely, with a max gain of 10.9% over the following six months.
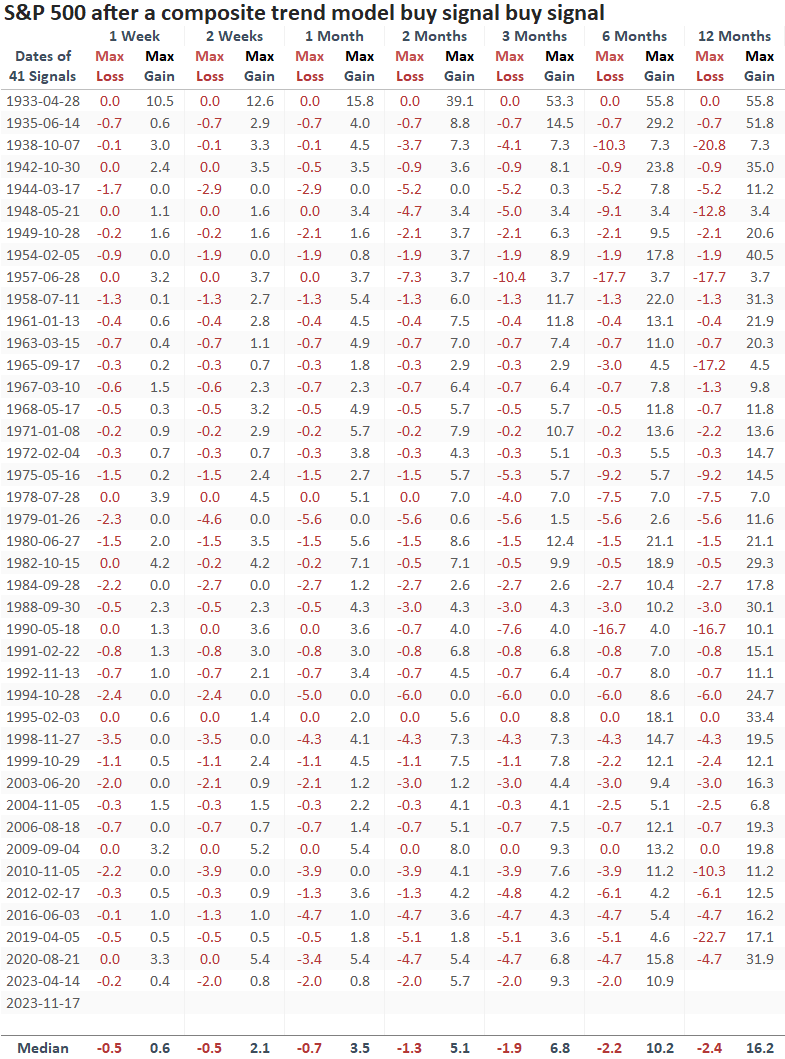
The skew between the median max gain and loss overwhelmingly favors the bullish case across all time frames, and the number of 10%+ drawdowns over the subsequent six and twelve months was minimal, with only three and seven precedents.
Sector trend scores 

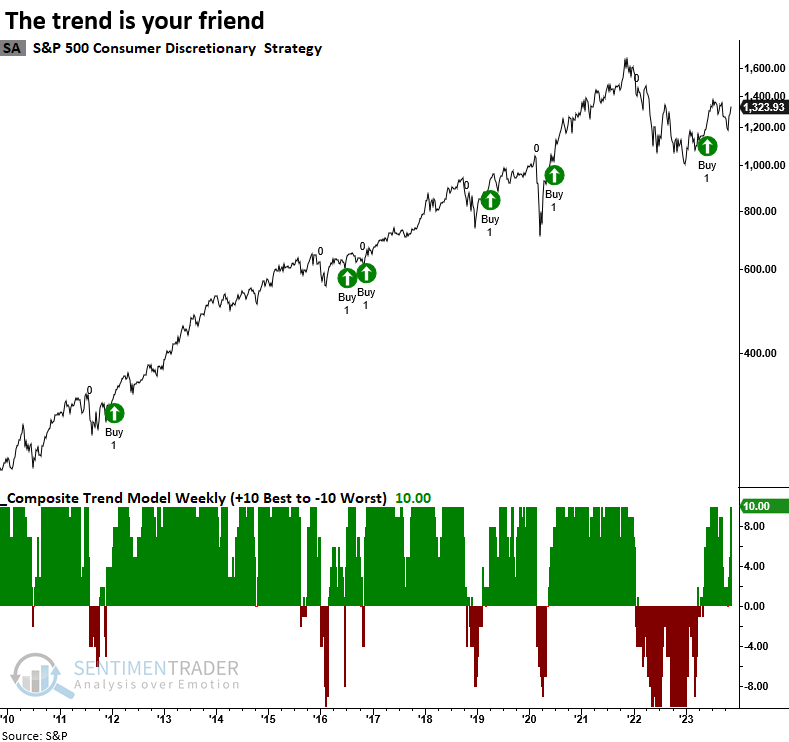
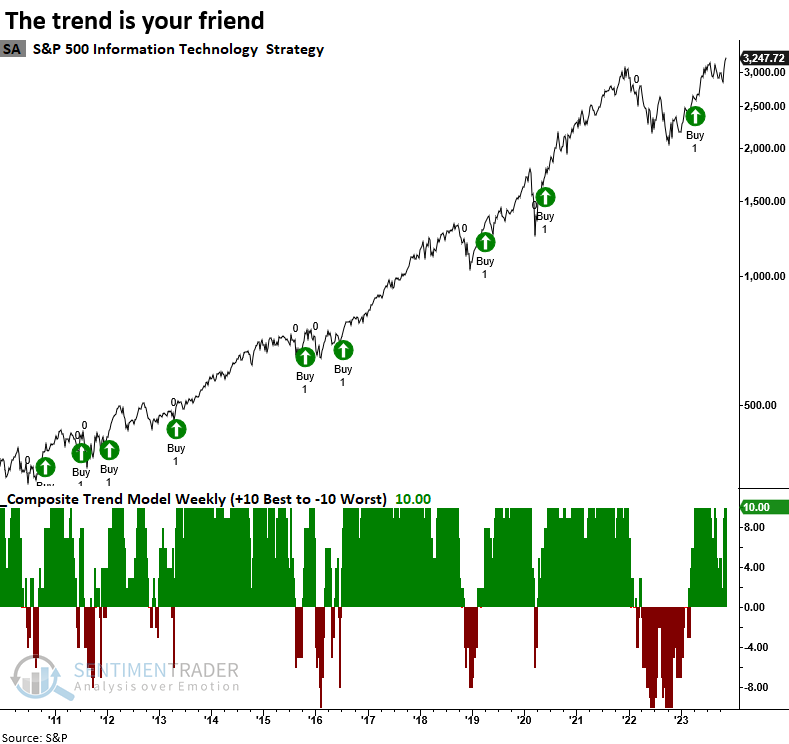
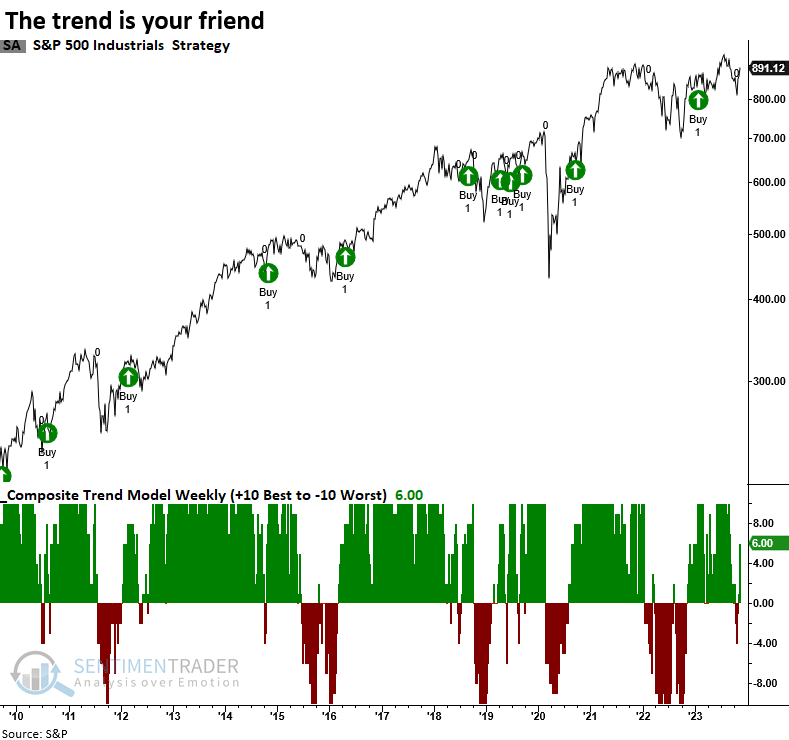
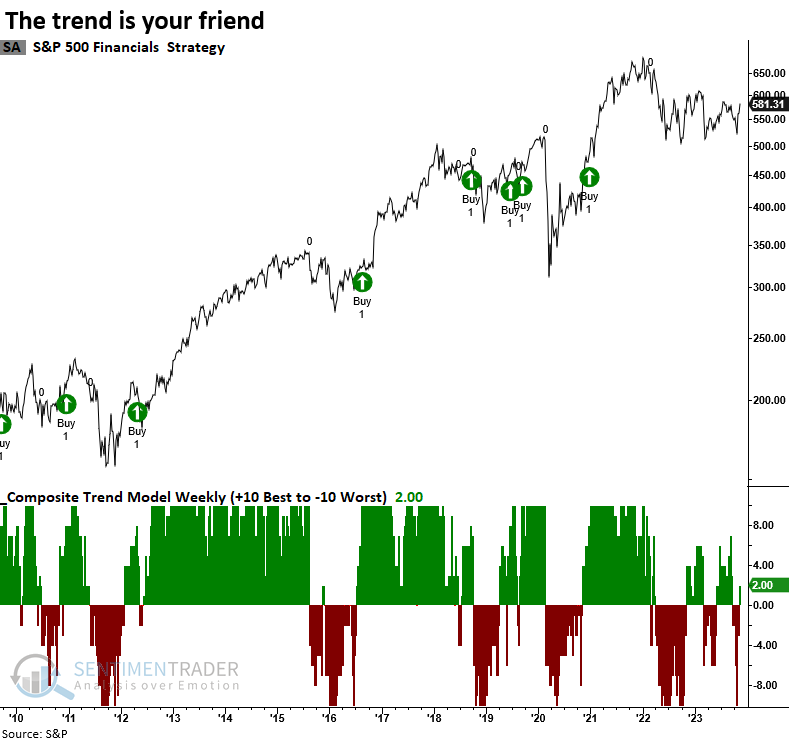
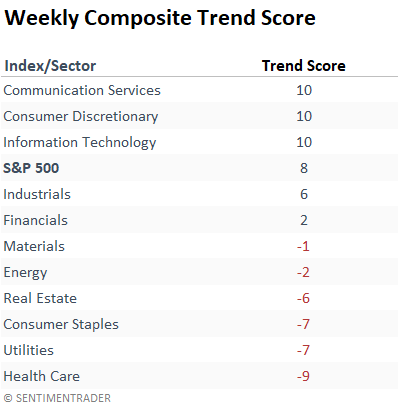
Trend scores for S&P 500 sectors overwhelming favor growth-oriented groups. In contrast, defensive and commodity-related sectors suggest a less favorable trend backdrop. 
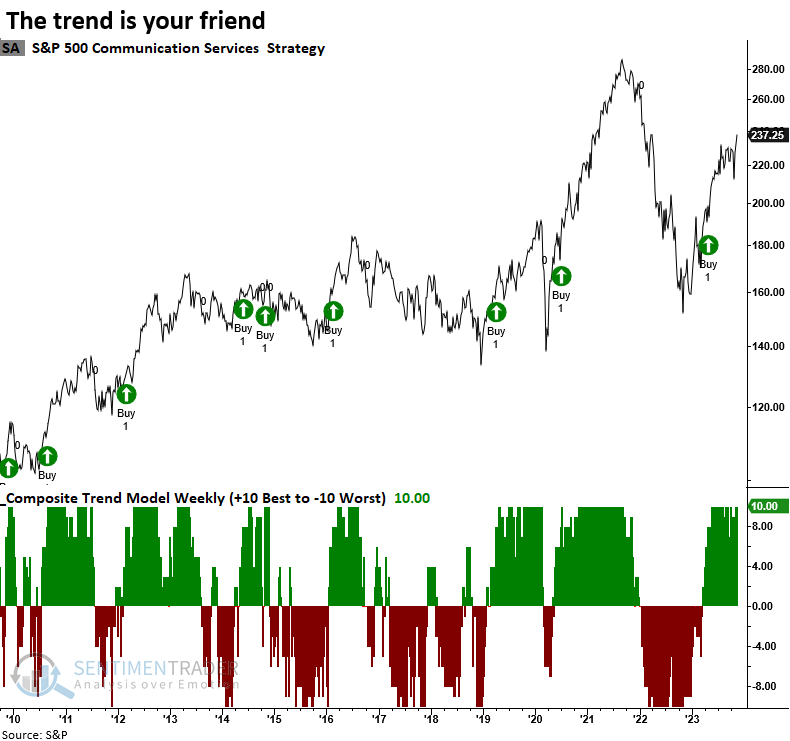
Charts for sectors with positive trend scores


What the research tells us...

A composite trend model for the S&P 500 reversed from negative to positive, triggering a buy signal for the world's most benchmarked index. Similar signals saw the S&P 500 rise 90% of the time over the following six months, including the most recent alert from April. Analyzing trend scores for sectors suggests a more favorable environment for growth-oriented groups.

Sorry, you don't have access to this report

Upgrade your subscription plan to get access
Go to Dasboard
DATA &
TECHnologies
IndicatorEdge
‍
BackTestEdge
‍
Other Tools
‍
DataEdge API
RESEARCH
reports
Research Solution
‍
Reports Library
‍
actionable
Strategies
Trading Strategies
‍
Smart Stock Scanner
‍
FREE
RESOUrCES
Simple Backtest
Calculator
Simple Seasonality
Calculator
The Kelly Criterion
Calculator
Sentiment Geo Map
‍
Public Research Reports
‍
Free Webinar
COMPANY
‍
About
‍
Meet our Team
‍
In the News
‍
Testimonials
‍
Client Success Stories
Pricing
Bundle pricing
‍
Announcements
‍
FAQ
© 2024 Sundial Capital Research Inc. All rights reserved.
Setsail Marketing
TermsPrivacyAffiliate Program
Risk Disclosure: Futures and forex trading contains substantial risk and is not for every investor. An investor could potentially lose all or more than the initial investment. Risk capital is money that can be lost without jeopardizing ones’ financial security or life style. Only risk capital should be used for trading and only those with sufficient risk capital should consider trading. Past performance is not necessarily indicative of future results.

Hypothetical Performance Disclosure: Hypothetical performance results have many inherent limitations, some of which are described below. No representation is being made that any account will or is likely to achieve profits or losses similar to those shown; in fact, there are frequently sharp differences between hypothetical performance results and the actual results subsequently achieved by any particular trading program. One of the limitations of hypothetical performance results is that they are generally prepared with the benefit of hindsight. In addition, hypothetical trading does not involve financial risk, and no hypothetical trading record can completely account for the impact of financial risk of actual trading. for example, the ability to withstand losses or to adhere to a particular trading program in spite of trading losses are material points which can also adversely affect actual trading results. There are numerous other factors related to the markets in general or to the implementation of any specific trading program which cannot be fully accounted for in the preparation of hypothetical performance results and all which can adversely affect trading results.

Testimonial Disclosure: Testimonials appearing on this website may not be representative of other clients or customers and is not a guarantee of future performance or success.