
Treasury yields are breaking out across the curve

Key points:
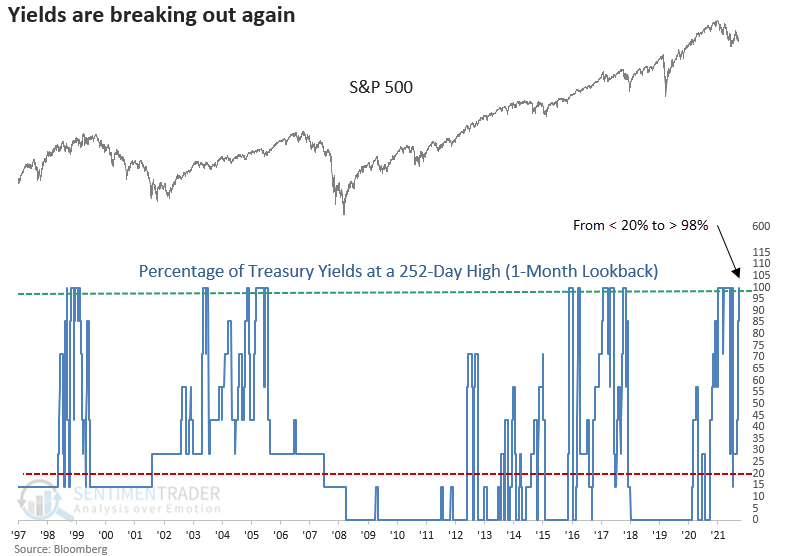
- The percentage of treasury yields at a 252-day high surged to 100% on Monday
- After similar breakouts, stocks showed negative returns up to 3 months later
- Commodities and gold were flat to negative, while the 10-year yield increased and the curve collapsed
Bond yields across the curve are breaking out
Yields are rising again, and other asset classes don't like the competition from bonds.
On Monday, Treasury yields ranging from 6 months to 10 years closed at a new 252-day high. The breakout in yields occurred after an easing in rates, which helped to fuel the significant rally in stocks from the June low.
A model that measures the percentage of Treasury yields closing at a 252-day high within the past month cycled from < 20% to > 98%, triggering a new signal.
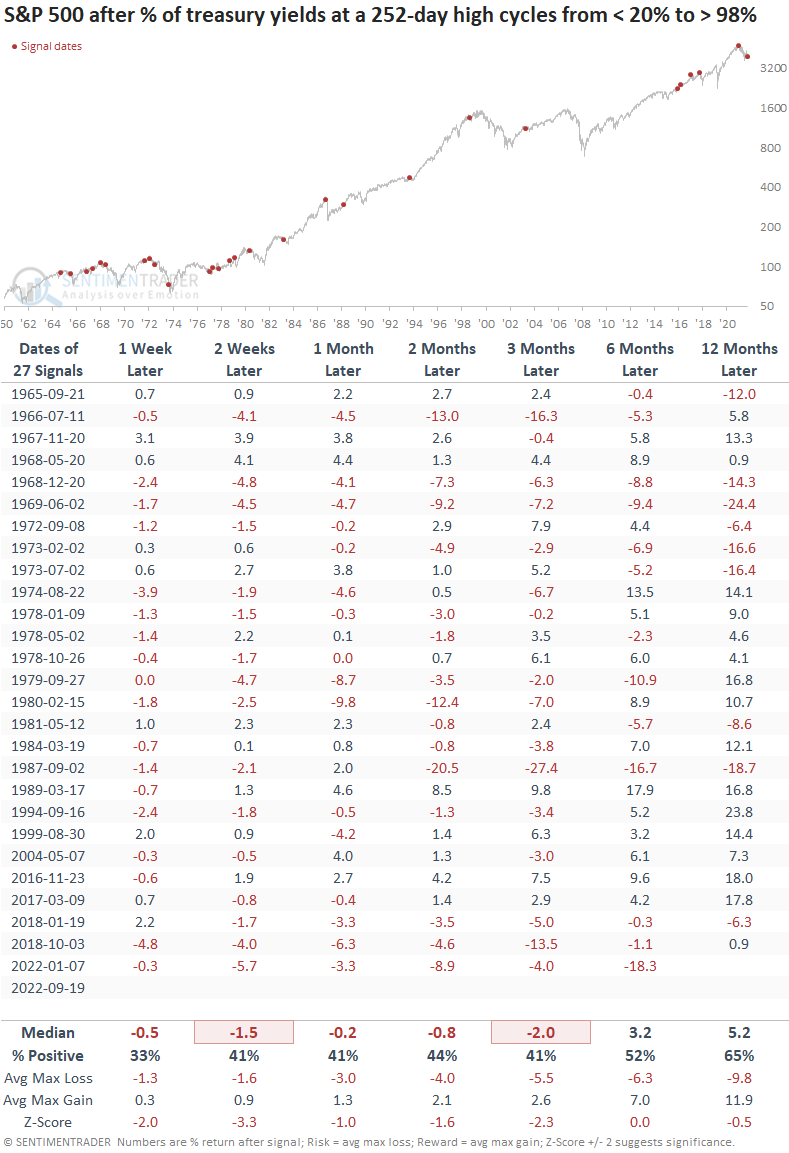
Yield breakouts preceded negative returns for stocks, valuations
The yield breakout looks unkind to stocks, with negative returns across all time frames up to three months later. Since 1974, stocks closed lower in 16 out of 18 cases in the first two weeks.
The new signal on Monday represents the second alert in the current bear market. One has to go back to 1973-74 to find two or more instances within the context of a bear market.
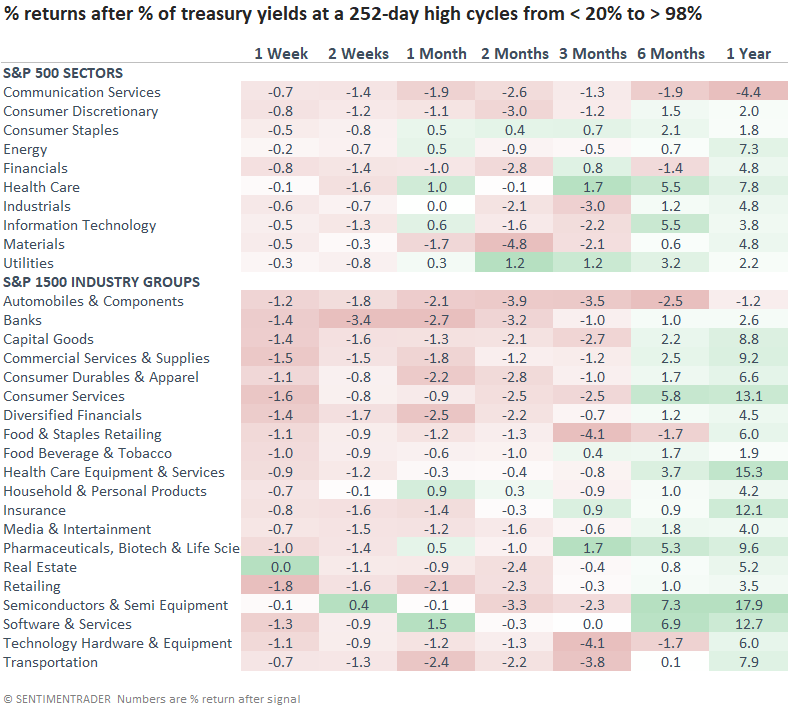
The sector and industry table shows almost nothing worked in the first few weeks. Defensive groups show some better performance starting a month after the signals. Not surprisingly, cyclical groups like consumer discretionary, financials, and materials were notable underperformers.
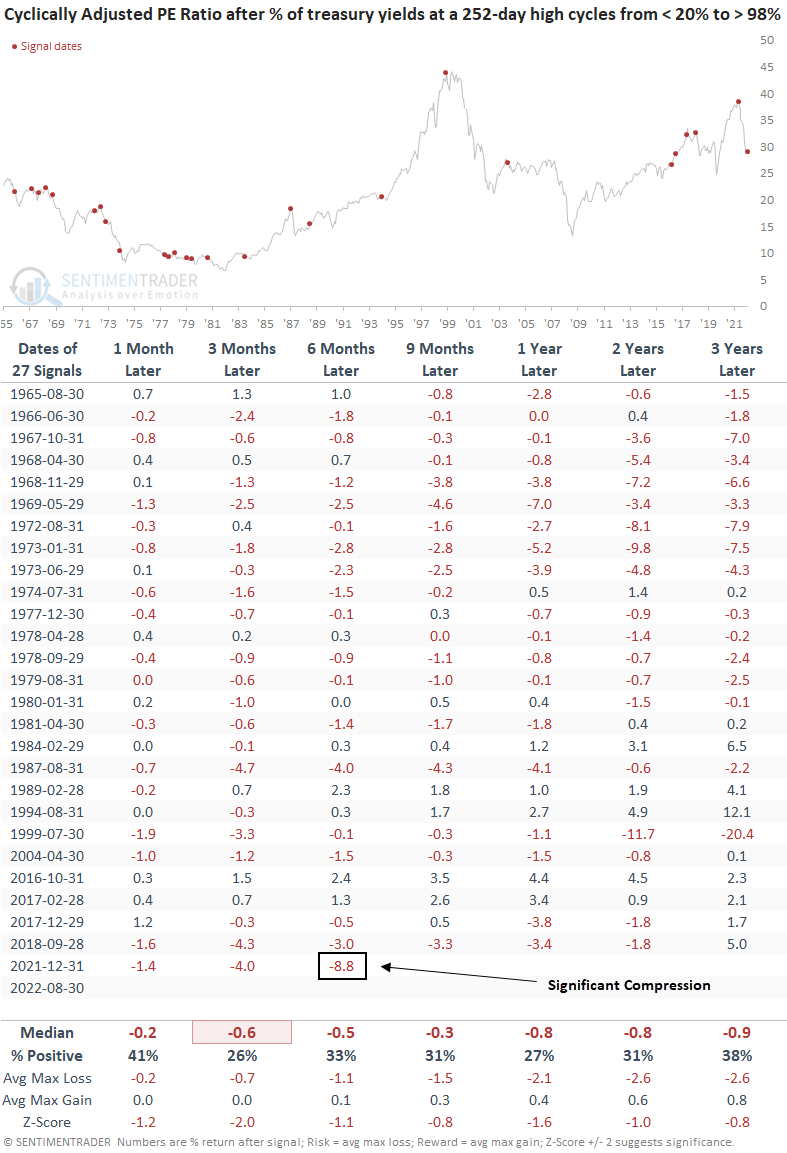
With treasury yields increasing from record lows to a more competitive level, it shouldn't be surprising to see a compression in price/earnings ratios. The prior signal from January shows the most significant contraction in Shiller's cyclically adjusted PE ratio (CAPE) in history over the next six months. The signal dates are adjusted to the prior month-end date for the CAPE data.
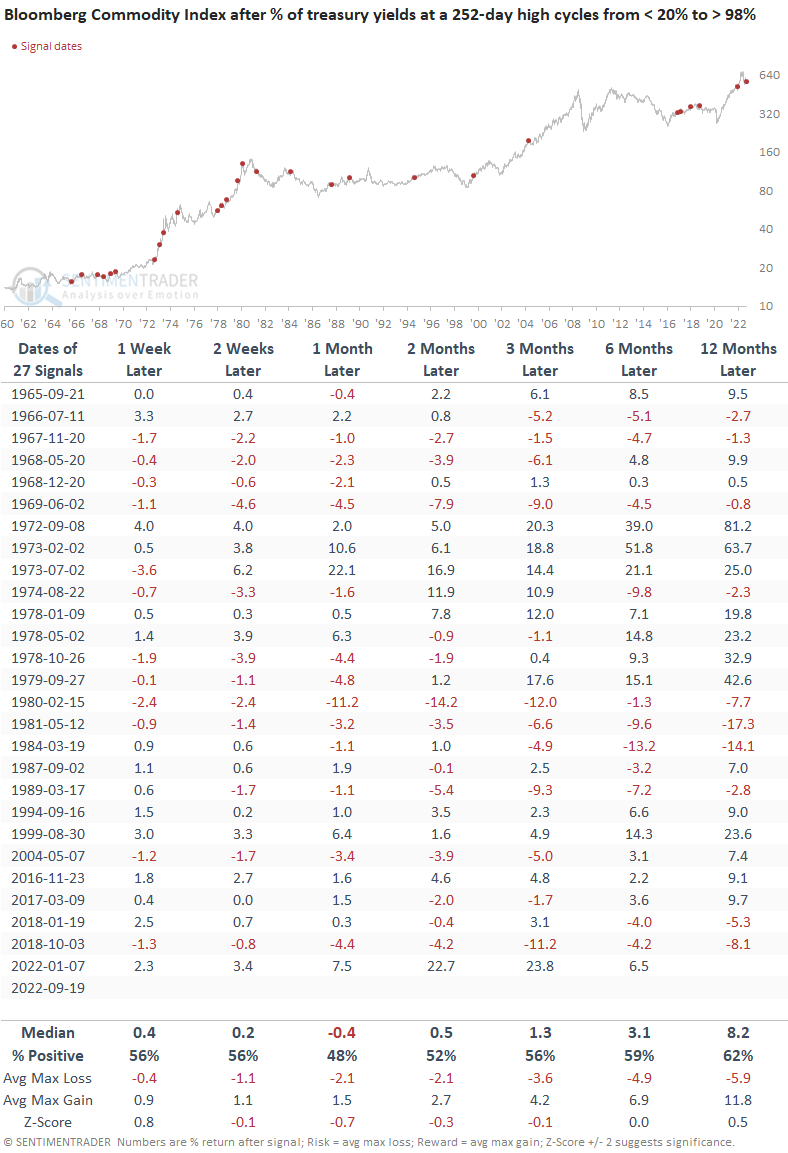
Broadly rising yields a challenge for commodities, especially gold
Similar to stocks, commodities struggled with mostly flat returns across the short- to medium-term. Interestingly, the prior signal from January 2022 shows some of the best historical returns in the first few months.
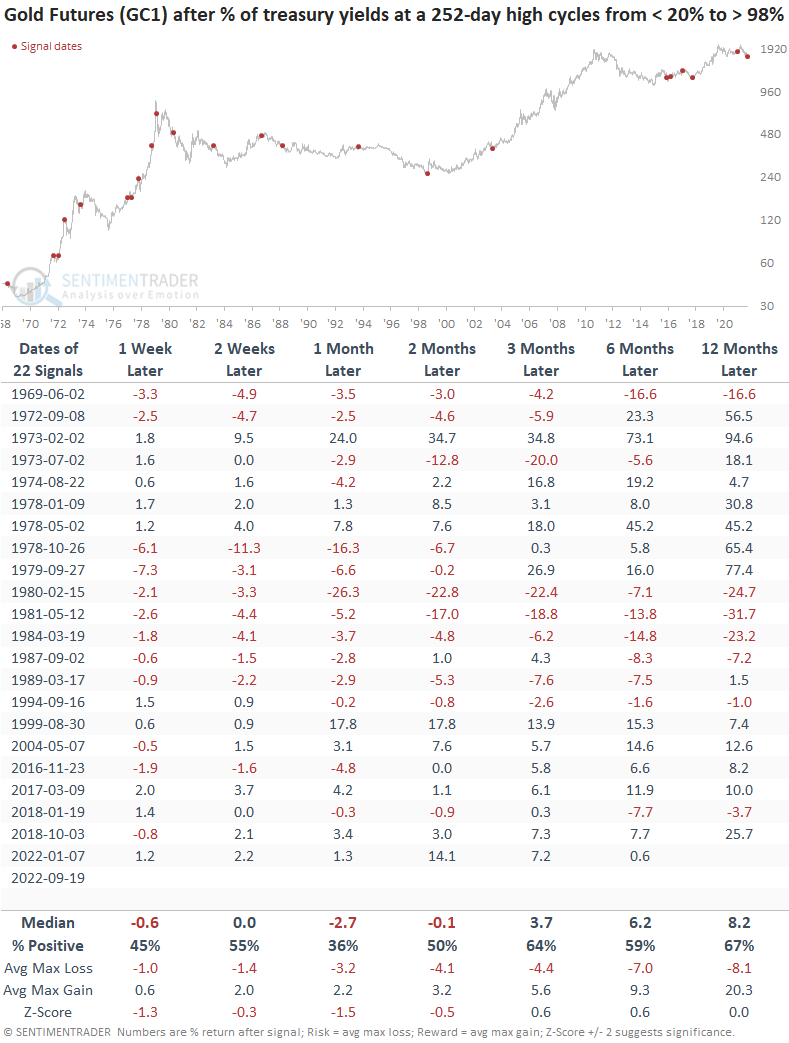
Gold struggled more than a broad basket of commodities, with negative returns in the first few months. More recent signals show a better return outlook starting in the 3-month window, with seven consecutive winners.
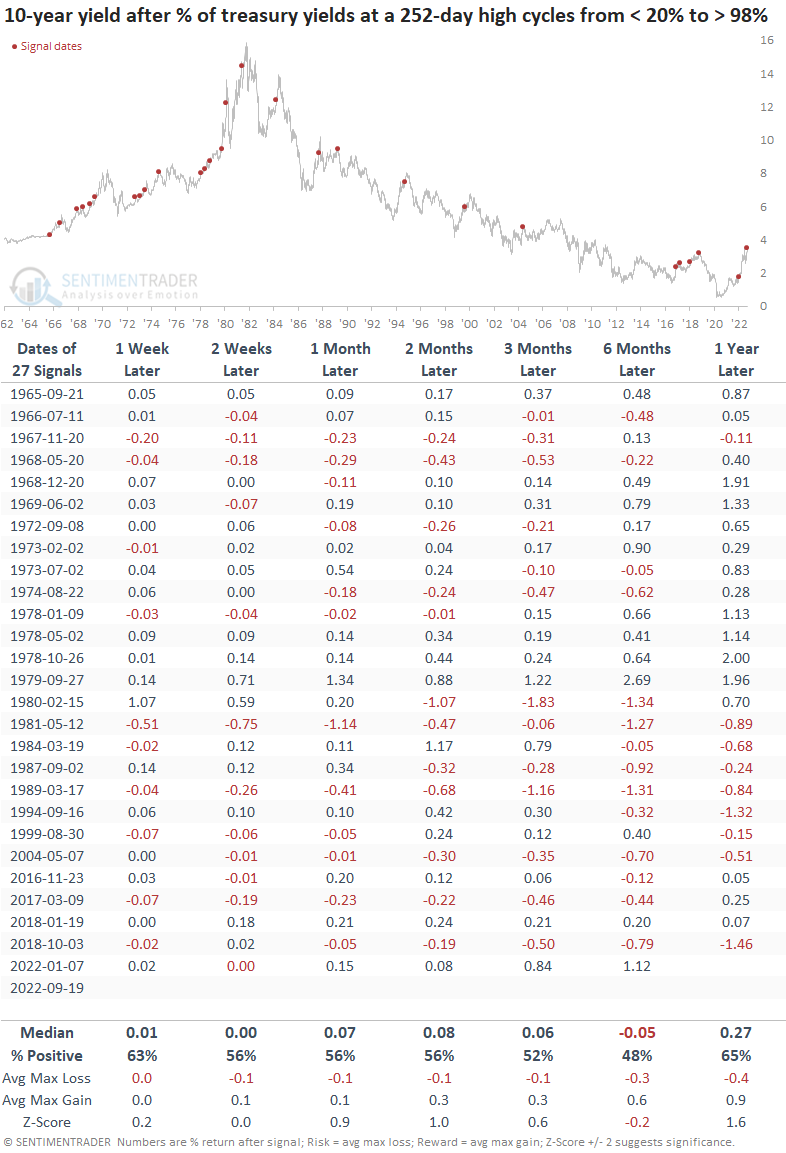
Bond yields may rise, but the curve could get flatter
The yield breakout looks like it will continue on an upward path for the next few months. As with most interest rate studies, the secular trend change in rates in 1981 influenced the overall outlook, especially for long-term horizons.
Edit: The original note showed a value in the 1-year later column for the 2022-01-07 signal. The error has been corrected.
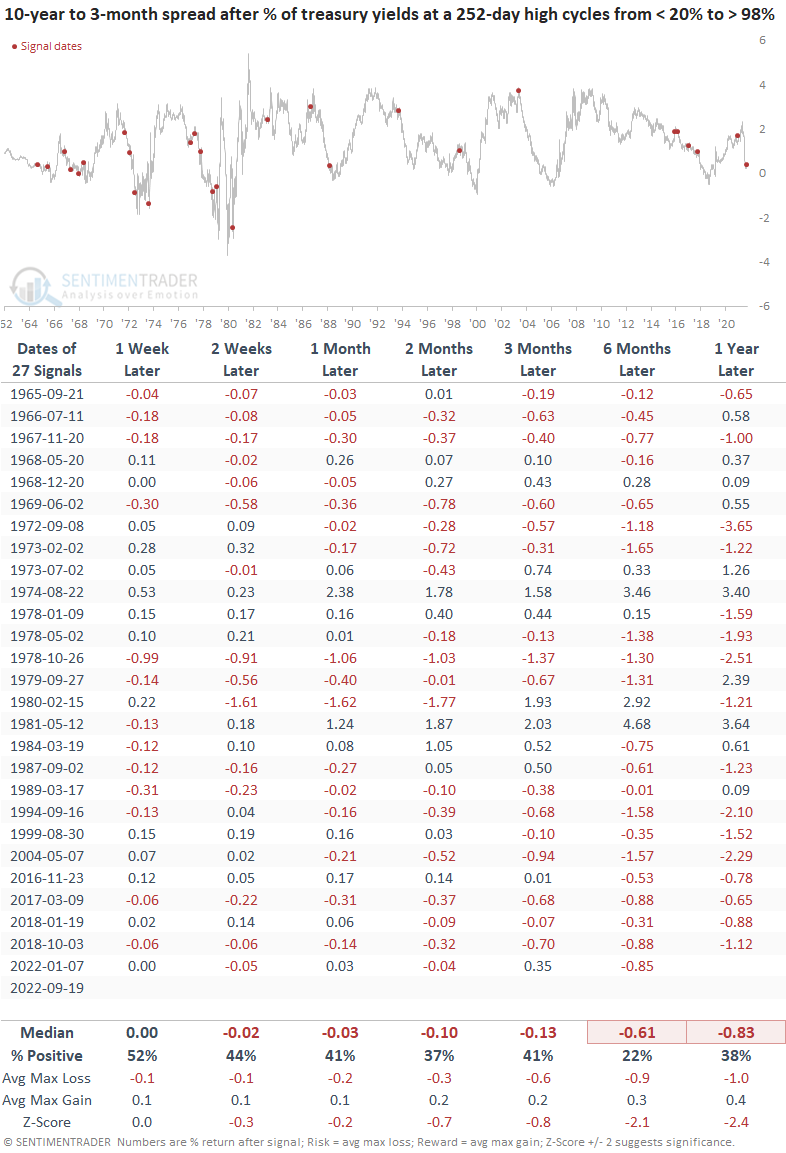
The 10-year to 3-month yield curve spread suggests the curve will contract, especially six months later. Since 1984, the curve has flattened for 11 consecutive signals.
Edit: The original note showed a value in the 1-year later column for the 2022-01-07 signal. The error has been corrected.
What the research tells us...
Treasury yields are registering new 252-day highs across the curve. A model which measures the curve breakout triggered an alert on Monday. After similar signals, stocks, commodities, and gold struggled up to three months later. The 10-year bond could continue higher in the near term, and the yield curve should flatten.