
Treasury Bond Selloff

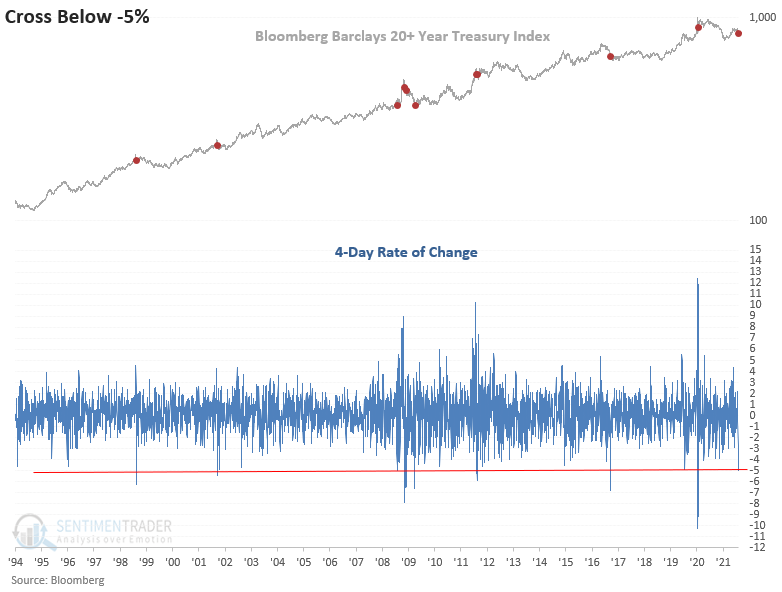
At the close of trading on Tuesday, the Bloomberg Barclays 20+ Year Treasury Bond Index registered a 4-day decline of greater than 5%. Suppose we screen out repeats by requiring the 4-day rate of change to cross back above 0% before an additional instance can occur. In that case, this is only the 11th signal since the data started in 1994.
In a recent note, I shared a study highlighting the relentless decline in the utility sector for the previous 13 trading days, a development not seen since 1974. Cleary, the utilities sniffed out the increase in energy prices and started to discount higher interest rates before the bond market reacted. Remember, bonds typically struggle when inflation is prevalent.
Let's conduct s study to assess the outlook for bonds, stocks, and the dollar index when the 4-day rate of change for the Bloomberg Barclays 20+ Year Treasury Bond Index crosses below -5%.
HISTORICAL CHART
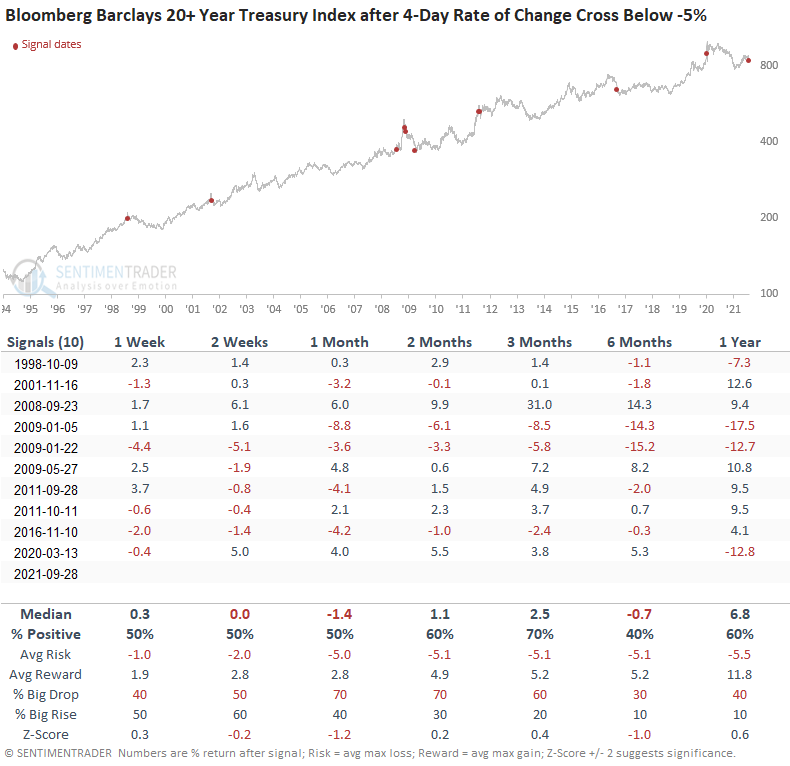
HOW THE SIGNALS PERFORMED - BONDS
While the sample size is small, one can spot a pattern. We see a coin toss environment with generally weaker returns in the first month followed by a mean reversion bounce in the 2-3 month time frame. The 6-month window would suggest falling prices or a rising interest rate environment.
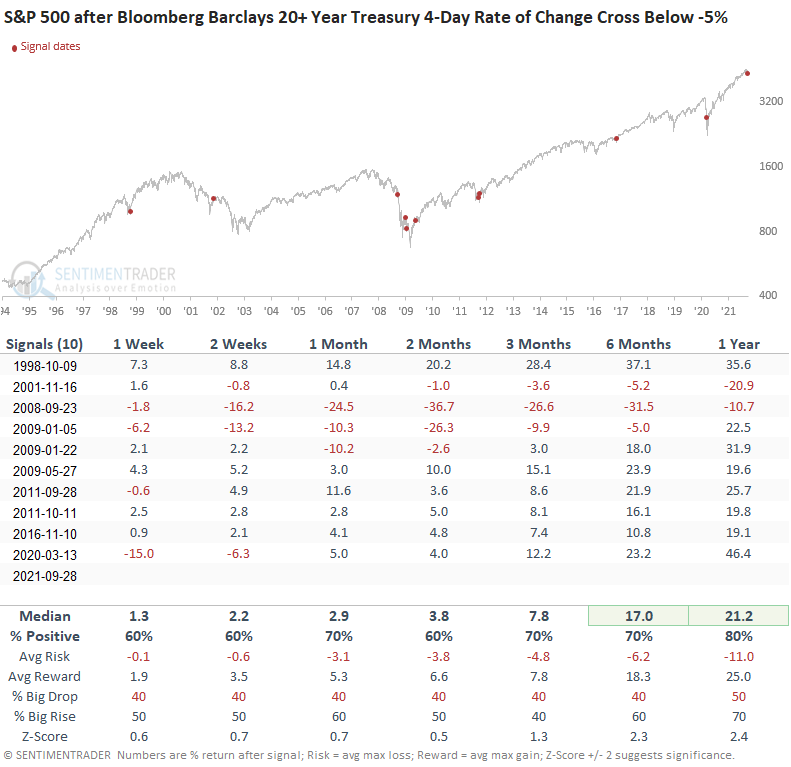
HOW THE SIGNALS PERFORMED - S&P 500
The S&P 500 returns look slightly better than historical averages on a short-term to intermediate-term basis and much better in the 6-12 month window.
I would note the signal dates and dots on the chart. Clearly, it shows instances are more prevalent during equity bear markets and corrections. The vicinity of the current signal is rare.
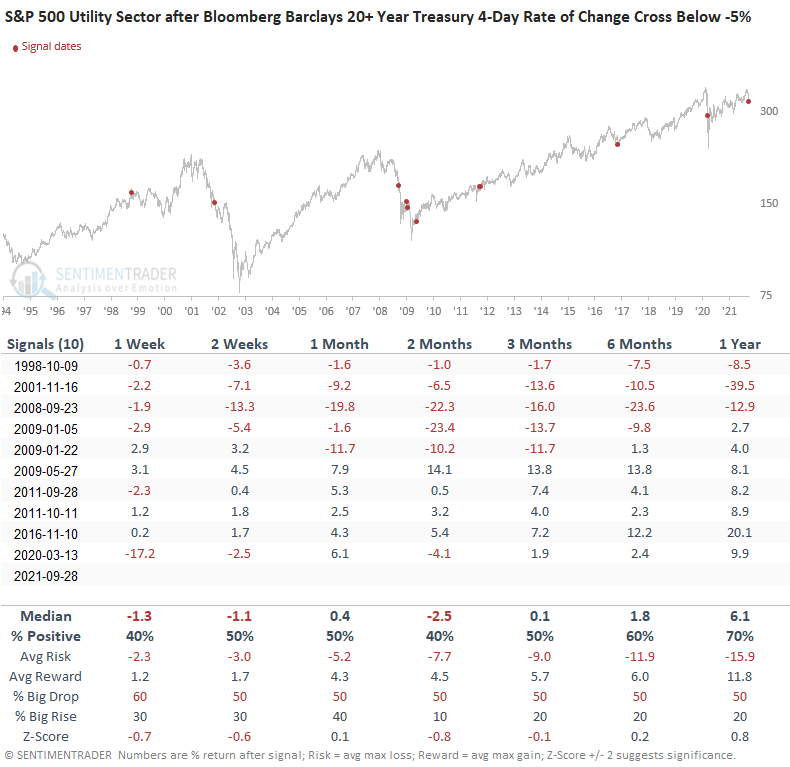
HOW THE SIGNALS PERFORMED - S&P 500 UTILITY SECTOR
The interest rate-sensitive utilities struggle on almost all time frames.
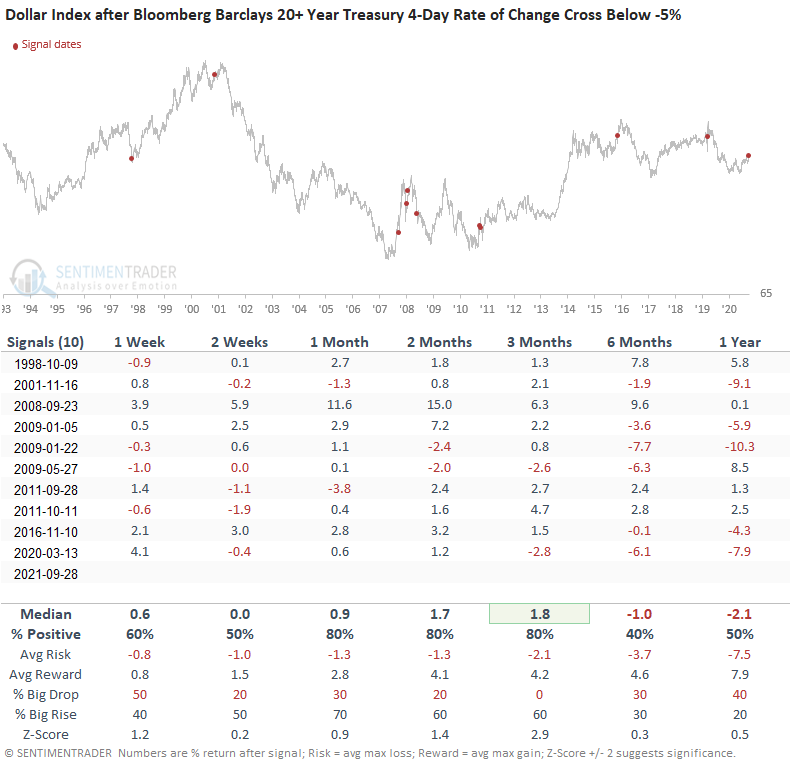
HOW THE SIGNALS PERFORMED - DOLLAR INDEX (DXY)
The Dollar Index looks strong on an intermediate-term basis. Once you get past the 3-month window, the dollar shows a tendency to decline.
Determining the market message from bonds is critical at this juncture in the cycle. Rising energy prices will put upward pressure on yields. The crucial question is how sustainable are the inflationary pressures and will it influence monetary policy.