
TradingEdge Weekly for Nov 22 - Risk-off warning, year-end seasonals, energy divergence

Key points:
- NOTE: TradingEdge Weekly will not be published the week ending November 29
- A risk-off warning has triggered
- New highs among indices have evaporated in near-record time
- Stocks are entering a positive short-term seasonal month-end window
- A longer-term window goes through the start of the new year
- Looking at that same window but for sectors and factors
- Energy stocks have diverged from the price of crude oil
- Good reasons to pay attention to copper prices here
- A low-risk way to battle gold FOMO
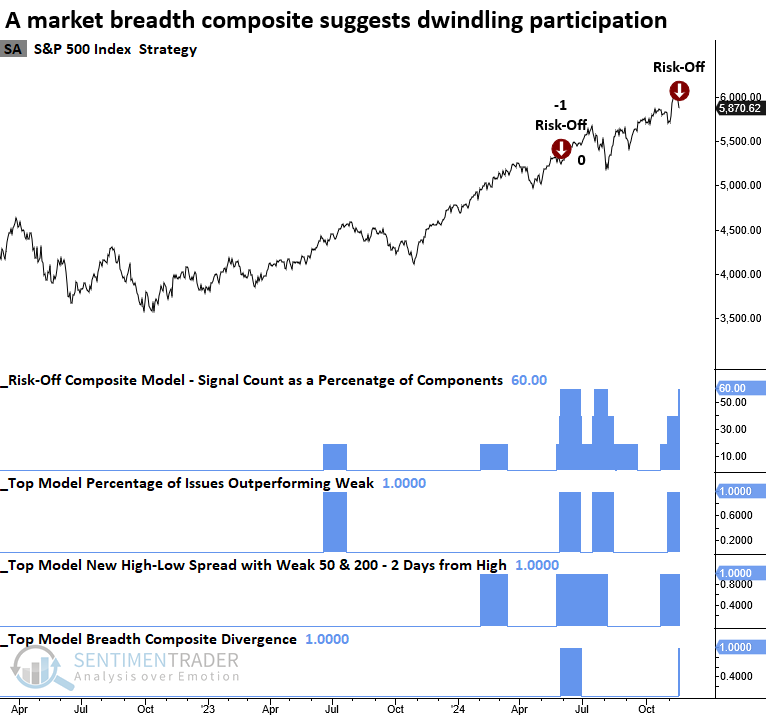
A risk-off warning
The Risk-Off Composite Model triggered a new warning, indicating that participation is dwindling. Dean showed that similar alerts produced an unfavorable outlook for the S&P 500 over the subsequent month.
Although the Risk-Off Composite Model maintains a solid track record of identifying potential trouble, all indicators are susceptible to whipsaw signals. These often arise during sector rotation phases, when macroeconomic forces such as rising interest rates or a robust dollar pressure certain groups, leading to declining participation.
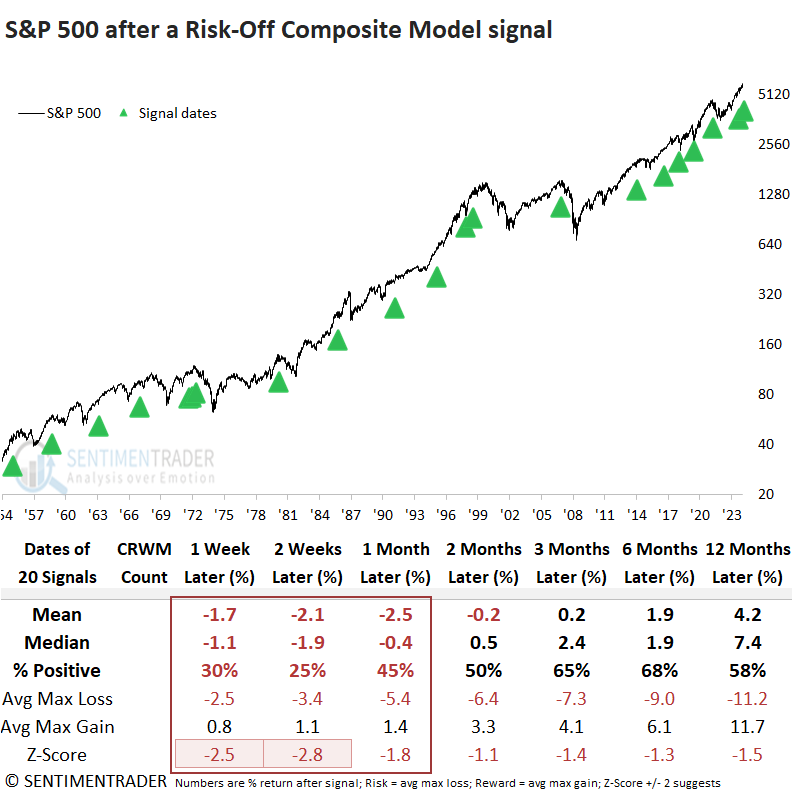
Following the activation of risk-off composite model alerts, the S&P 500 endured a challenging period in the months ahead. The first two weeks were particularly turbulent, as performance displayed statistically significant negative returns compared to random expectations. a significant correction.
A while back, Dean highlighted how defensive and commodity sectors overwhelmingly contributed to an expansion in 4-week lows, whereas cyclical groups maintained a constructive stance. This bifurcated breadth backdrop persists.
As long as cyclical sector stocks continue to show constructive participation, the Risk-Off Composite Model alert may again result in sector rotation, as it did in May 2024, rather than signaling a systemic problem that typically leads to a significant correction. A crucial factor behind the whipsaw signal following the May 2024 Risk-Off Composite Model alert was that Treasury yields peaked almost simultaneously with the signal and declined for over three months, providing a tailwind for equity markets.
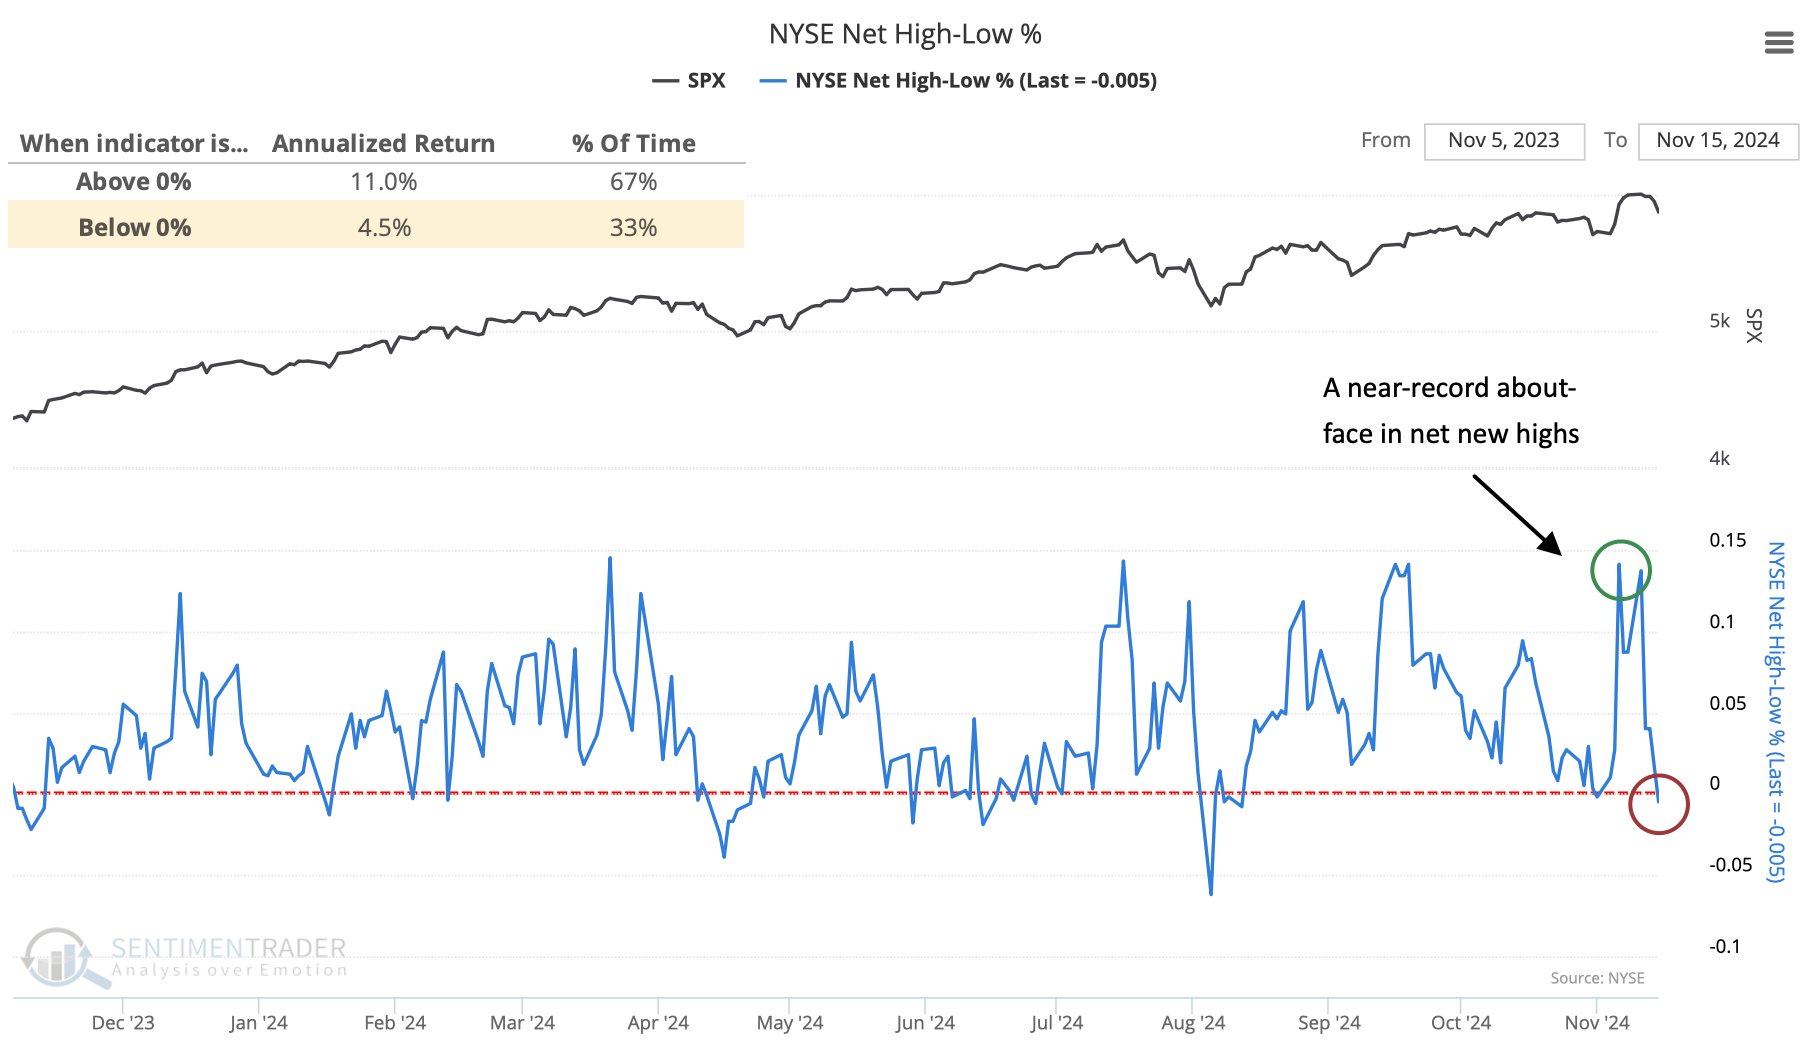
New highs evaporate
Quite a bit of "stuff" trades on the NYSE, not just common stocks but securities like preferred shares and other lesser-known instruments.
In the initial jump after the election results, more than 10% of NYSE "stuff" reached a new 52-week high. That's a healthy number. But markets reversed hard most of the past week, and already more issues are trading at 52-week lows than 52-week highs. That's not a healthy number. The S&P 500 has compounded at a much higher rate when the NYSE net high-low percentage is positive.
Since the pandemic, we've witnessed a few quick reversals in this indicator, each preceded by impressive gains in the months ahead. But those were more the exception than the rule.
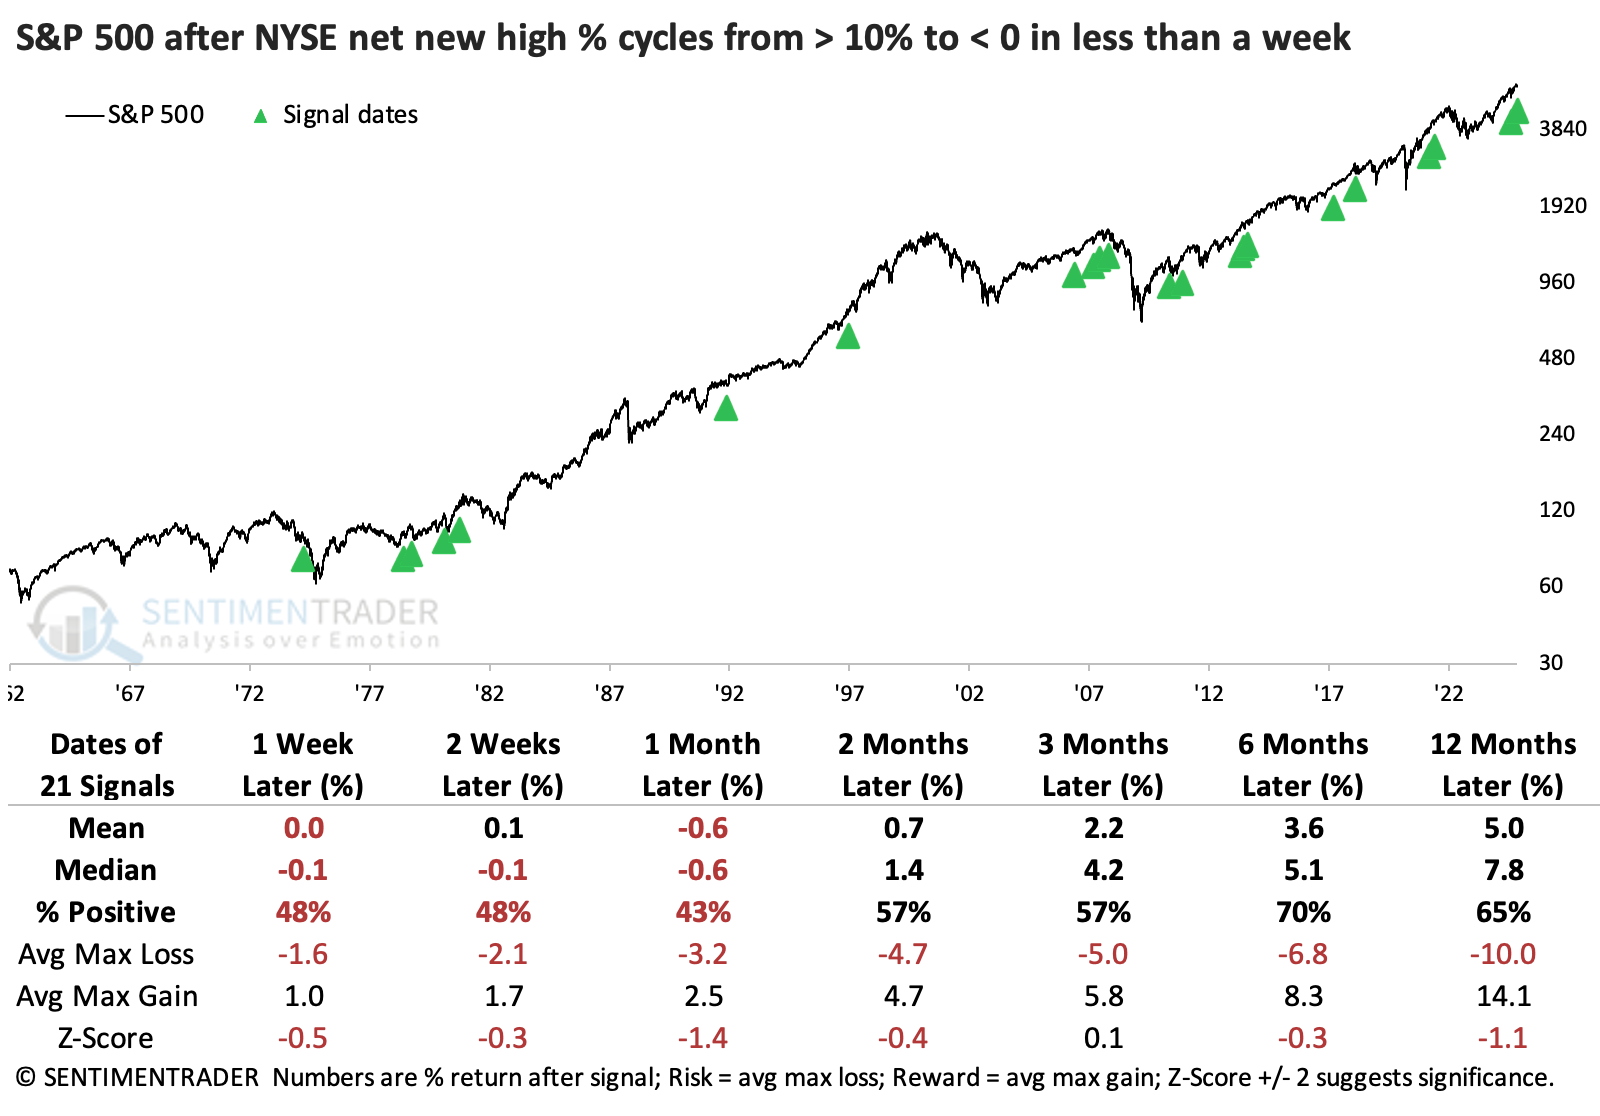 After these signals, there was a modest bias toward more defensive sectors, though it was not a compelling edge either way.
Across all three indices, more than 20% of the stocks had been at 52-week highs within the past week, and now there are more stocks at new lows than new highs. This is a near-record whiplash across all three, dating back to at least 1998.
The only time when all three indices saw this kind of new-high-to-new-low whiplash was in early May 2010, which was not a pleasant time to bet on a rebound because all three saw heavy losses through July. But that's a sample size of one, so it's hard to put much weight on it.
A positive short-term window
Despite any potential negatives, Jay notes that specific periods within the fourth quarter have shown to be pretty consistent.
The period we will consider here encompasses the last six trading days of November through the first three trading days of December. For 2024, this period extends from the close on 2024-11-20 through 2024-12-04.
The chart below displays the hypothetical growth of $1 invested in the S&P 500 Index only during this nine-trading day period every year starting in 1942.
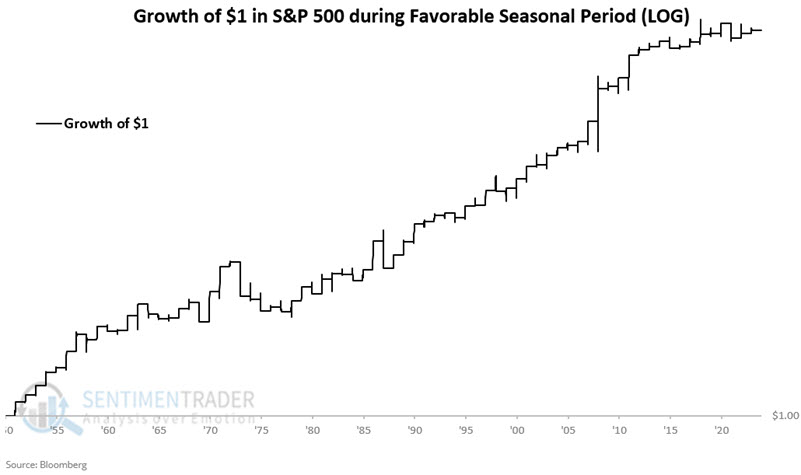
Over the years, 76% of these windows sported a positive return, with a higher average gain than loss. There were five years with a gain larger than +5% versus only two years with losses larger than -5%.
Looking a little further
Jay followed up by expanding the seasonal window. That period starts at the close of the Monday before Thanksgiving and ends at the close of the third trading day of the following year. For 2024-25, this period extends from the close on 2024-11-25 through 2025-01-06.
The chart below displays the hypothetical growth of $1 invested in the S&P 500 Index only during this nine-trading day period every year starting in 1942 using a log scale.
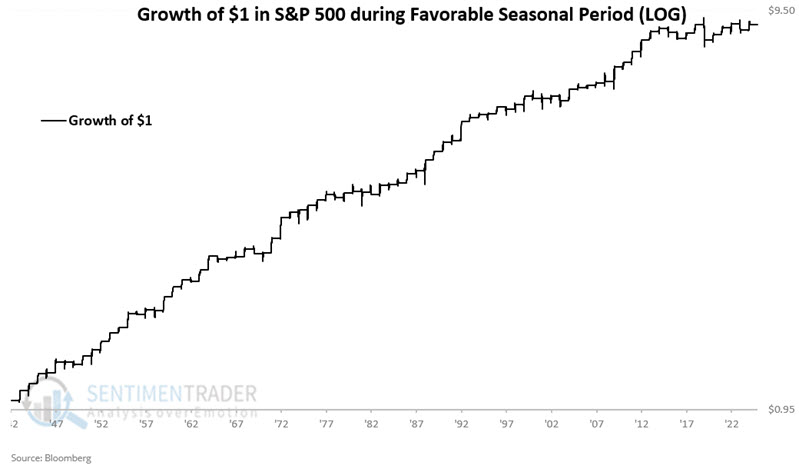
The positives are several. A 71% win rate and a median gain of 3.5% versus a median loss of -1.5% suggests a reasonable edge. Note also that 5% or more moves skew a lopsided 23-to-1 to the positive side.
There is a concern worth mentioning. No seasonal pattern is guaranteed to last forever. The chart below displays the 10-year rolling return for the year-end rally period detailed above.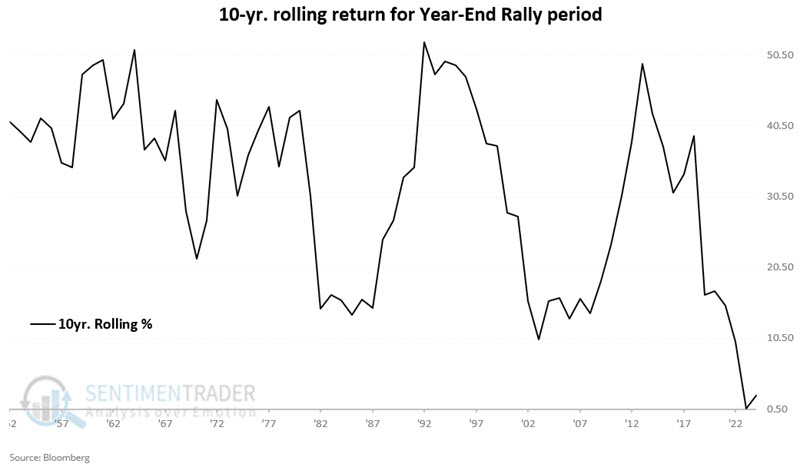
This seasonal pattern has not been nearly as effective in the last ten years as it was previously. So, has it lost its usefulness? For now - particularly given the strength of the market this year - it seems reasonable to give the year-end rally the benefit of the doubt.
Looking at sectors and factors
Jay went into further detail for that seasonal window by looking at sectors and factors. For the test below, we will examine the performance of the eleven S&P 500 sectors and the six S&P 500 factors only during the year-end rally period described above, starting in 1942. The table below summarizes the results.
The top performer in each category is highlighted in green, second-best performer is highlighted in blue, and third-best performer is highlighted in orange.
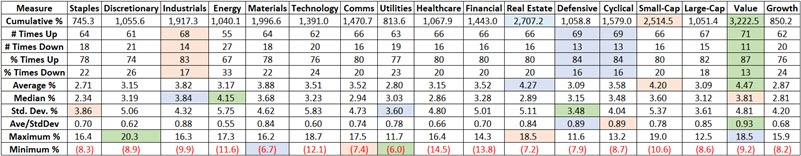
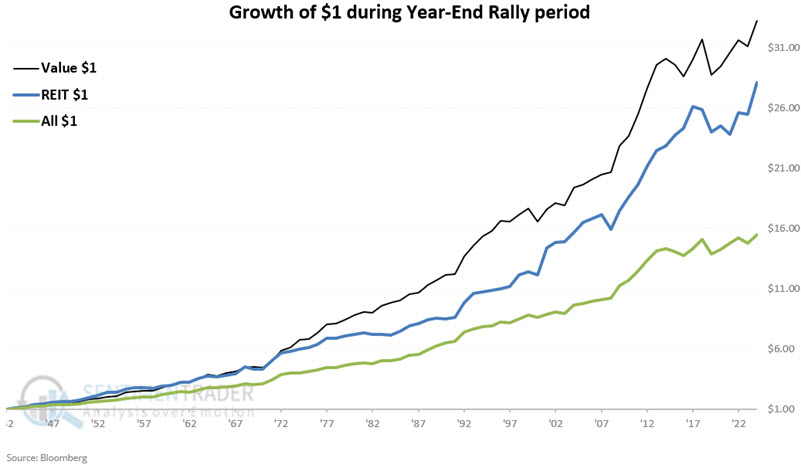
Interestingly, even though Value was only the top performer in three of the past 82 year-end rally periods, it was presumptively the top performer overall. The second largest cumulative gain was in the real estate sector.
The chart below displays the hypothetical growth of $1 invested in Value (black line) and Real Estate (blue line) versus $1 invested equally in all sectors and factors (green line).
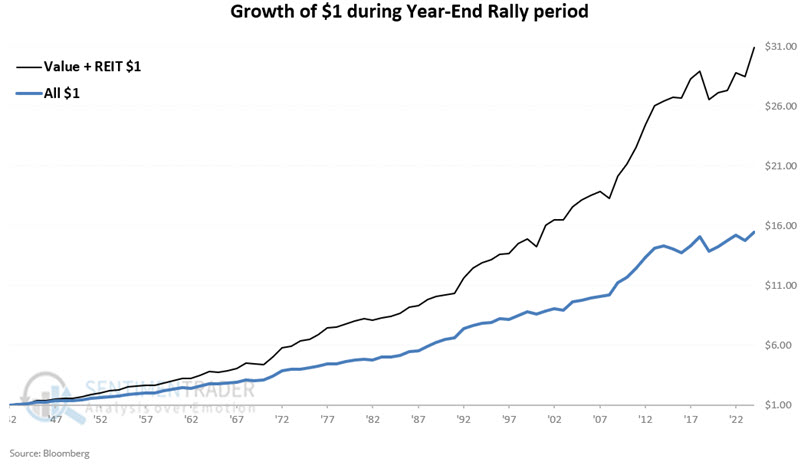
As a thought experiment, let's consider two hypothetical portfolios:
- One invests equally between Value and Real Estate on the close Monday before Thanksgiving and sells at the close of the third trading day of the following year
- The other invests equal amounts across all eleven S&P 500 sectors and all six S&P 500 factors during the same period each year
Both portfolios are considered flat with no position between early January and the next Monday before Thanksgiving. The chart below displays the hypothetical growth of $1 in both portfolios.
For investors interested in digging deeper, note that the iShares S&P 500 Value ETF (ticker IVE) tracks the S&P 500 Value Index and that the Real Estate Select Sector SPDR Fund (ticker XLRE) tracks the S&P 500 Real Estate sector.
An energy divergence
The S&P 500 energy sector trades near a 1-year high, while crude oil hovers around a 1-year low. Dean showed that comparable divergences produced an unfavorable medium-term outlook for the energy sector.
On Wednesday, the S&P 500 energy sector closed above the 85th percentile of its 1-year range. Conversely, crude oil closed below the 15th percentile of its respective 1-year range. Following the last notable divergence of this magnitude, the S&P 500 energy sector declined 10% over two weeks.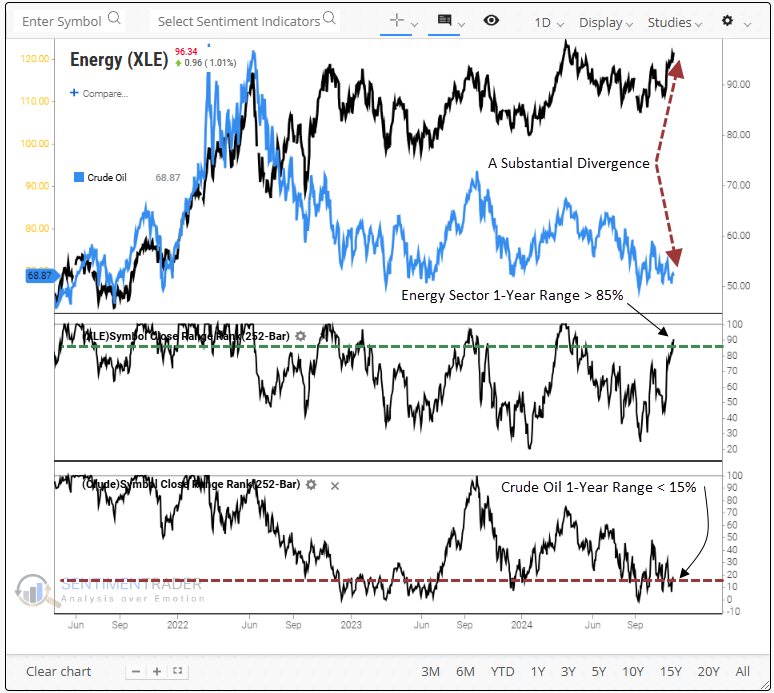
Although the sample size is small, substantial divergences between the energy sector and crude oil prices have historically seen the S&P 500 energy sector "catch down" to oil, with declines occurring 70%-80% of the time from one to four weeks later. Over the subsequent six months, the outlook was primarily negative, with risk outweighing reward in nearly every interval.
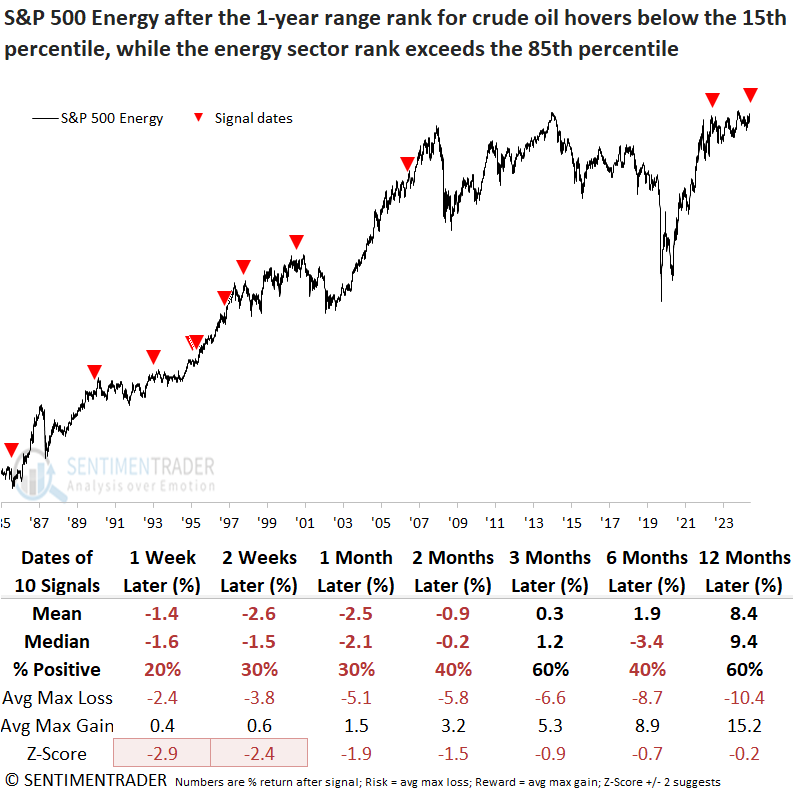
Although crude oil tended to rally a week later, rising 80% of the time, returns and consistency over the subsequent three months were uninspiring. Energy underperformed the S&P 500 over the subsequent year across all time frames, a scenario also shared by materials, another commodity-oriented group.
Even after expanding the sample size by adjusting the parameters to capture signals with a range rank of >= 80% and <= 20%, it conveyed a similar message.
Although the S&P 500 energy sector has consolidated over much of the past two years, the 4-year rate of change remains among the highest observed in the past 70 years. Except for the late 1950s, significant rallies of this nature preceded downside price action for the sector.
Paying attention to copper
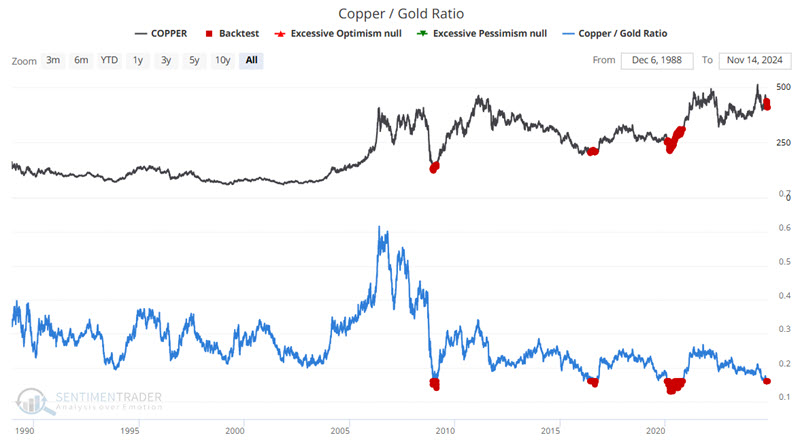
Jay noted that the Copper/Gold Ratio continues to argue for a higher price in the year ahead and a seasonal tailwind might help.
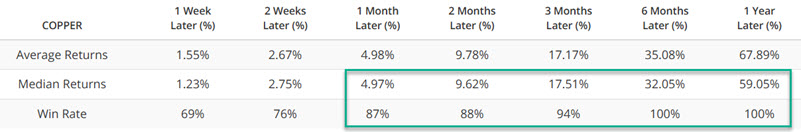
As the name implies, the Copper/Gold Ratio compares the price of copper futures to the price of gold futures to essentially measure the relationship between the foremost industrial and precious metals. At this time, copper is historically cheap compared to gold. The chart below highlights all dates when the Copper/Gold Ratio was below 0.16, and the table highlights subsequent copper performance.
The chart below displays the annual seasonal trend for copper futures. The current period between Trading Day of Year #219 and Trading Day of Year #42 next year is highlighted in green. This period began at the close on 2024-11-11. It should be noted that copper futures have lost $3,500 in value since then (a reminder that seasonality is not a roadmap).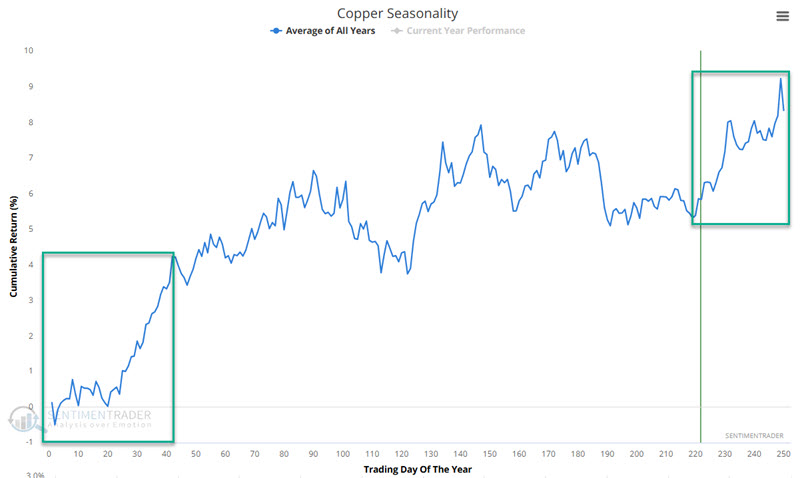
The chart below displays the cumulative $ gain/loss from holding a long position in copper futures only during this period since 1960.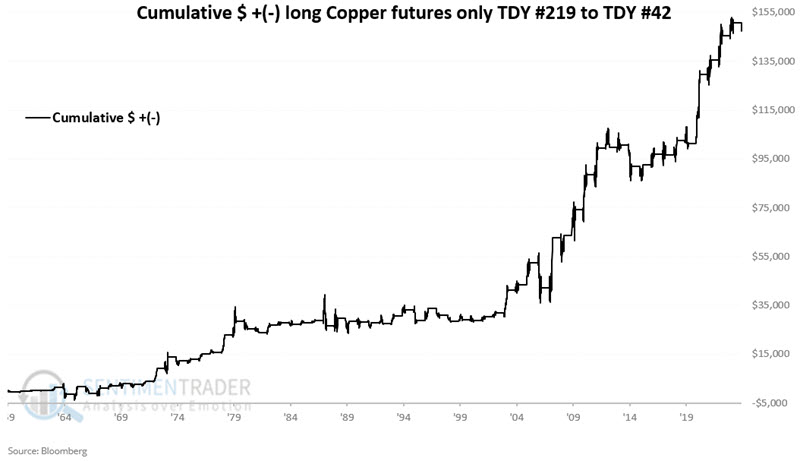
A 68% Win Rate suggests this factor should not be relied upon as a standalone indicator. However, when combined with a more meaningful signal - such as the one from the Copper/Gold Ratio - and if confirmed by an upside reversal in price, this seasonal trend can add significant weight to the bullish side of the ledger. Large moves over $5,000 have historically skewed 14 to 2 to the winning side.
No FOMO on gold
Sometimes, individuals feel they must choose between being all in or simply standing aside. Jay suggested that an options position can allow a trader to gain market exposure without a large dollar risk or commitment.
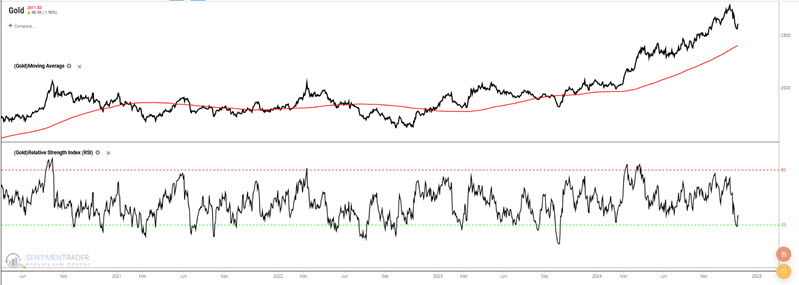
The chart below shows the rally in gold in the last year and the recent pullback.
Let's consider a trader with a $50K trading account. To buy 100 shares of SPDR Gold Shares (ticker GLD) at $241.09 a share will cost our trader $24,109. This represents almost 50% of their trading account. If our trader places a stock loss at $215, they will risk $2,609, or 5.2% of their trading capital.
One possible alternative to buy 2 GLD Feb21 2025 242 calls @ $8.25. The screenshot below displays the risk curves. Note that the risk curves change as time passes due to time decay.
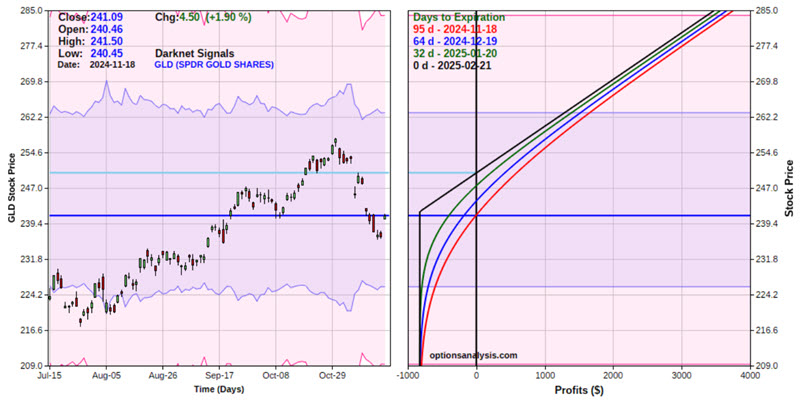
The cost to enter this position (and the maximum dollar risk) for a 2-lot is $1,650 (versus $24,109 to buy 100 shares of GLD, or 6.8% as much)
This represents a worst-case loss of 3.3% of a $50K trading account.
If this position is held until expiration, the trade would show a profit if GLD is above $250.25. If GLD is at $242 or lower at expiration, the trade will show a loss of -$1,650.
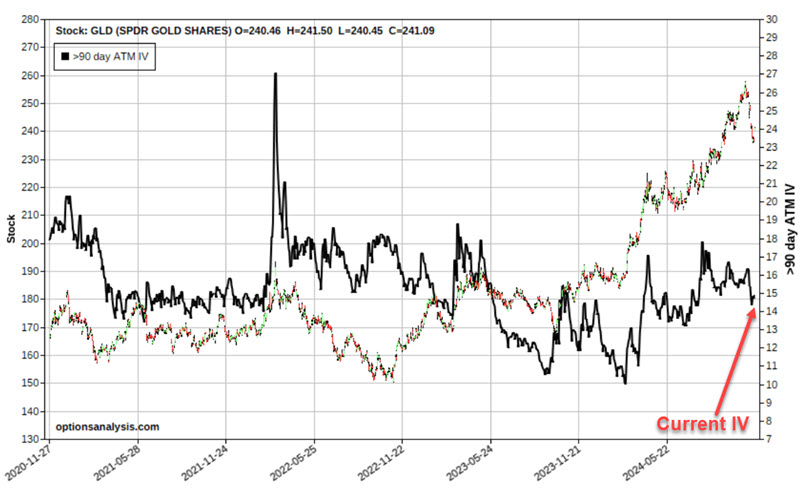
Note the current IV is 14.94%. The status of 90+ day GLD option IV appears in the chart below versus its historical range (black line). It's about in the middle of its range, suggesting the options are not especially expensive or cheap.
Everything in trading involves tradeoffs. The good news in this example is that an option trader can assume a position with a Delta of 111 (i.e., roughly equivalent to holding 111 shares of GLD) for $1,650 instead of spending $24,109 to buy 100 shares of GLD.
About TradingEdge Weekly...
The goal of TradingEdge Weekly is to summarize some of the research published to SentimenTrader over the past week. Sometimes there is a lot to digest, and this summary highlights the highest conviction or most compelling ideas we discussed. This is NOT the published research; rather, it pulls out some of the most relevant parts. It includes links to the published research for convenience, and if you don't subscribe to those products, it will present the options for access.