
TradingEdge Weekly for Mar 17 - Severe selling pressure, Financial stock plunge, bond volatility

Key points:
- A historic bout of severe selling with fewer than 10% of stocks advancing
- Financial stocks have plunged, pushing many to 1- or even 3-month lows
- It's getting nearly impossible to find an equity market with a positive trend
- A look at rapid rises in the yield curve
- Credit spreads are widening but remain far below prior panics
- Traders are pricing in extreme moves in bond prices
- Even with that carnage, investors don't seem to be hedging against tail risk
- A long-term indicator suggesting the worst may be over
- Many stocks and funds are now entering a consistently positive seasonal window
- Among sectors, there are 3 that have stood out during these windows
- Energy stocks are suffering from deteriorating trend health
A historic bout of severe selling pressure
A month ago, we saw that the 4-month period following the October bottoms had been rife with breadth thrusts. And then we saw that the first 95 days have been most correlated to nascent bull markets that tended to persist.
Since then, it's been a very tough go. On consecutive days, and for three out of the past five sessions, more than 90% of stocks in the S&P 500 suffered declines. The only times investors have behaved like this in recent years were in March 2020 and June 2022.
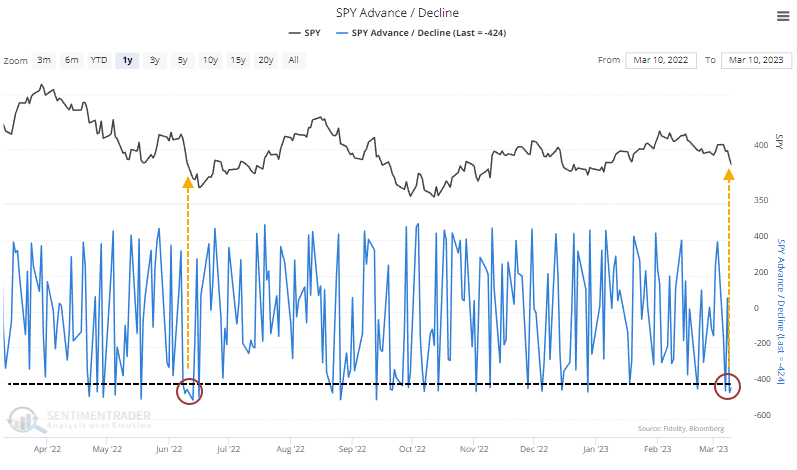
This is a rare cluster of such severe selling pressure, with previous bouts preceding gains in the S&P over the next six months every time but once. Granted, that "once" was during the teeth of the financial crisis and led to more than a 30% drawdown. It still showed a gain a year later.
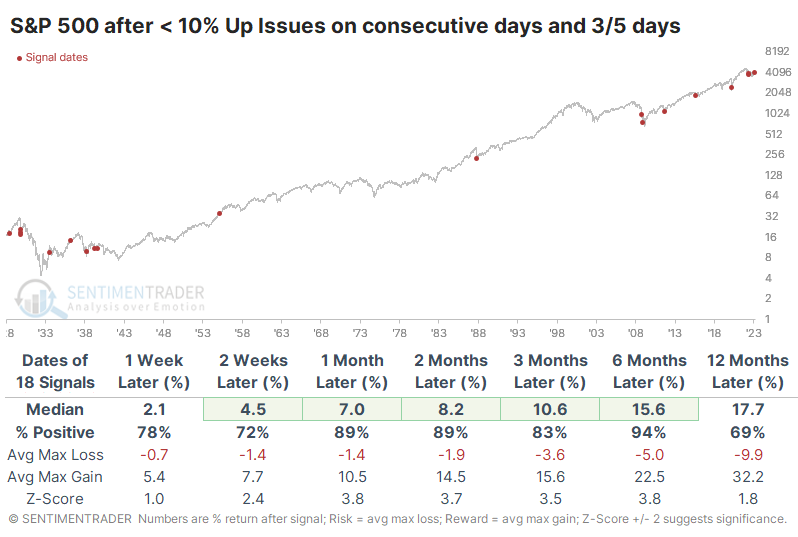
Only five signals suffered more than a 10% drawdown at any point within the next six months. Two of those were just barely and led to significant gains. The failure in October 2008 was the only one that didn't see double-digit upside within the next six months.
If we go back to that study of 4-month bottoms, we'll look for the ones with the most days with either 80% Up Issues or Up Volume. Then, we'll filter those that suffered the most big down days (with less than 20% Up Issues or Up Volume) over the following month. Except for an absolute failure in 1931, they all enjoyed a positive return six months later. In other words, a bevy of big down days in the month following a major 4-month rebound did not cancel out the positive implications from the initial bottoming phase except for that one instance.
Plunging Financial stocks trigger multi-month lows
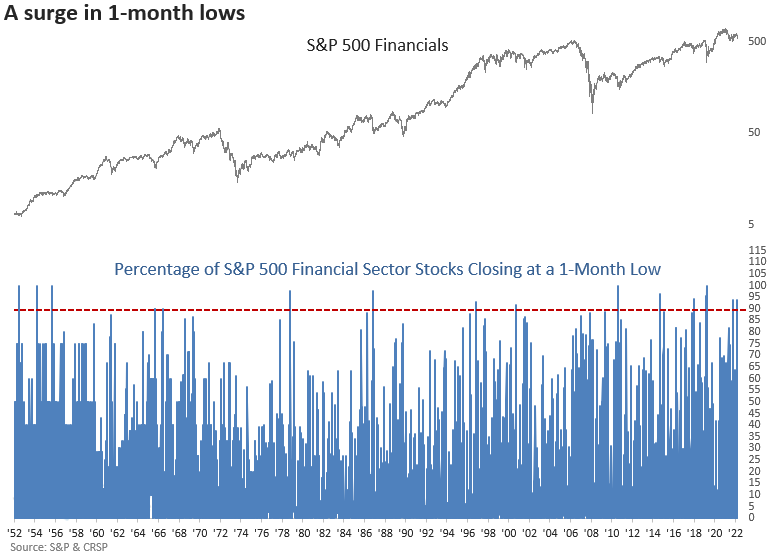
A big driver of the decline has been Financial stocks. Dean noted that more than 90% of S&P 500 Financial sector stocks closed at a 1-month low and over 69% of them closed at a 3-month low.
Typically, high readings like now are associated with a panic-driven event like the 1987 crash, 9/11, the 2011 debt downgrade, or the Covid crash.
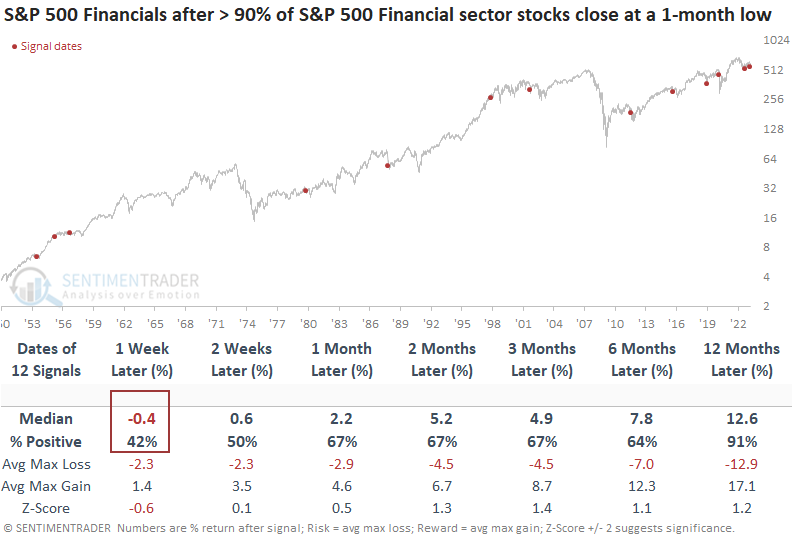
When greater than 90% of S&P 500 Financial sector stocks close at a 1-month low, the sector tends to see some near-term downside follow-through before rebounding over the next few months. A year later, the group was higher in all but one case. Interestingly, the percentage of S&P 500 Financial sector stocks closing at a 21-day low never exceeded 90% in the global financial crisis. The max reading was 88%.
The selling pressure late last week also pushed the percentage of 3-month lows above 69%. When it got that high, the sector tended to bounce back in the next few weeks. However, the results a month later suggest some backing and filling could take place. Except for 2008 and 2020, signals typically occurred near the end of a risk-off period. With the global financial crisis at the forefront of investors' minds, it's important to remember that a spike in 3-month lows like now led to significant bear market rallies in 2008.
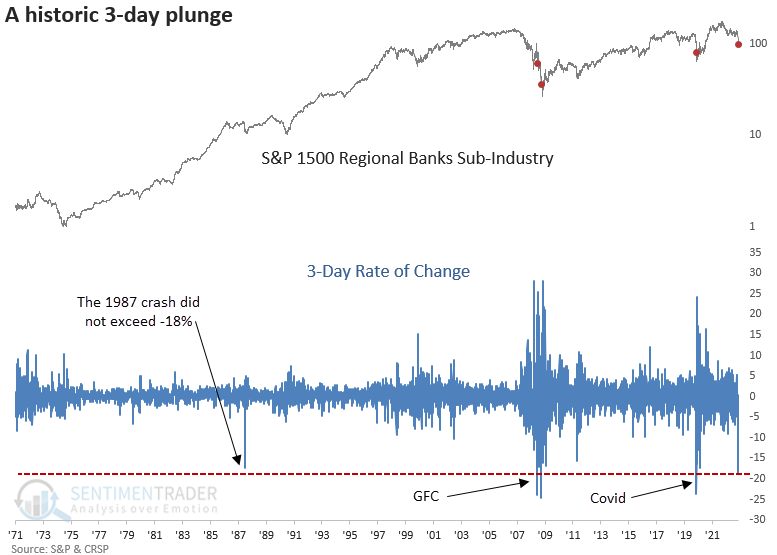
On an intraday basis, the S&P 1500 Regional Banks Sub-Industry group declined by greater than 18% over three days. That's happened only three other times in history, none leading to the demise of the sector.
Almost no equity market has a positive trend right now
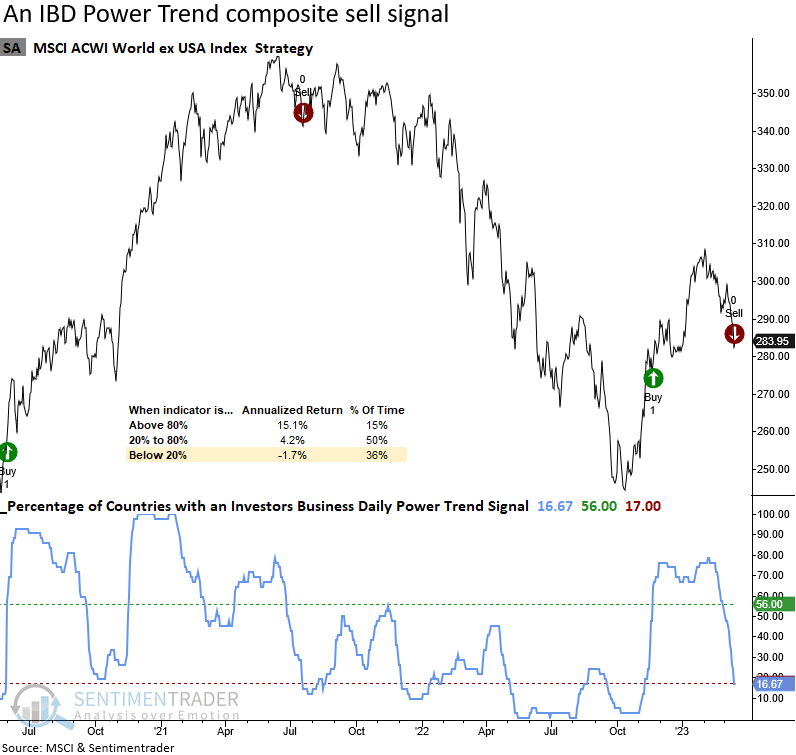
Any suggestions for a resumption of the rally are running into the reality of increasingly poor price trends. Dean noted that a composite that measures IBD Power Trend signals for country ETFs triggered a risk-off alert this week.
With the recent turmoil in the markets, the bullish trend backdrop has taken a turn for the worse, with a Tsunami of sell signals. The all-country ETF composite registered the 30th risk-off signal since 1997 on Wednesday. Annualized MSCI ACWI World ex USA Index returns are negative when the composite value falls below 20%, which is the case now.
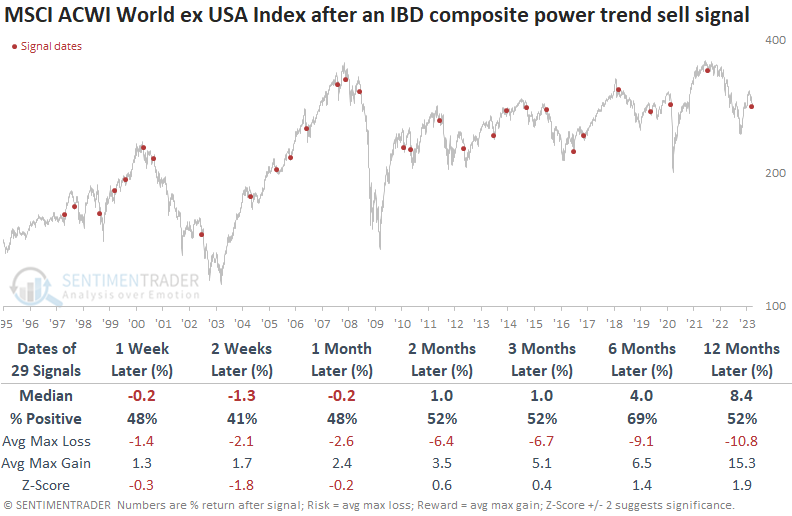
When the IBD Power Trend composite for country ETFs triggers a risk-off signal, the trend deterioration tends to lead to additional downside follow-through for the MSCI ACWI World ex USA Index over the next month.
Over 15 country ETFs registered a sell signal in the last ten sessions. The composite for the Asia-Pacific region triggered a sell signal on 2023-03-09. Japan, the last remaining country in the Asia-Pacific region with a positive trend, reversed to a sell, which moved the composite to zero this week.
Rapid rises in the yield curve
Dean showed that the 10-year to 3-year Treasury yield spread increased by 46 bps over three days. After similar spread changes, stocks showed modest gains over the next three months while commodities and the dollar index struggled.
The trouble in the banking sector in the last week sent stocks tumbling and short-dated yields like the two and 3-year plunging at one of the swiftest rates in history. With investors buying short-dated Treasuries hand over fist on the narrative that another financial crisis is upon us and the Federal Reserve will reverse its policy stance, the yield curve steepened by the 3rd most significant amount in history.
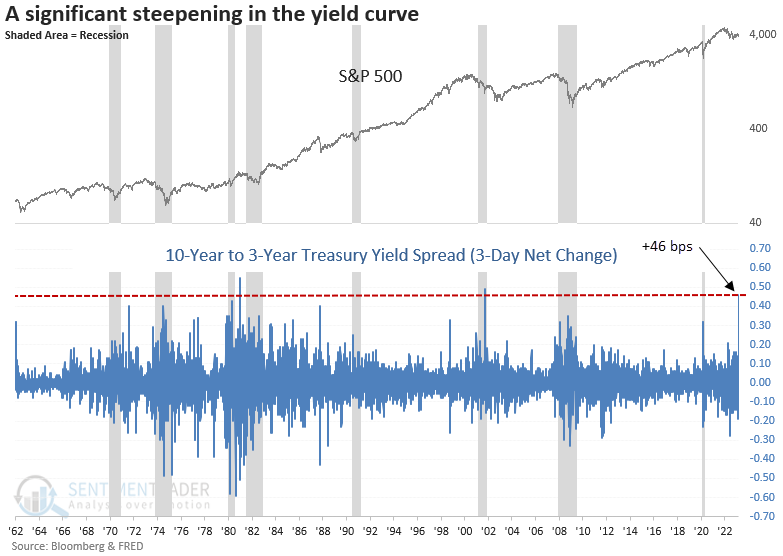
When the 10-year to 3-year Treasury spread increases by 30 bps over three days, the S&P 500 shows modest gains over the next three months. Except for a few signals, long-term results look constructive. Since 1987, the signal typically occurred around panic-driven events. Before that, the curve steepening was more common as interest rates were volatile during a high inflation environment.
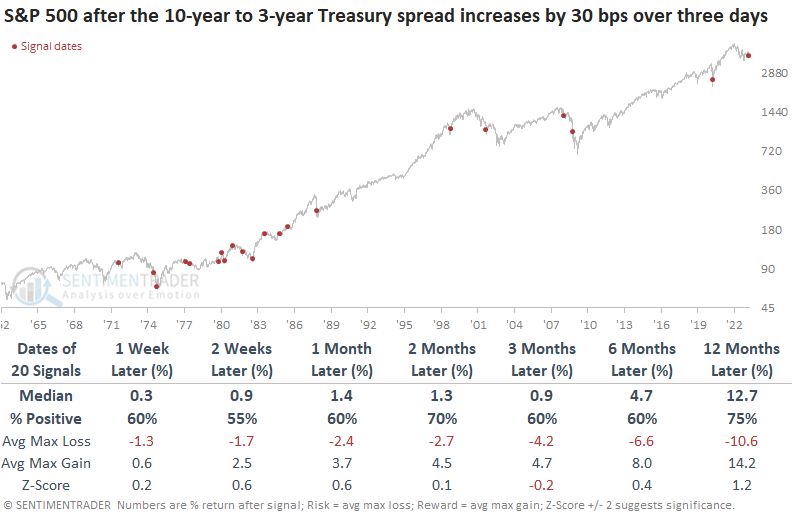
Interestingly, the steepening of the yield curve does not foreshadow a flight to safety in the Dollar Index. Usually, a weak dollar provides a tailwind for commodities, but not with this signal. While gold returns and win rates are favorable on a medium and long-term basis, it wasn't very consistent. Over the next couple of months, the yield on 10-year Treasuries rose only 19% of the time.
Credit spreads aren't showing true panic
Jay showed that the plunge in the banking and financial sectors has raised serious concerns, yet credit spreads remain noticeably below previous panic levels. As long as these spreads remain muted in their response, it makes sense to stay calm.
A credit spread measures the relationship between two interest rates. A give credit spread will typically remain within a normal range. However, when there are significant distortions and stress within the financial system, these spreads will widen as the yield on the lower-rated instrument will tend to spike relative to the higher-rated instrument.
The thought to take away is this: When credit spreads widen sharply, it is a warning of real trouble. When a perceived crisis occurs, but credit spreads do not spike, it is typically a time to ignore the hype and remain calm.
Jay highlighted four different spreads, two of which are below. The option-adjusted spread on BBB-rated corporate bonds minus the spread on AAA-rated corporate bonds will spike during credit crises. While it has risen this week, it remains far below panic thresholds.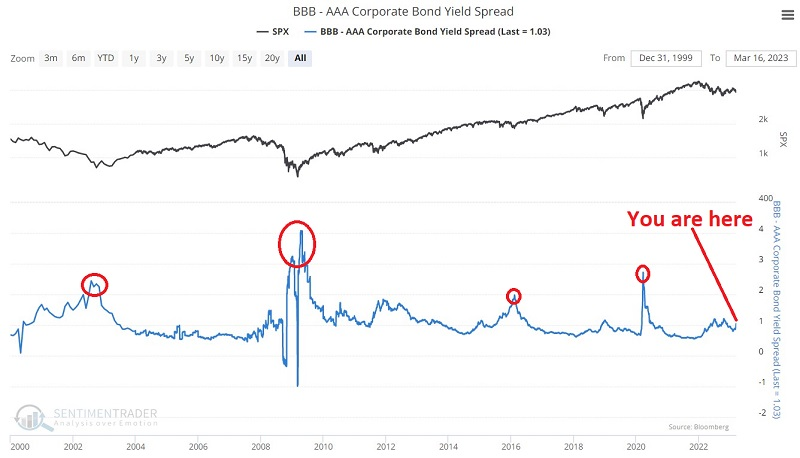
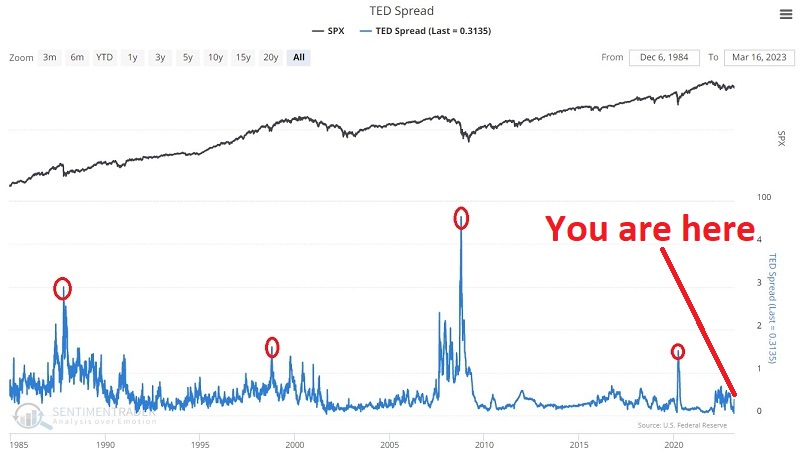
The TED spread (Treasury - Eurodollars rate) is the difference between the three-month Treasury bill and the three-month LIBOR based in U.S. dollars, so the difference between the interest rate on short-term U.S. government debt and the interest rate on interbank loans. It's considered a measure of credit risk since short-term U.S. debt is considered risk-free. Again, it has jumped recently but remains below other periods of panic.
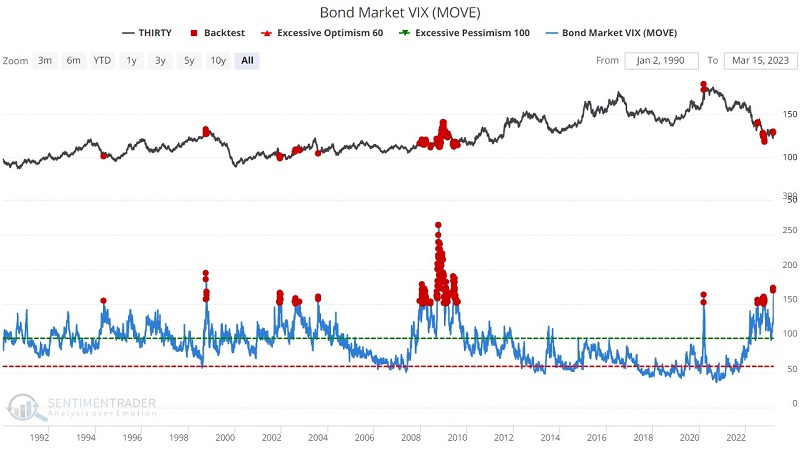
The bond market is MOVEing
The Bond Market VIX (MOVE) is designed to track trader sentiment regarding bond volatility. Jay showed that MOVE recently spiked to an extreme reading looked at how a variety of markets have reacted in the past.
Merrill Lynch developed the MOVE index (MOVE) to measure the implied volatility of US Treasury markets. It is similar to the VIX for stocks that most people are familiar with in that during periods of high uncertainty, options traders will price in wider moves, and the MOVE index will rise. For testing purposes, we will deem any MOVE reading above 150 as extreme.
The chart and table below display thirty-year Treasury bond performance anytime MOVE is greater than 150. The forward performance for T-bonds following extreme readings was essentially a coin-flip.

But that changed if prices were above the 150-day moving average. The table below displays thirty-year Treasury bond performance anytime MOVE is greater than 150 and price is above its 150-day moving average. Average returns and win rate declined significantly.
Jay also looked at extreme readings in the MOVE index against future returns in stocks, the dollar, gold, and soybeans.
Traders are still not hedging against sudden, outsized risk
Stocks have been melting for a couple of weeks, and yet nobody's panicking. In fact, they don't seem interested at all in betting on a black swan.
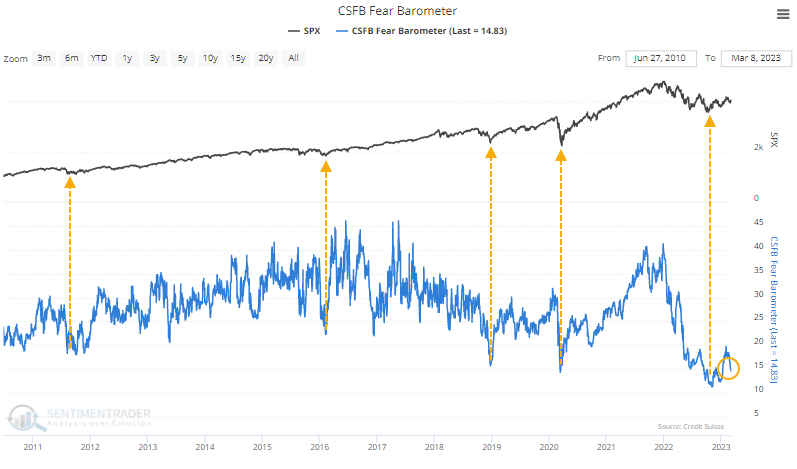
At least, that's the supposed conclusion from indicators like the CSFB Fear Barometer, which measures the relative cost of puts versus calls. The way the indicator was constructed, it was supposed to be a VIX-killer, a more reliable way to measure genuine fear among options traders.
In practice, it has turned out to be the exact opposite. Instead of high readings showing fear and coinciding with market bottoms, they coincide with peaks. And very low readings - supposedly evidence of complacency - have more closely aligned with bottoms. The trouble with the indicators is that after prolonged periods of losses, investors don't need to hedge against tail risk because they already have less exposure to the stock market.
This is notable now because these indicators have once again declined and hover near the lowest levels in a decade. The Fear Barometer, for example, has been depressed for months. It has spiked a bit due to the bank run hysteria but remains historically low.
We can see similar behavior in the Nations TailDex index, designed to reflect moments of fear among options traders. It is now recording some of the lowest readings since its inception. But such "complacency" has preceded better annualized returns for the S&P 500 than most other levels in the indicator.
Among small traders, the amount of premium they're paying on puts overall has remained substantial. It reached a historic extreme a couple of times in 2022, equivalent to the bouts of pure panic over the past 23 years. For one of the few times in history, traders spent more on protective puts than speculative calls. They're not necessarily buying out-of-the-money contracts that would more likely impact the above indicators.
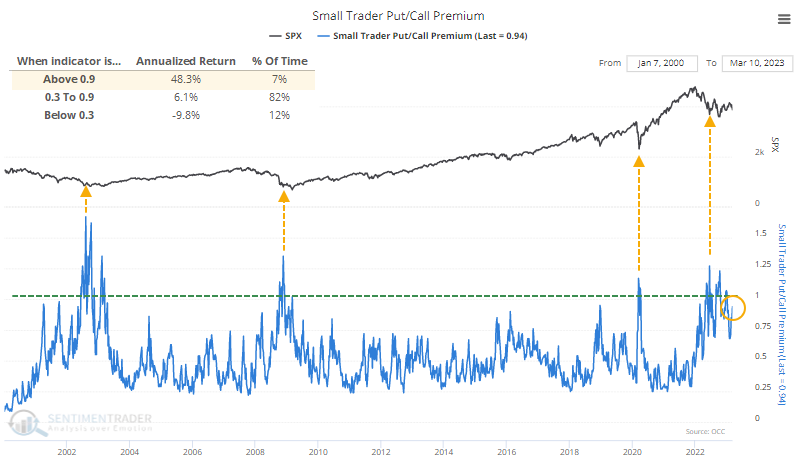
When the amount of money options traders spent on puts equaled 90% or more of what they spent on calls, which happened last week, the S&P 500's future annualized return was over +48%. When they spent 30% or less on puts, that return plummeted to -9.8%.
A long-term indicator suggesting the worst may be over
Our Smart Money / Dumb Money Confidence Spread Index is designed to highlight extremes in investor sentiment. Jay looked at a long-term moving average that can also help to identify times when the tide has turned.
The chart below displays the S&P 500 Index along with the 200-day moving average of the spread between Smart and Dumb Money Confidence. Peaks in the green line tend to occur after the stock market has bottomed.
Now to go one step further in attempting to establish an "all clear" benchmark, instead of giving a signal as soon as the green line rolls over from a peak, the chart below highlights those occasions when the 200-day average of the raw indicator crossed below 0.09. Red dots mark those relatively rare occasions.

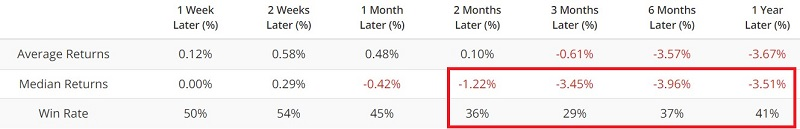
The table below summarizes the performance following the dates highlighted by the red dots in the chart above. On the plus side, results were positive 100% of the time six and twelve months later. On the other hand, the S&P 500 showed a gain one month after a signal less than 50% of the time. 2002, 2008, and 2012 signals were also significantly negative three months after the signal.
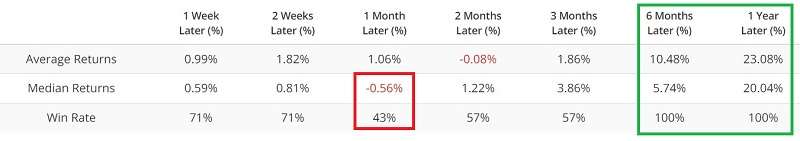
It may be a bridge too far to label the signal described above as an "all clear" signal. As shown in the table above, the S&P showed a gain only 43% of the time one month after a signal, and there were some not-insignificant drawdowns within the holding periods. But over the next 6-12 months, there were no losses.
A bevy of positive seasonal windows is opening
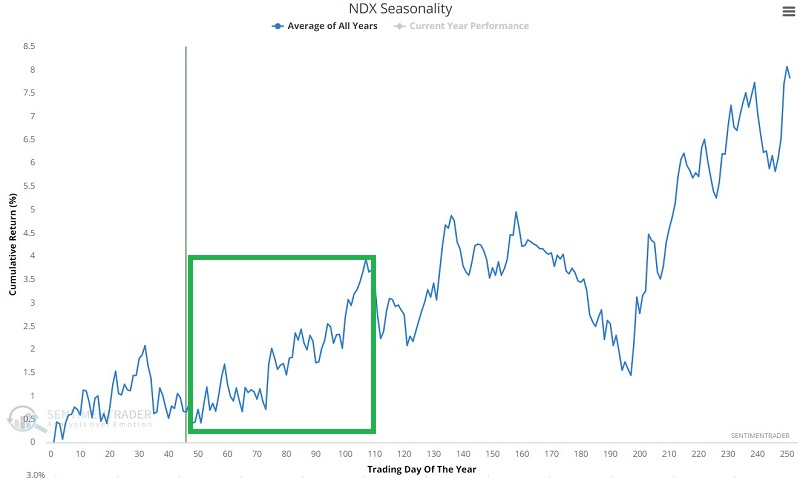
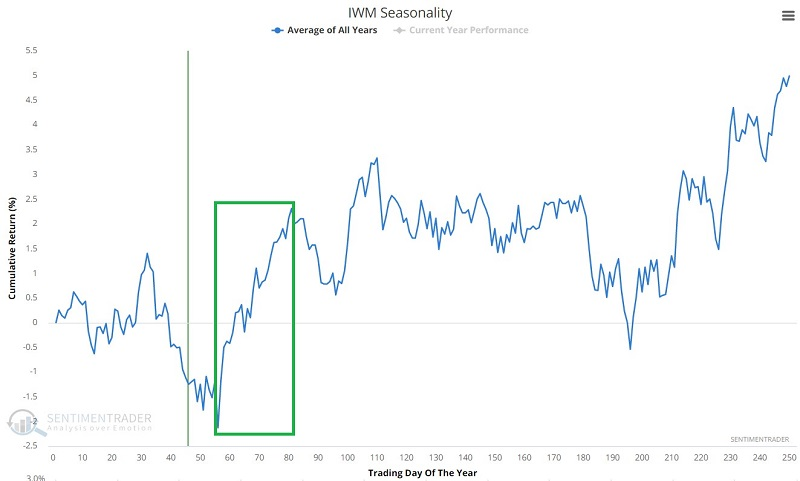
Seasonality tells you how a given security has acted in the past during a certain time period. Jay showed that a significant number of securities are soon to be entering one of the most favorable seasonal times of the year.
The bad news is that most of them are presently in a price downtrend. The objective of seasonality is not to pick tops and bottoms with uncanny accuracy. The objective is simply to alert us to potential opportunities. If the price is presently in a sharp decline it suggests that we should wait for an upside reversal before jumping in.
He highlighted current year performance vs. seasonals, as well as trend charts for many funds. Below, we can see the annual seasonal trend for a few of them that have been of the most interest to traders: Big tech, Small-Caps, and Financials. All have just entered, or are about to, one of their most consistently positive windows of the year.

Seasonal sectors
Jay further noted that the S&P 500 Index is entering a seasonally favorable period but he looked at sectors instead of the index.
The chart below displays the annual seasonal trend for the S&P 500 Index. It also highlights the period from Trading Day of Year (TDY) #49 through TDY #85. For 2023, this period extends from the close on 2023-03-14 through the close on 2023-05-04.
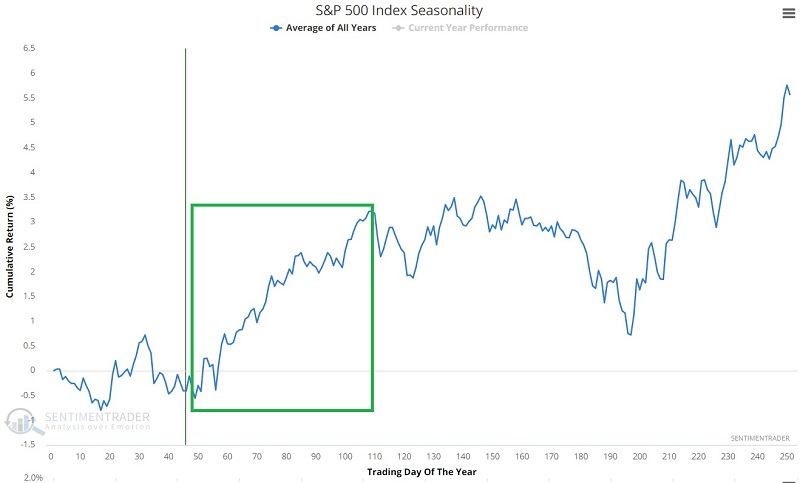
Over the past 70 years, the S&P has rallied during these seasonal windows 70% of the time, with a median gain about double the median loss. It rallied more than 8% eight times while suffering more than an -8% loss only once.
The table below displays the performance of each of the S&P 500 sectors during this seasonal window since 1953. The top three sectors were Energy, Consumer Discretionary, and Materials.
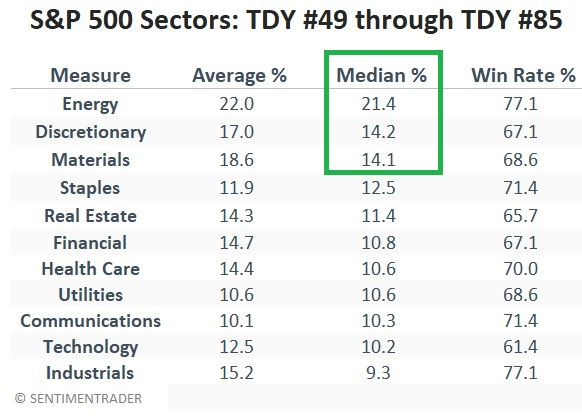
Now let's look at how a portfolio holding these three sectors might have performed over time. For our test, each year at the close of TDY #49, we split the portfolio evenly between the three sectors and held them through TDY #85. To illustrate seasonal period results only, the portfolio is flat (no gains or losses) the rest of the time.
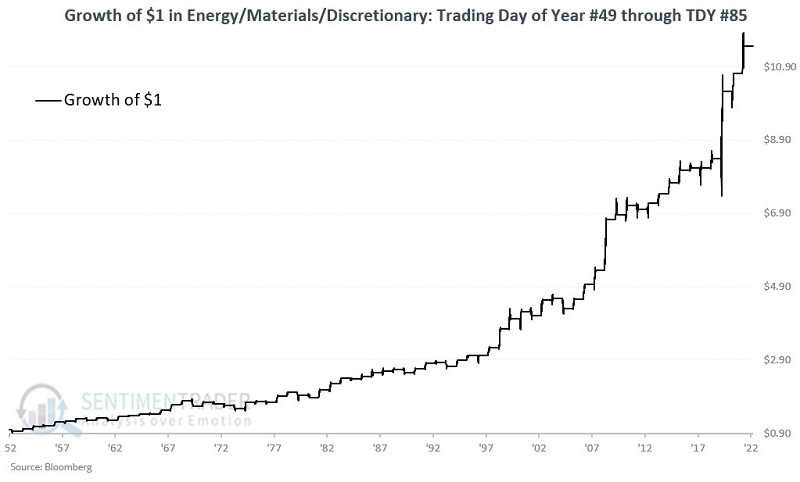
During the study period, $1 invested in the S&P 500 grew to $4.77. On the other hand, $1 split evenly among the three sectors each year grew to $11.47. The portfolio showed a gain 74% of the time, with an average gain nearly three times larger than the average loss. It gained more than 9% nine times, while suffering no losses larger than -9%.
Deteriorating trends may trump seasonality
While the Energy sector is on the cusp of enjoying a relatively brief positive seasonal window, Dean noted that deteriorating trends are a challenge. More than 78% of S&P 500 energy sector stocks closed at a 3-month low and a composite that measures energy stock participation deteriorated to an adverse level.
Energy stocks took their cue from oil and plunged recently. The significant decline on top of last week's consolidation breakdown pushed several market breadth indicators to extreme levels.
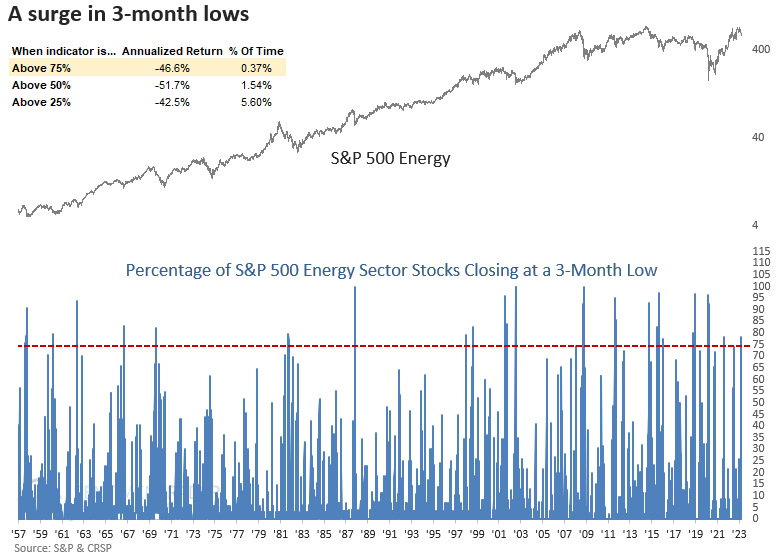
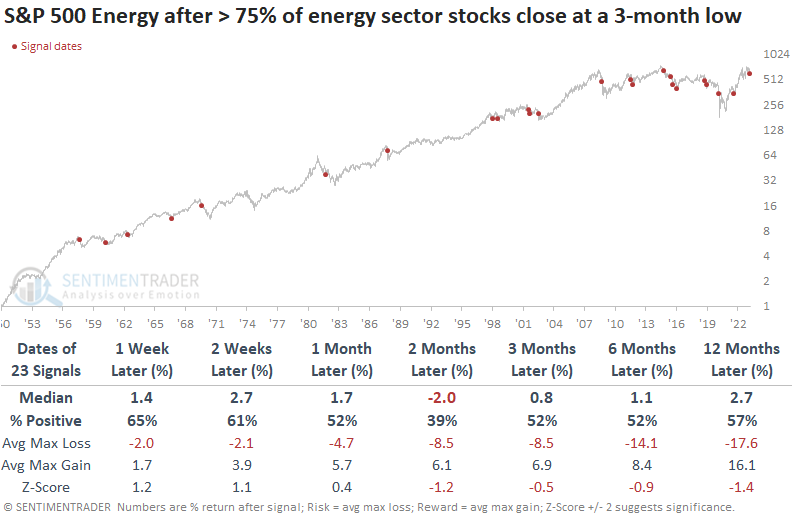
When more than 75% of S&P 500 Energy sector stocks close at a 3-month low, the sector tends to bounce from the extreme level in the next few weeks. However, the rally is brief. Two months later, the unfavorable breadth environment reasserts itself with negative returns.
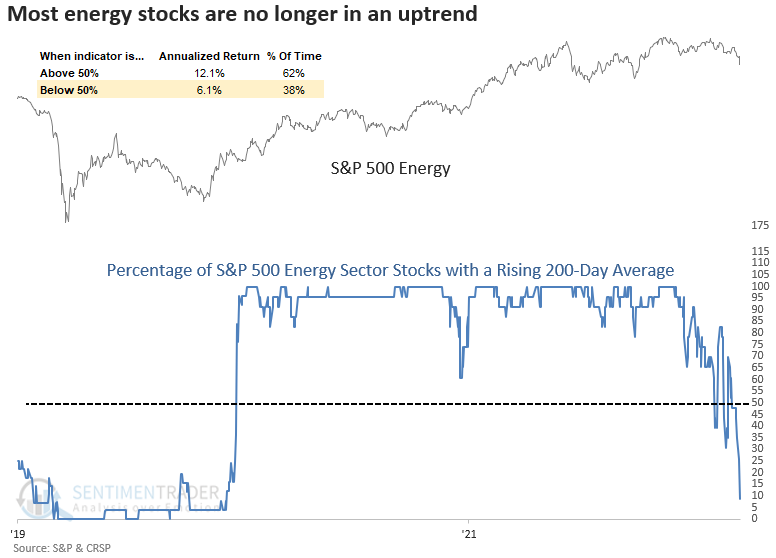
A more comprehensive composite breadth measure is also quite negative, declining to the lowest value since the Covid crash in March 2020. Composite readings below 0% suggest negative annualized returns.
The energy sector struggles when the indicator falls below -25%, especially over the next two to three months. Also, for most of 2021 and 2022, the backdrop for buying oversold conditions in energy stocks was ideal as a high level of issues maintained a rising 200-day average. That's not the case now.
About TradingEdge Weekly...
The goal of TradingEdge Weekly is to summarize some of the research published to SentimenTrader over the past week. Sometimes there is a lot to digest, and this summary highlights the highest conviction or most compelling ideas we discussed. This is NOT the published research; rather, it pulls out some of the most relevant parts. It includes links to the published research for convenience, and if you don't subscribe to those products, it will present the options for access.