
TradingEdge Weekly for Mar 14 - Washout signs, staples surge, international intrigue

Key points:
- A washout signal triggered during the selloff
- The Nasdaq suffered its worst loss in a year
- Insiders are starting to nibble
- Half of technology and discretionary stocks fell into a bear market
- Consumer staples have stormed back relative to discretionary stocks
- Seasonal forces show a brief reprieve for discretionary
- It might finally be time for international stocks
- Gold shows signs of outperforming stocks
Washout signal
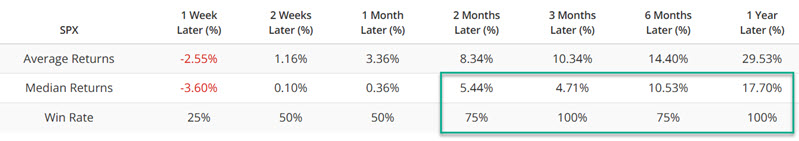
A component in the Composite Washout Model triggered a bullish divergence alert. Dean showed that similar precedents suggest the S&P 500 could bounce over the subsequent two weeks.
Despite the lack of a broad oversold condition, one TCTM Composite Washout Model member triggered an alert. This model detects divergences in the percentage of S&P 500 stocks classified as oversold based on a 14-day stochastic indicator, which functions like a range rank. Stochastic readings below 20% indicate oversold conditions.
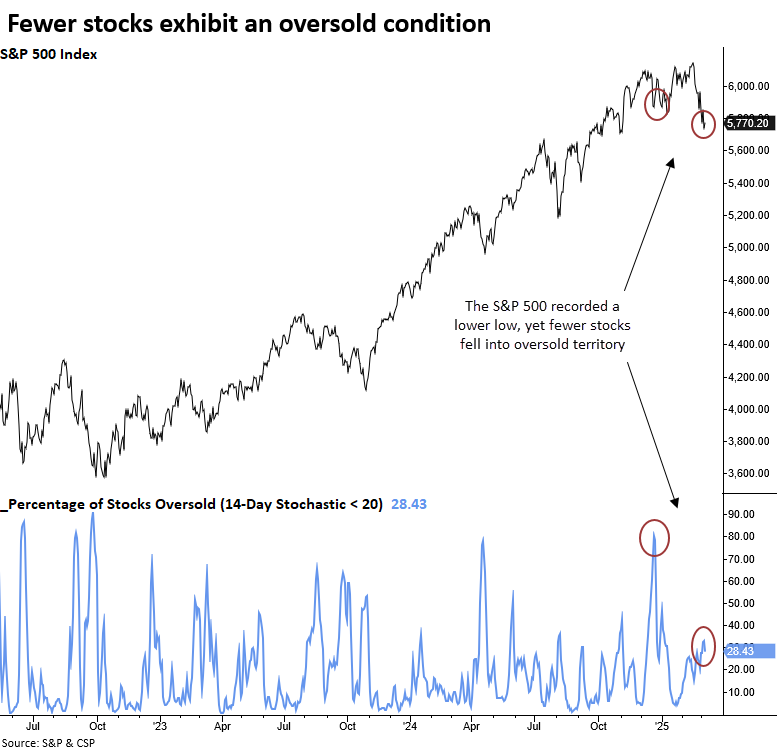
An oversold divergence signal has occurred 55 other times since 1930. Following similar precedents, the S&P 500 exhibited a solid tendency to rally, particularly over the following month, with statistically significant returns compared to random performance.
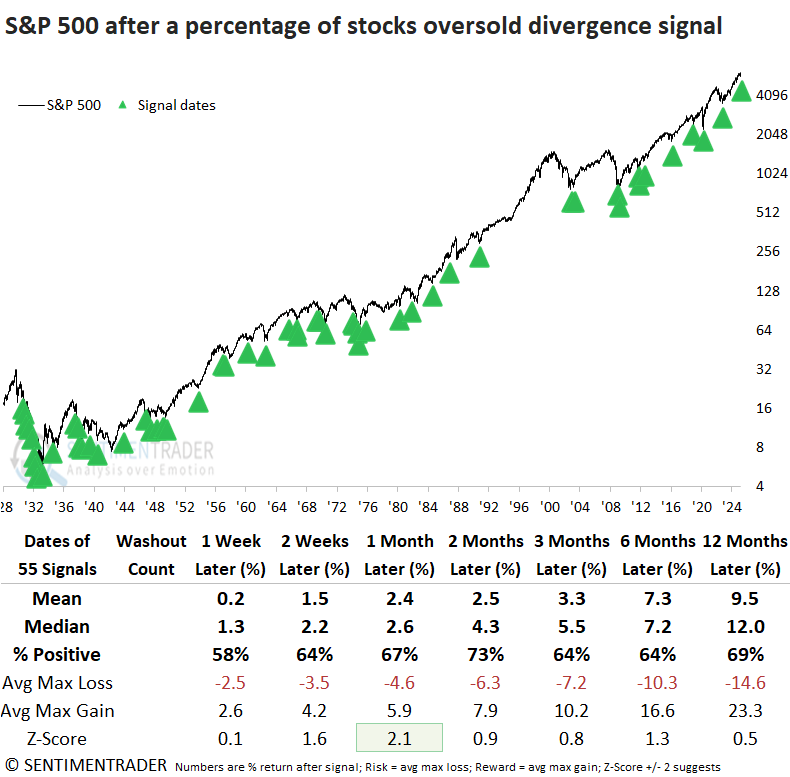
Oversold divergence signals usually appear at the depths of significant growth scares or bear markets. The only times in history when the signal count resided at 10%, like now, were 1943 and 1949. Although rare, oversold divergence signals that occurred within 10% of a multi-year high, like now, bounced 100% of the time over the subsequent two weeks. However, of the six precedents, four resulted in lower lows, with 1969 and 2018 exhibiting substantial further declines.
Big dipper
The Composite suffered its largest loss in over a year on Monday. This is moderately removed from its last multi-year high a few months ago.
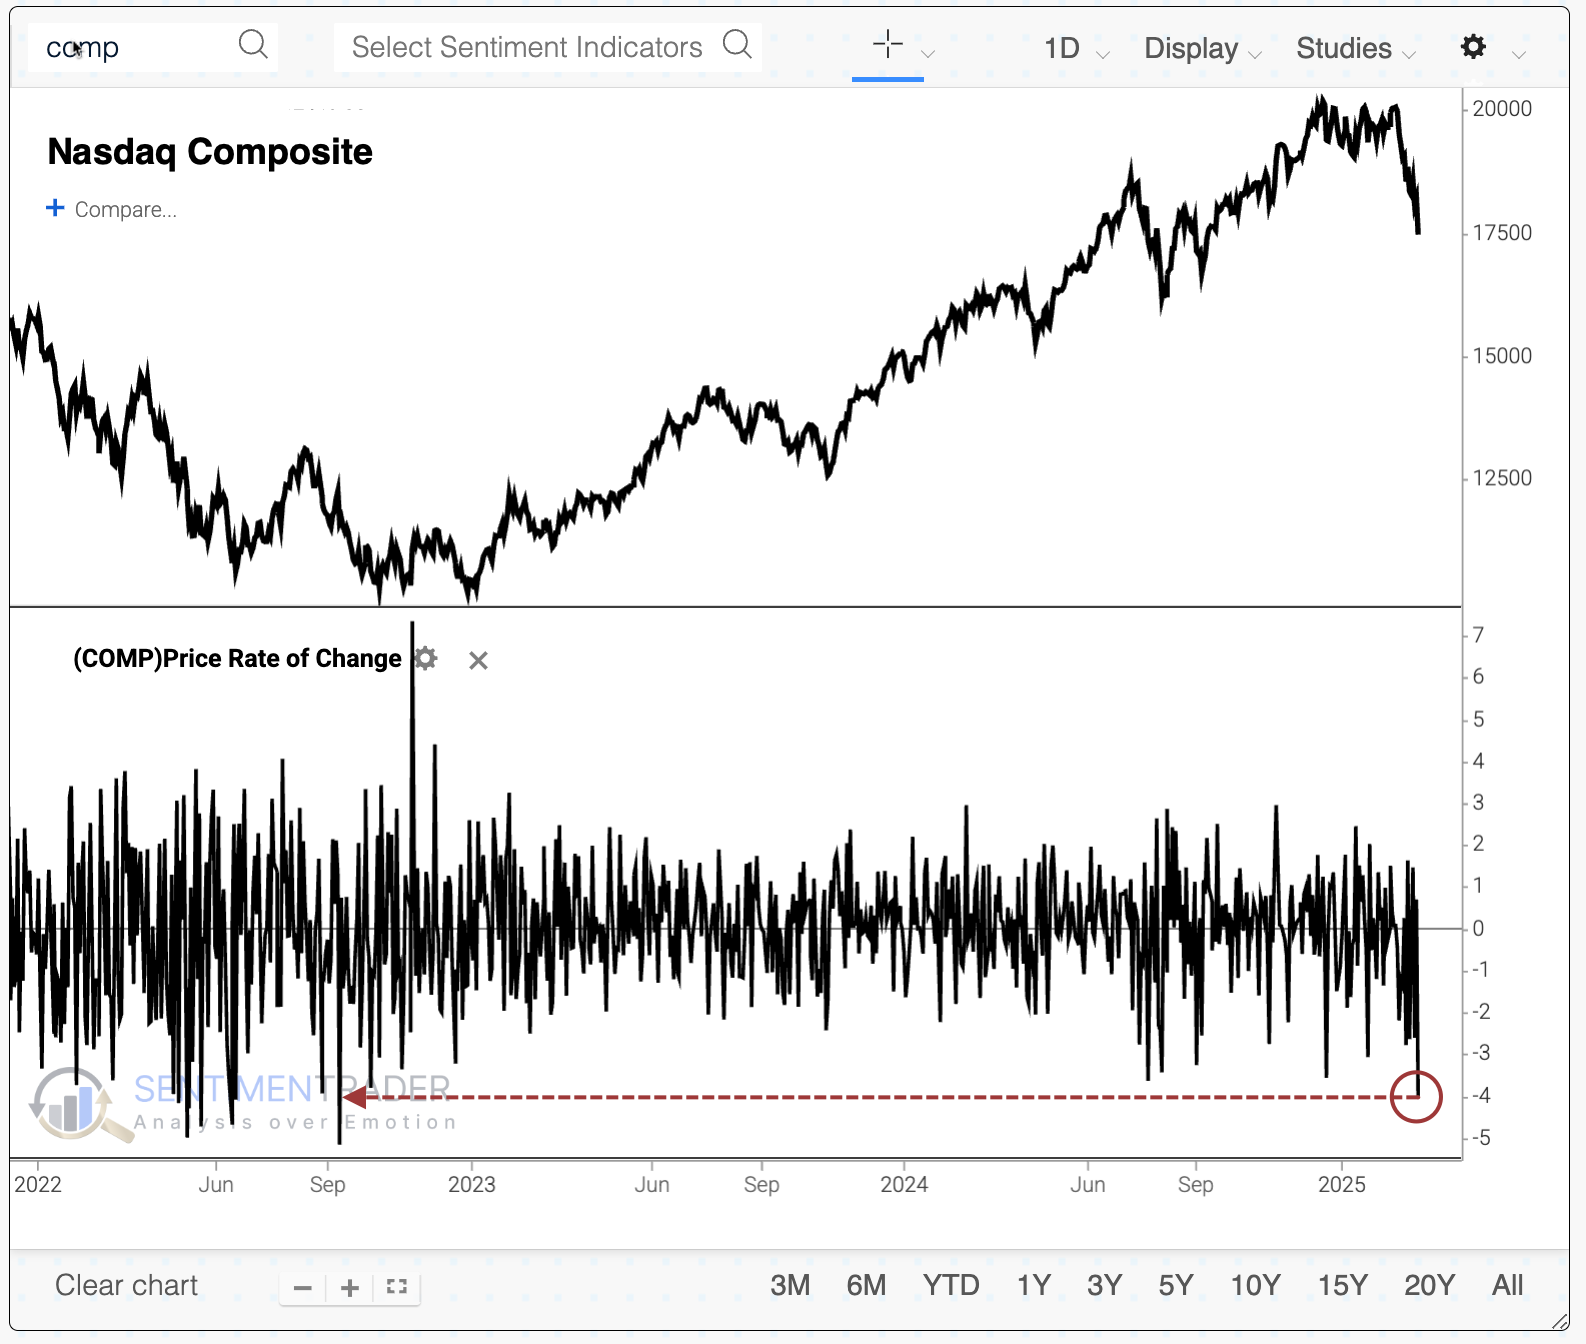
Similar large losses, when removed from the last high within the past several months, have tended to precede more short-term losses but fewer longer-term ones.
Adding more context to the move in the Nasdaq, its largest loss in a year occurred when the index was still above a rising 200-day moving average, but severe enough to push it down to a 3-month low.
These types of selling days tended to cluster somewhat (1987, 2011, 2015, 2018, 2020). Other than that a signal in 1987, the Nasdaq managed to show a positive return either three or six months later each time.
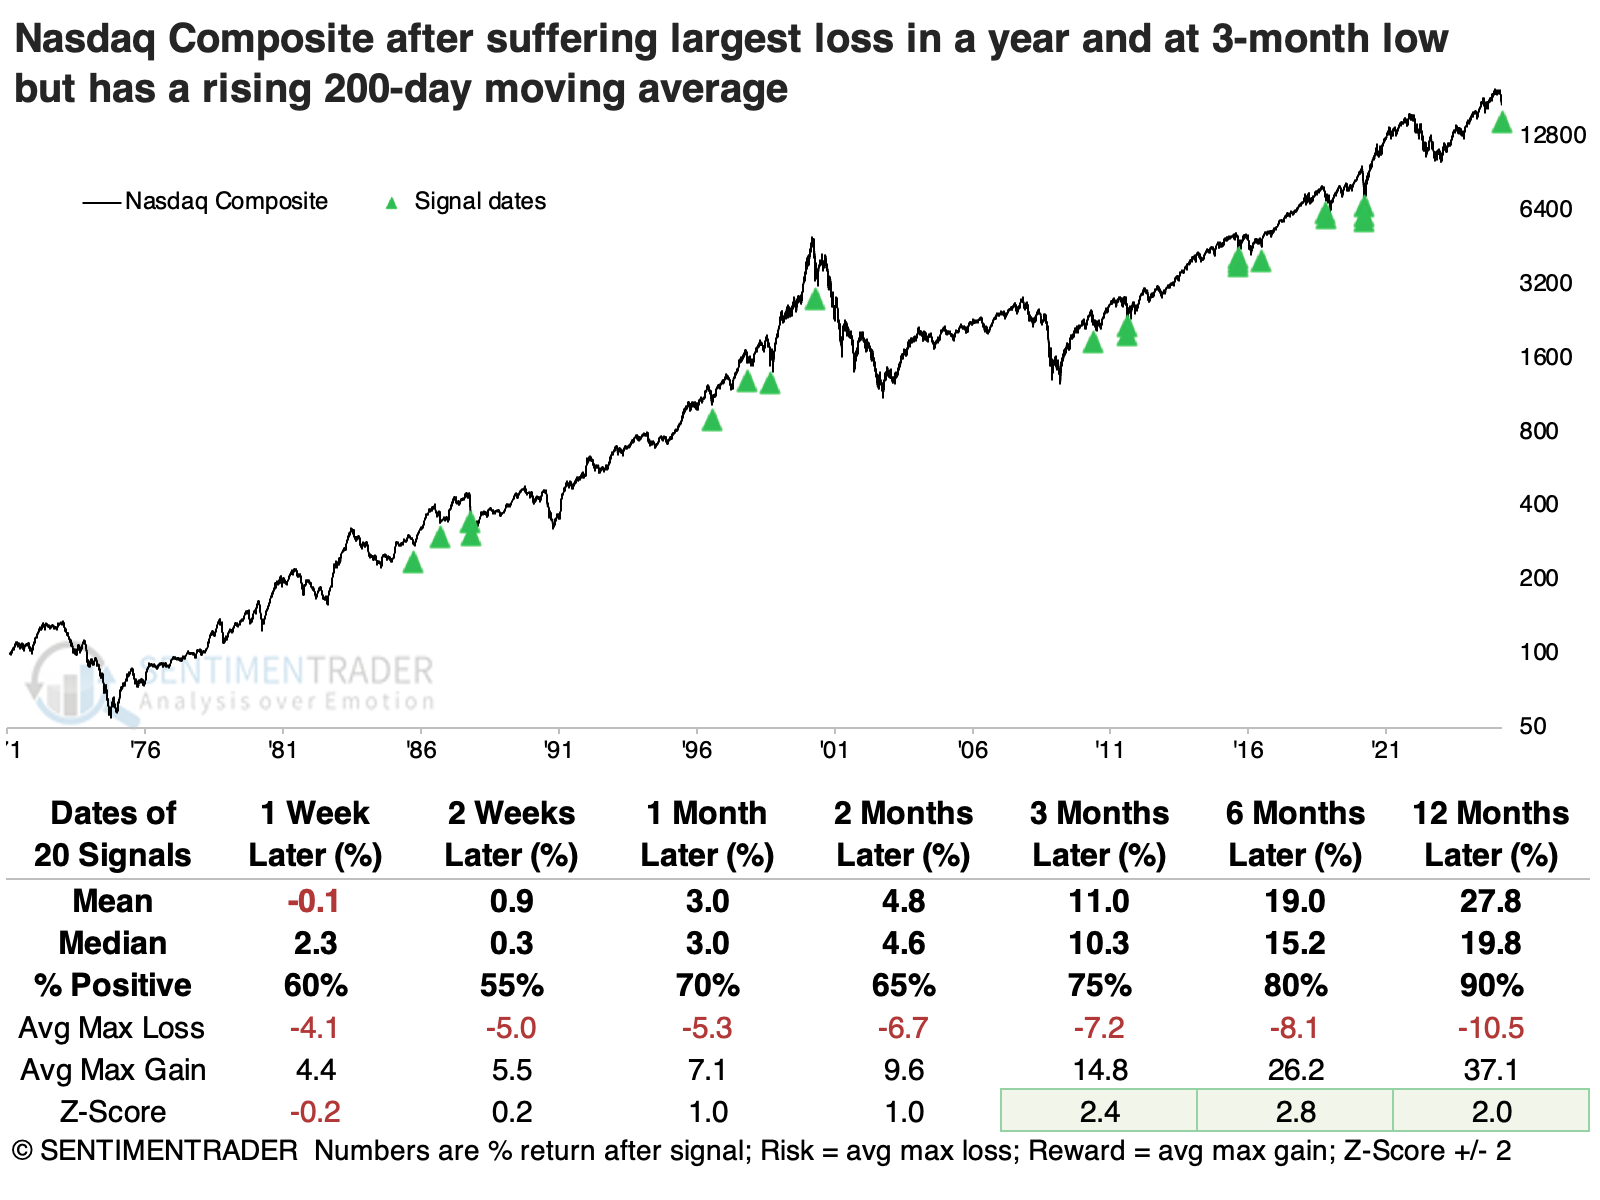
The S&P 500 showed an excellent tendency to rebound over 3-12 months, except for that signal before Black Monday. Over the following year, it managed a higher median return than the Nasdaq, with less risk and almost as much reward.
As we've seen with so many studies in recent weeks and months, these signals tended to favor defensive factors over more cyclically aligned ones. The defensive factor showed the highest one-year returns and significantly more consistency in positive returns.
Insiders start to nibble
Our Corporate Insider Velocity indicator is designed to identify shifts in insider activity. Jay showed that there have been several recent developments in the S&P 500 and the technology and utility sectors.
The Sentimentrader Corporate Insider Velocity indicator shows the velocity of corporate insider buying versus selling. It takes the 4-week rate of change for insider buys and subtracts the 4-week rate of change for insider sales.
The chart below shows our Corporate Insider Velocity indicator, which looks at open market transactions by corporate insiders of the S&P 500 component stocks. The red dots highlight those rare occasions when the indicator value crossed above 30. The most recent signal occurred on 2025-03-10.
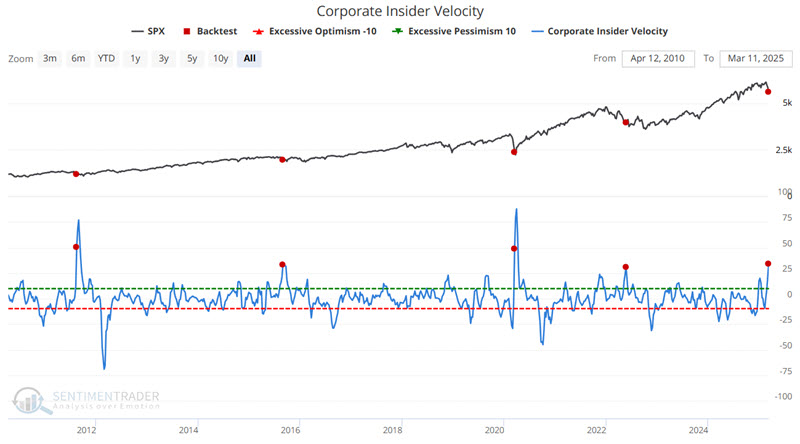
With the minuscule sample sizes in mind, the results are compelling and suggest that investors at least remain open to the bullish case despite recent market weakness.
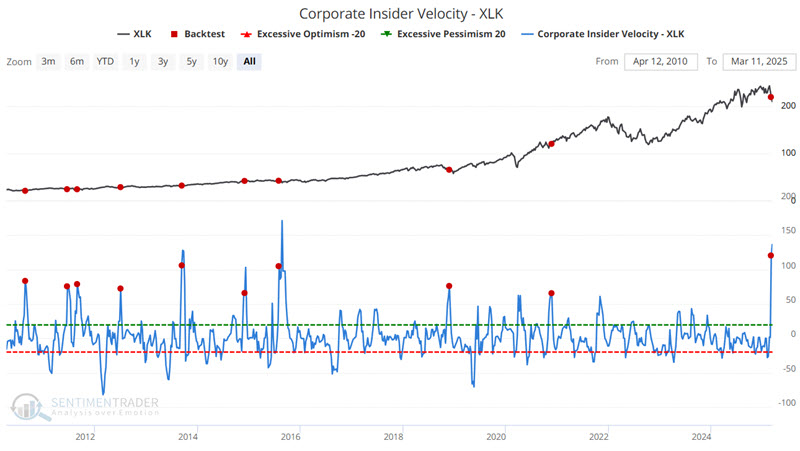
Jay also showed spikes in the ratio in a couple of sectors, like technology. The chart below highlights when the Corporate Insider Velocity - XLK indicator crossed above 65. Note that some signals were early. The most recent signal occurred on 2025-03-03.
Tech and discretionary bear markets
Half of Technology and Consumer Discretionary stocks have entered a bear market. Dean noted that similar precedents near a high suggest the S&P 500 could struggle over the subsequent six months.
S&P 500 Technology and Consumer Discretionary, two critical growth-oriented sectors, now show 50% or more of their respective stocks in a bear market. Considering the S&P 500 is only 13 sessions from an all-time high, this is an alarming scenario.
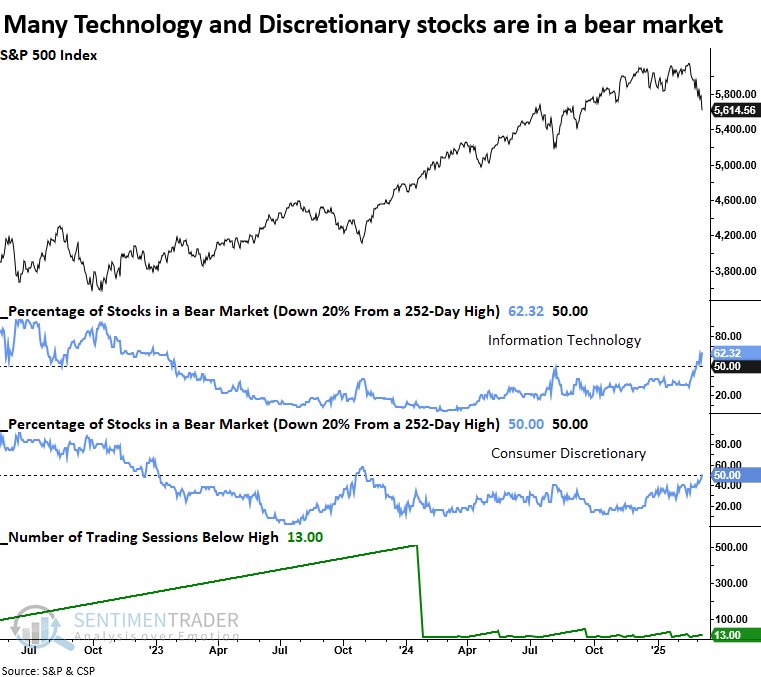
When 50% or more of stocks in the Technology and Consumer Discretionary sectors closed in bear market territory with the S&P 500 within 30 sessions or fewer of a multi-year high, the world's most benchmarked index exhibited unfavorable win rates and returns over the following six months.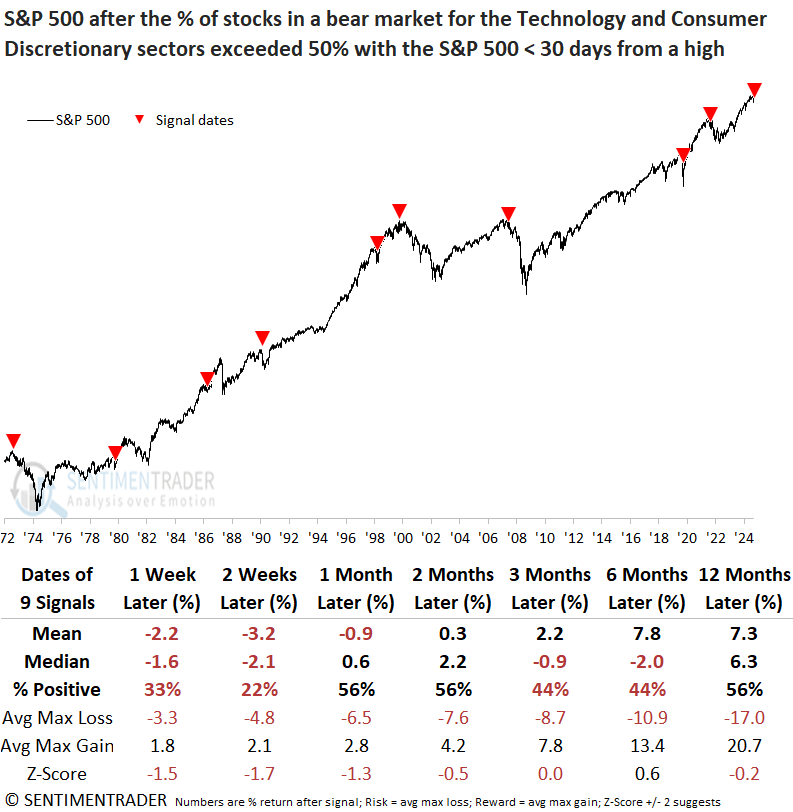
Technology and Consumer Discretionary lagged the S&P 500 in five out of seven horizons, with the bulk of the relative weakness concentrated in the first three months.
Staples storm back
There has been ample evidence of a shift in investors' preferences over weeks, even months.
The shift has been dramatic enough to push the ratio of consumer staples stocks to consumer discretionary from a multi-year low to a multi-month high, continuing the rotation we witnessed at the end of January.
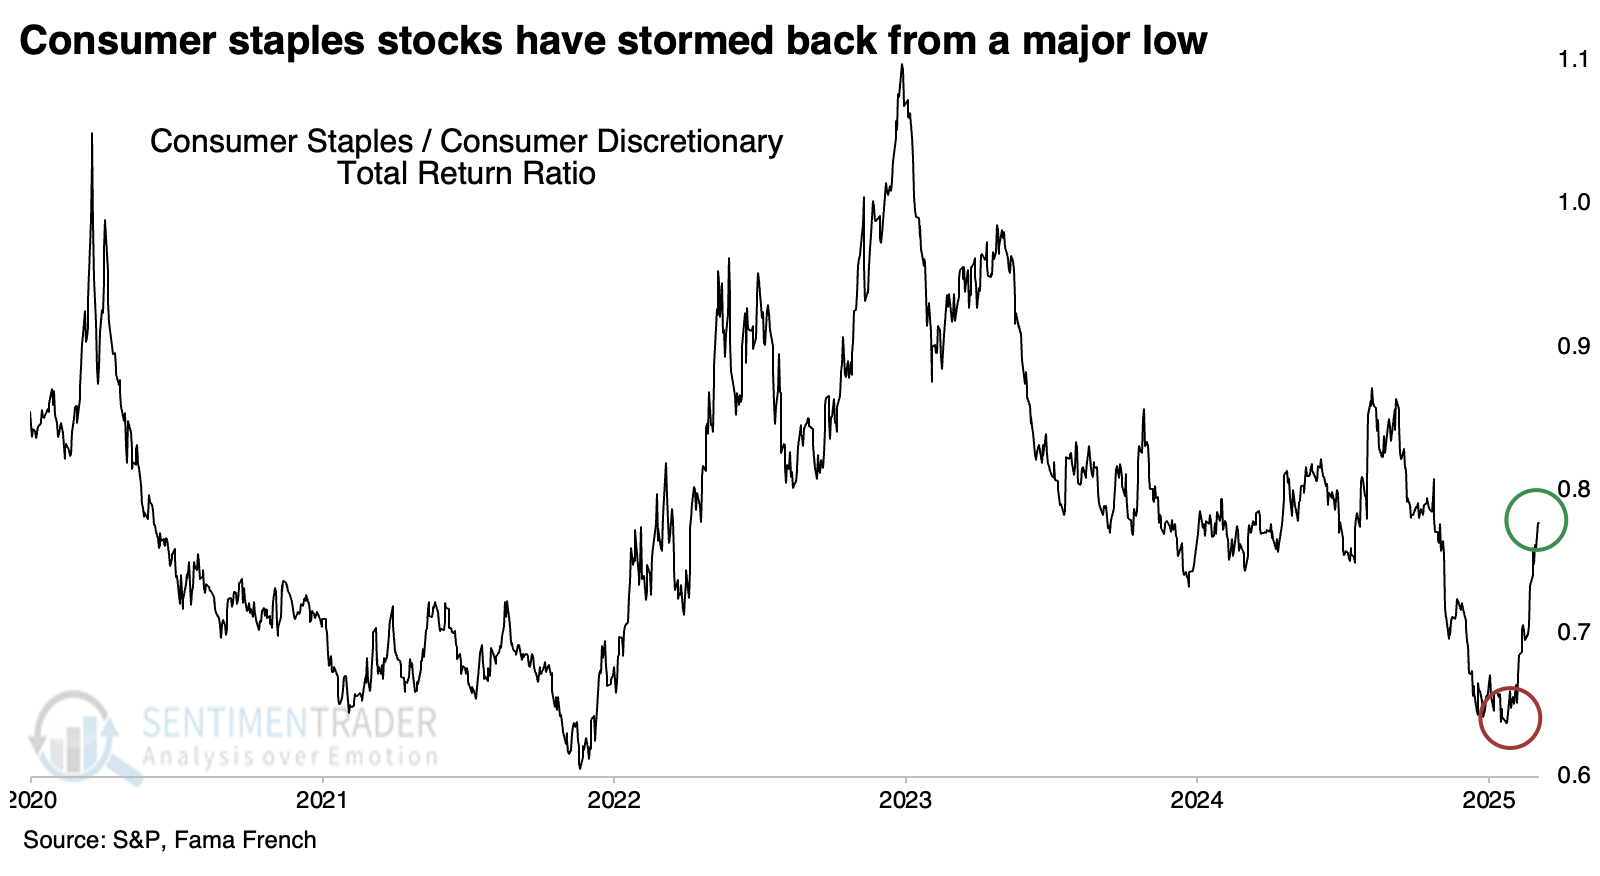
Market watchers like to use the ratio between staples and discretionary stocks as a risk-on/risk-off metric, which serves that purpose well. During bull markets, the ratio tends to trend lower, and during bear markets, it tends to rise.
When investors suddenly switched to a preference for staples over discretionary, the S&P 500 struggled over the following six months. However, these were good signs for positive absolute returns for consumer staples over the next few months. While they often suffered some backing-and-filling during the next few weeks, those were almost all buying opportunities, with only three modest losses three months later.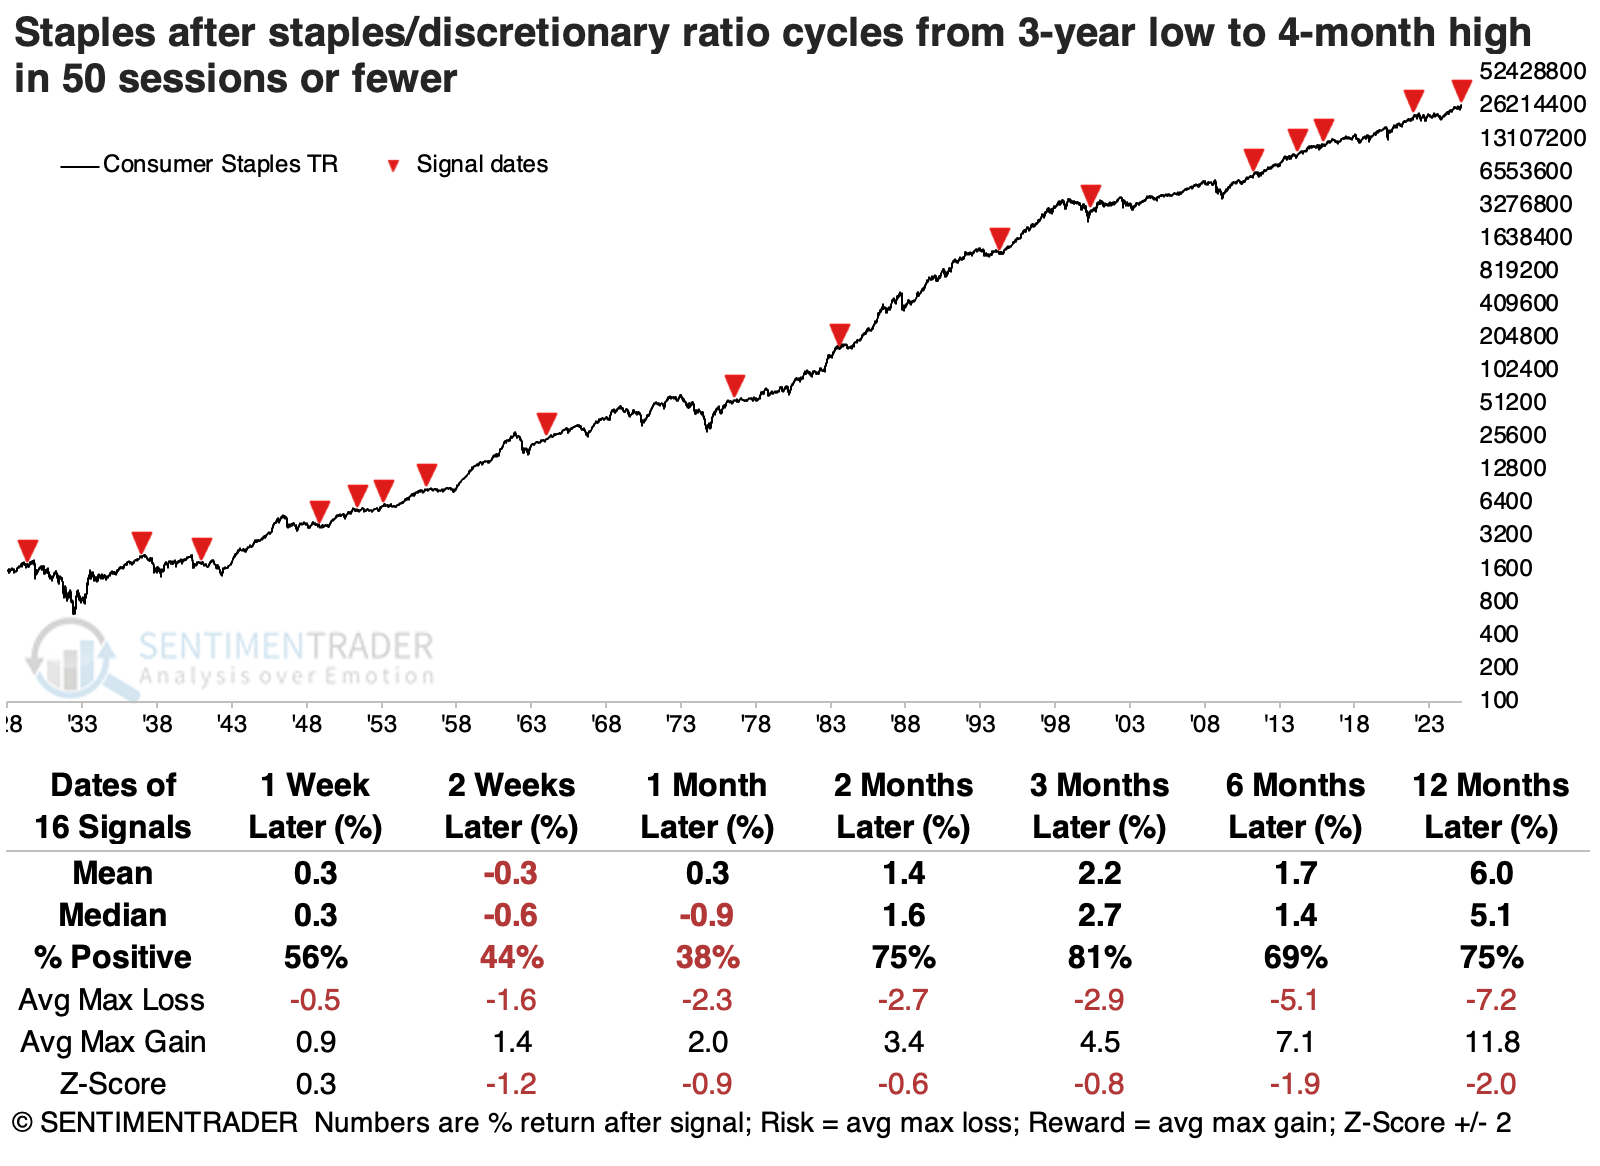
Discretionary stocks had a tougher time. They suffered more over short time frames and, even six months later, showed a negative average return. More troubling, average risk was greater than average reward.
A seasonal reprieve for discretionary
Jay noted that one of the few positives for discretionary stocks is that they are entering the most favorable seasonal period of the year.
The chart below displays the annual seasonal trend for the S&P 500 Consumer Discretionary sector. The Trading Day of Year #46 through TDY #81 period tends to show price strength. For 2025, this period extends from the close on 2025-03-11 through the close on 2025-04-30.
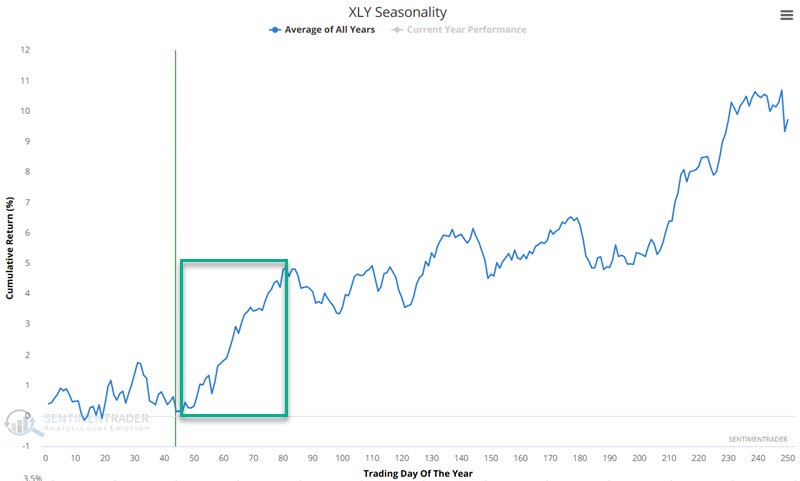
The chart below displays the hypothetical growth of $1 invested in the S&P 500 Consumer Discretionary sector only during the TDY #46 to TDY #81 period every year since 1953.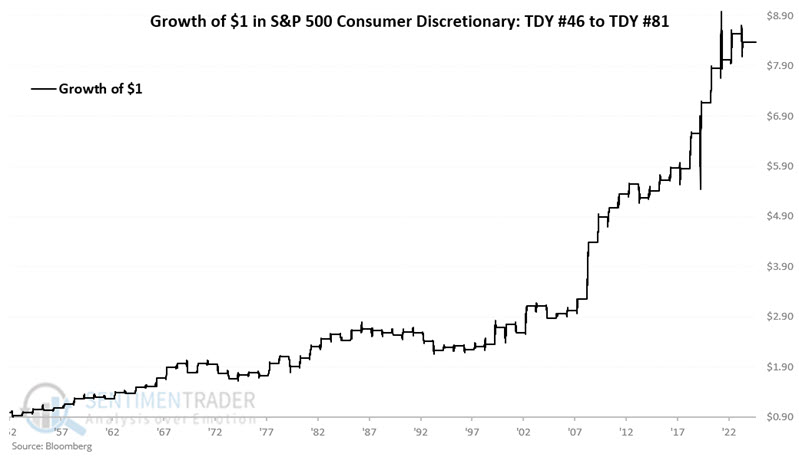
The 67% Win Rate reminds us this is no sure thing. However, the fact that 8%+ moves skew positive by a ratio of 10-to-2 reminds us of the potential for significant - and relatively quick - profits, particularly if this sector comes off an oversold condition.
Also, corporate insider buying in the discretionary sector has been relatively muted. However, our Corporate Insider Velocity - XLY indicator recently crossed a noteworthy level. The chart below highlights the rare occasions when the Corporate Insider Velocity-XLY indicator crossed above -40 for the first time in three months. While the sample size is admittedly tiny, the six-month and especially the one-year results have been noteworthy (12-month 100% Win Rate and median return of just over 30%).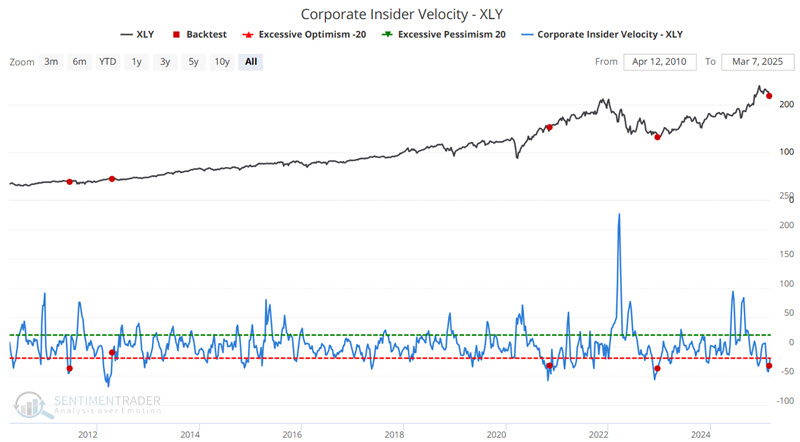
Finally the time for international stocks?
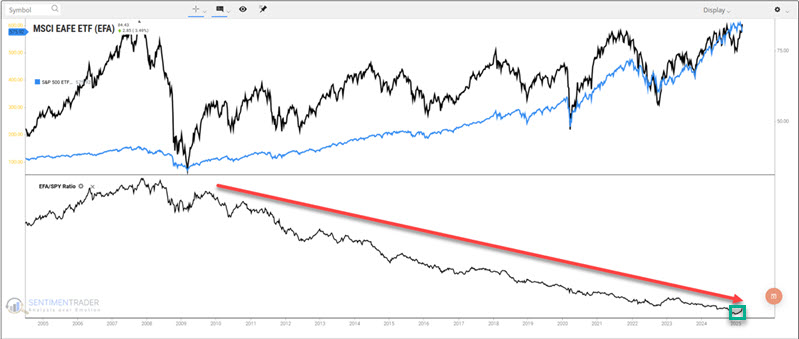
International stocks in general - and ticker EFA specifically - seriously lagged behind U.S. stocks for well over a decade. However, Jay noted that EFA has shown significant absolute and relative strength in 2025.
As shown in the chart below, international stocks (represented by iShares MSCI EAFE ETF - ticker EFA) have significantly outperformed U.S. stocks so far in 2025. If we zoom out a bit, this recent reversal of fortune in favor of international stocks barely registers.
The chart below displays the annual seasonal trend for iShares MSCI EAFE ETF (ticker EFA), a broad-based international ETF.
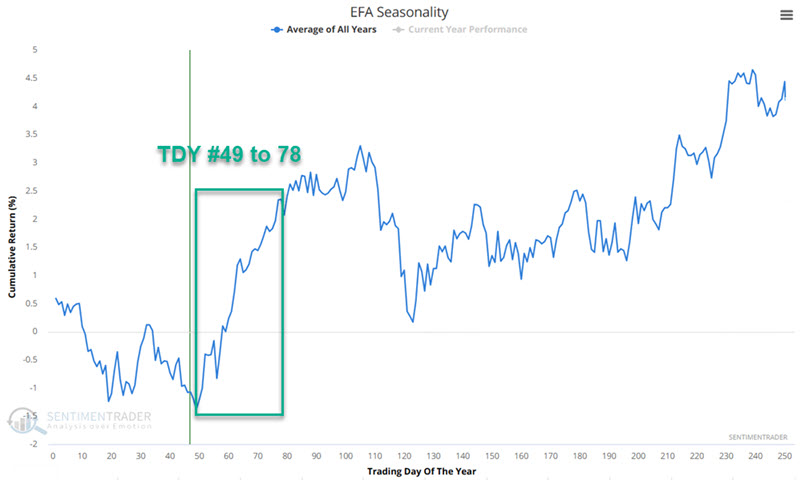
The good news is that EFA is about to enter a favorable seasonal period extending from the close on Trading Day of the Year #49 through TDY #78. Since 2001, $1 invested during these windows turned into $2.54 with 87% of years showing a positive return and ten gains of more than +5% and no losses larger than -5%. For 2025, this period extends from the close of 2025-03-14 through 2025-04-25.
Finally, on more of an anticipatory note, Trend Strength and Relative Trend Strength for EFA have both picked up notably during the recent advance. If these measures reach the 8 to 10 range, it would argue strongly for a continued advance.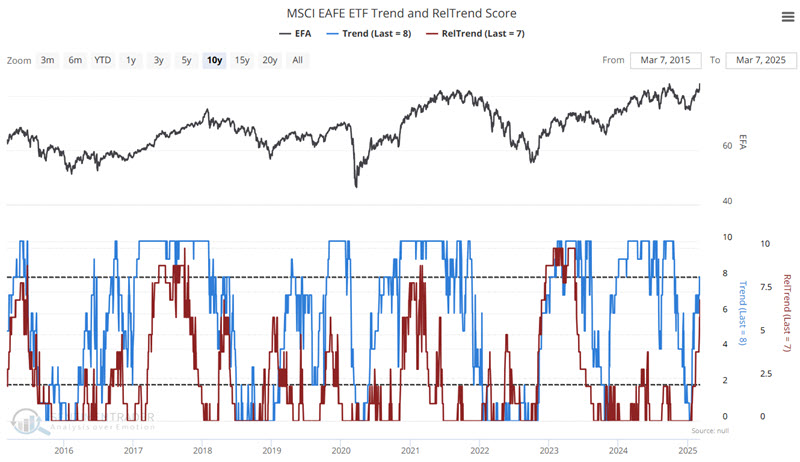
Gold's time to shine
Stocks and gold have been strong performers in recent years. Jay showed that according to one historical measure, gold may be taking a more decisive leadership role.
The chart below displays the ratio of gold divided by SPX each week (black line) and a 200-week exponential moving average of the ratio (blue line). When the black line is above the blue line, we state that gold is outperforming.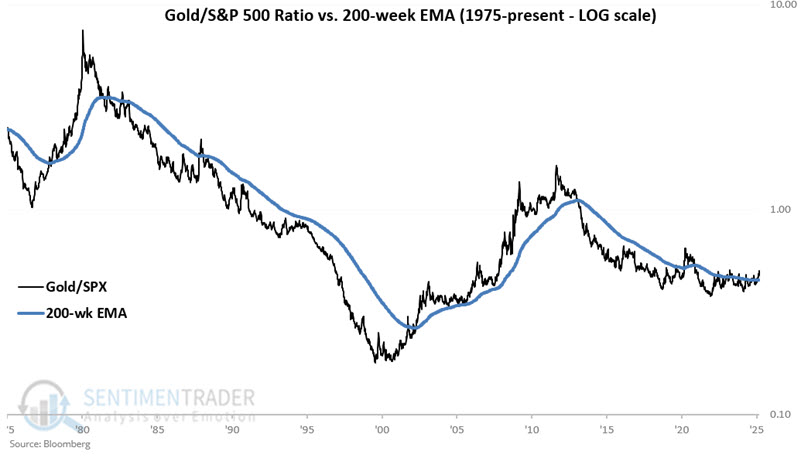
It can be pretty apparent whether gold is outperforming or underperforming for long periods. At other times - especially recently - there can be whipsaws.
The chart below displays the hypothetical growth of $1 invested in gold only if the Gold/SPX ratio closed the previous week above its 200-week EMA. From 1976-12-30 through 2025-03-07, $1 grew to $17.87.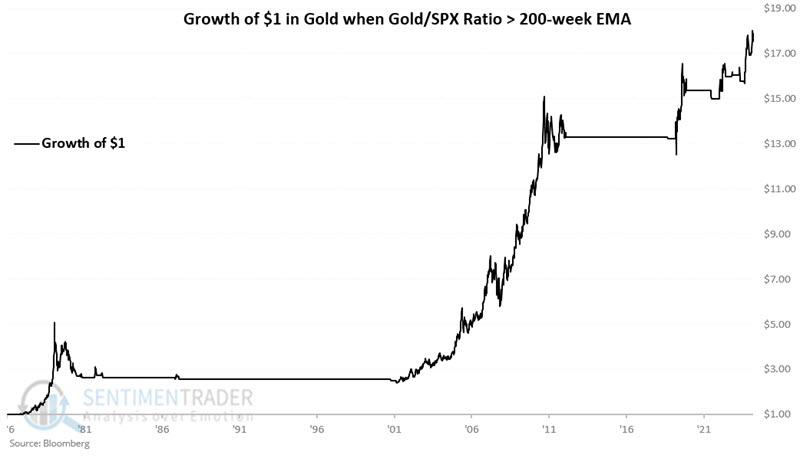
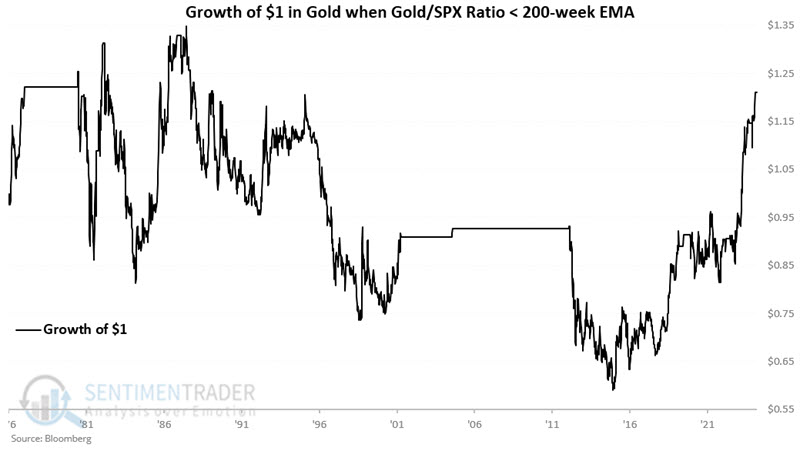
The chart below displays the hypothetical growth of $1 invested in gold only if the Gold/SPX ratio closed the previous week below its 200-week EMA. From 1976-12-30 through 2025-03-07, $1 grew to $1.21. So, these are not necessarily bearish results but are far less favorable and consistent than those shown above.
About TradingEdge Weekly...
The goal of TradingEdge Weekly is to summarize some of the research published to SentimenTrader over the past week. Sometimes there is a lot to digest, and this summary highlights the highest conviction or most compelling ideas we discussed. This is NOT the published research; rather, it pulls out some of the most relevant parts. It includes links to the published research for convenience, and if you don't subscribe to those products, it will present the options for access.