
TradingEdge Weekly for Jun 17 - A historic bout of selling in stocks and bonds

Key points:
- Stocks suffered a historic bout of selling pressure entering this week
- It got even worse, and over a 7-day stretch, the S&P's internal damage was the worst-ever
- The selling pushed almost all stocks into short-, medium-, and long-term downtrends
- More than 90% of tech stocks have fallen into bear markets
- High-yield bonds saw some of their worst selling in 17 years
- Much of this can be blamed on the Fed and "three steps and a stumble"
- Inflation may get a reprieve if some commodities follow through on seasonal trends
A historic bout of selling pressure
The selling pressure on Monday was historically severe. Over a three-day stretch, stocks suffered one of the most overwhelming bouts of selling in 90 years.
With the overnight selling pressure on Monday, the S&P 500 futures were down big at the open and never got closer than 1.5% from its previous close. That happened on Friday, too.
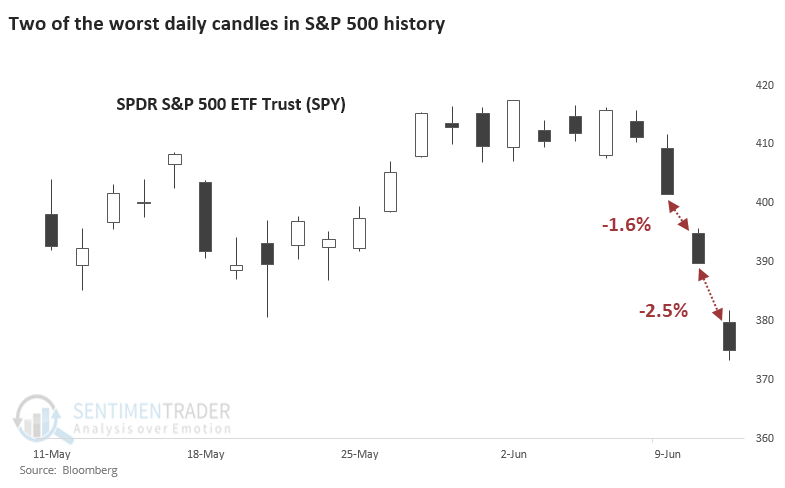
Remarkably, this has only happened three other times since the inception of the S&P 500 futures contract in 1982, all preceding double-digits gains in the months ahead.
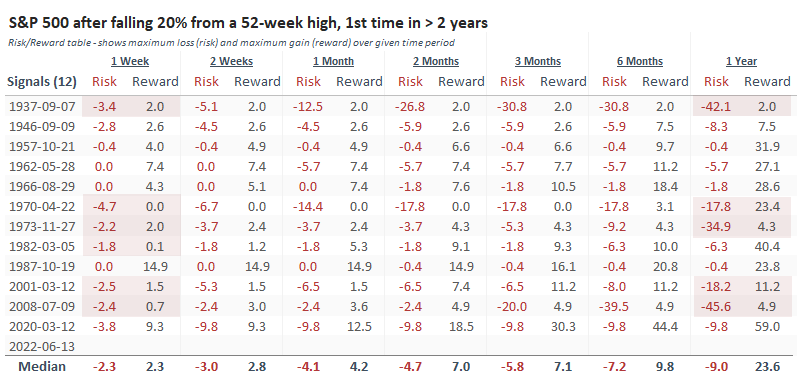
The decline pushed the S&P 500 below the widely-watched 20% drawdown level, a media event that nobody can ignore. There have been many other 20% drawdowns and most recovered quickly. When we look at the Risk/Reward Table, there was a pretty clear pattern. When the S&P fell into a bear market, and buyers showed no interest, it led to the worst long-term returns.
The red highlights in the table show the dates with the worst risk/reward skew over the next week and the next year. There is a lot of overlap between the two, with the only exception being 1982.
The selling pressure wasn't just in the large-cap stocks in the S&P; it was widespread and vicious. The Backtest Engine shows that only 16 other days since 1962 saw such overwhelming selling pressure, after which the S&P 500 rose 14 times.
Even more remarkably, the 3-day average of NYSE Up Volume dropped below 7% for only the 2nd time in 60 years.
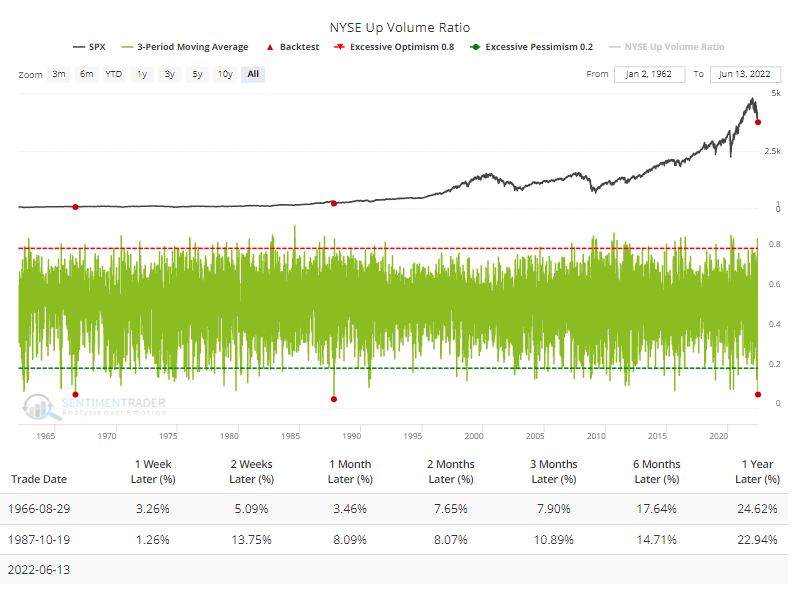
For what it's worth, the S&P rebounded immediately, tested the low, then put in a sustained bottom.
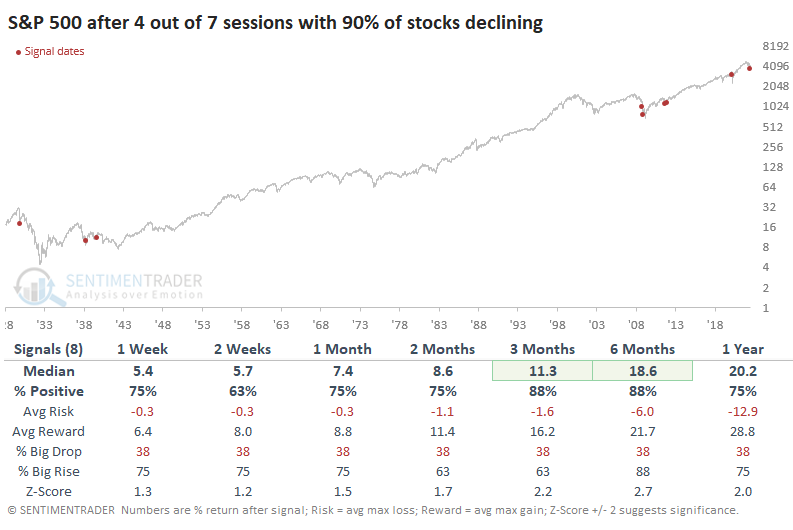
Then it got worse later in the week. The S&P index went to 500 stocks in 1957 and included fewer stocks in the decades prior. In re-creating history, there has never been a rougher 7-day stretch than what the index has suffered leading into Friday's session.
In the past seven sessions, more than 90% of stocks in the index have declined on five days. Since 1928, that has never happened before.
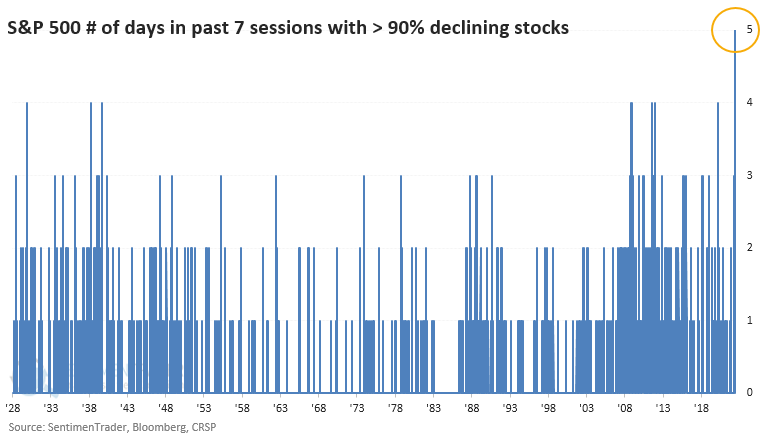
There have been a handful of times when there was a majority of days with more than 90% declining stocks, clustered in the 1930s and post-financial crisis eras. Forward returns were very volatile after these signals, but all preceded a higher price in the S&P 500 6 or 12 months later.
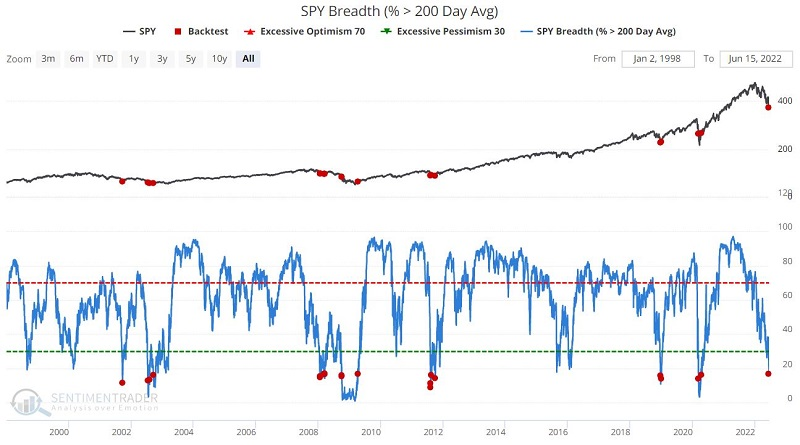
Jay also showed some carnage in the S&P 500. This shows the percentage of stocks in the named exchange-traded fund (ETF) that are currently trading above their 200-day moving average. Extreme readings often mark exhaustion for a particular price move - but not always.
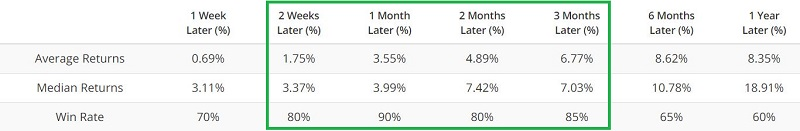
The chart below displays those times when the SPY Breadth (% > 200 Day Avg) indicator dropped below 17% for the first time in 6 months. The table shows a summary of SPY performance following a signal.
Almost all of tech is in a bear market
Dean noted that 90% of S&P 500 Technology stocks are down 20% or more from a 252-day high. After similar signals, the technology sector showed positive returns across all time frames.
For only the second time in more than a decade, the number of Technology stocks in a bear market exceeded 90%. Several cases like 2007-08, 2000-02, 1973-74, and 1968-70 maintained a high level of stocks in a bear market for a significant amount of time, especially 2000-02.
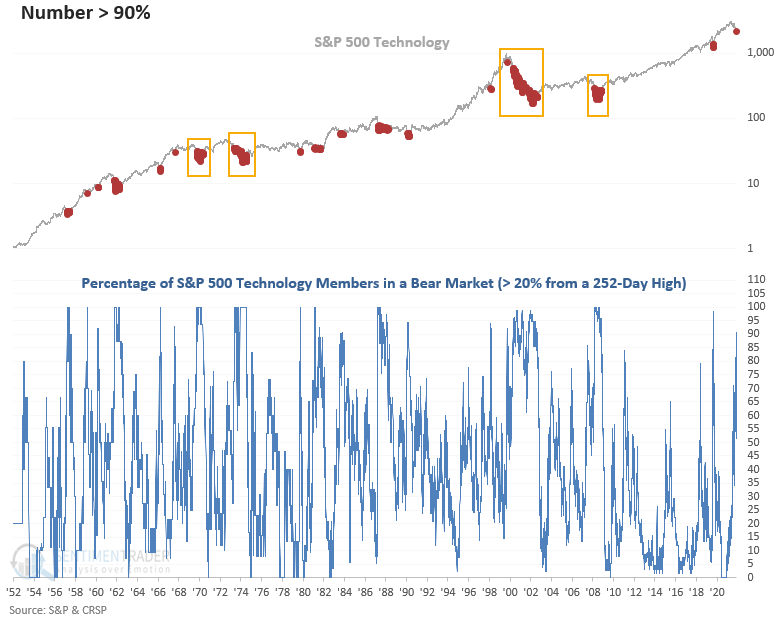
This study generated a signal 16 other times over the past 65 years. After the others, S&P 500 Technology's future returns, win rates, and risk/reward profiles look favorable, especially in the 2 & 3-month time frames. While the 1-year window shows a solid return and hit rate, the z-score is uninspiring.
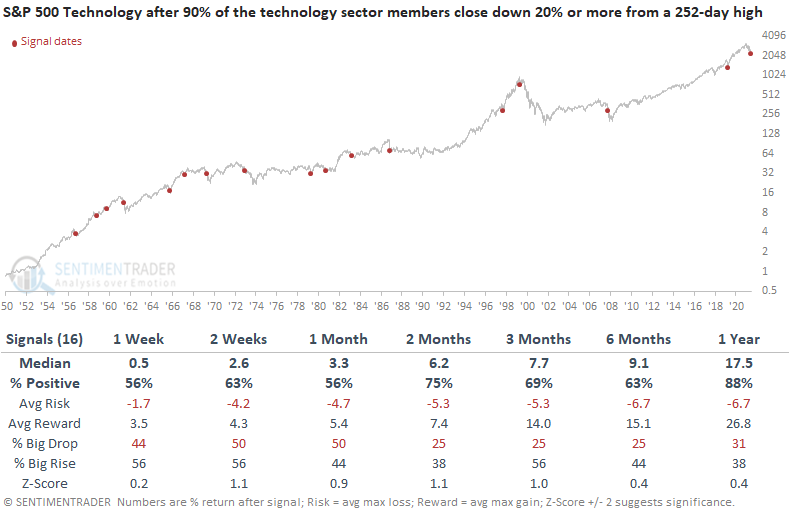
When I compare technology to the S&P 500, the tech sector tends to struggle in the 2-4 week time frames. However, more recent signals look better. The 3 and 6-month windows offer the best relative performance, with outperformance at some point in 12 out 16 instances.
High-yield bonds got hit, too
The market carnage over the past week hasn't been limited to stocks. Bonds have also been hammered, especially those most geared to economic performance.
Like we saw in stocks, investors dumped pretty much all bonds, particularly of the high-yield variety. In a remarkable fit of selling pressure, more than 80% of high-yield bonds declined on Monday. That's the most lopsided bout of selling in 17 years next to March 9, 2020.
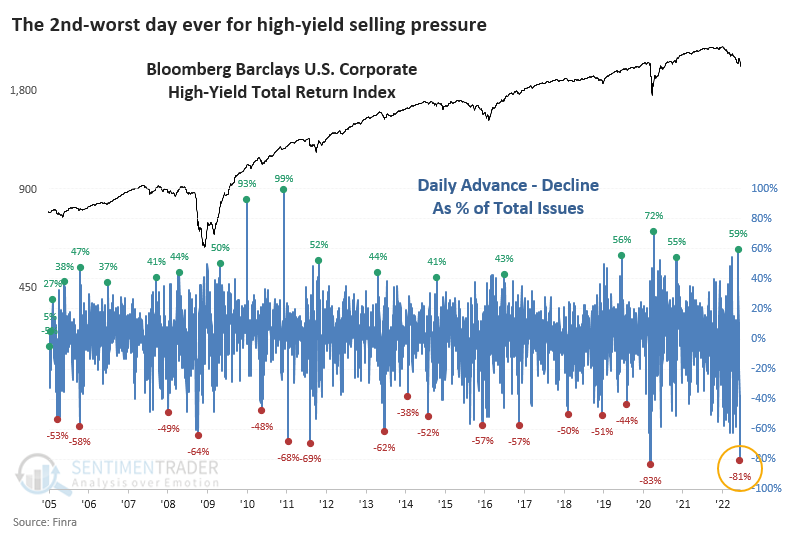
The overwhelming selling pressure knocked even more of the bonds to a 52-week low. A net of more than 70% of high-yield issues fell to a new low, the 3rd-worst reading since 2005. When we combine the two figures, it's clear that we're in rare territory in terms of how eager and how broadly investors are looking to reduce exposure to this part of the market.
It's also clear that neither bout of panic coincided with the exact low for high-yield.
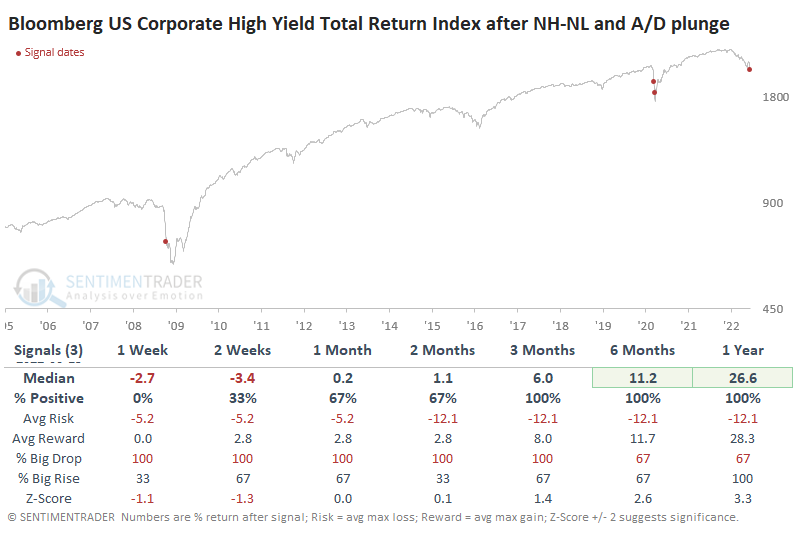
That's clearer when we look at the Risk/Reward Table for the signals. In 2008 and 2020, high-yield bonds declined at least 10% within the next two months, then roared ahead as the market recovered.
All thanks to the Fed
Much of the selling pressure is being blamed on an investor-unfriendly Federal Reserve, which upped its target rate for the 3rd time and by the largest amount since 1994.
Dean assessed the outlook for stocks, commodities, the Macro Index Model, and the yield curve after the FOMC increases the target rate for a third time without intervening in the opposite direction.
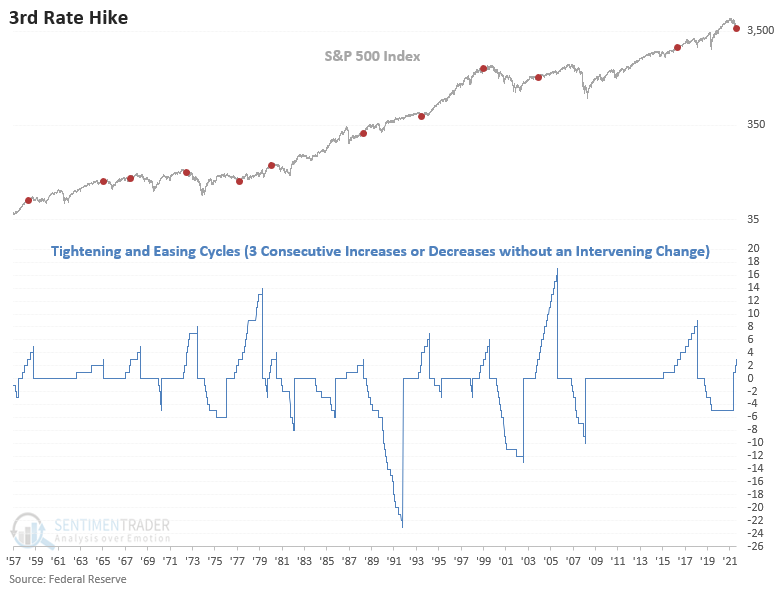
The third increase in the target rate preceded negative to somewhat flat returns with below-average win rates in the first month. While medium to long-term performance is positive, some win rates are less than historical averages. The 1973-80 signals was the last time inflation levels were similar.
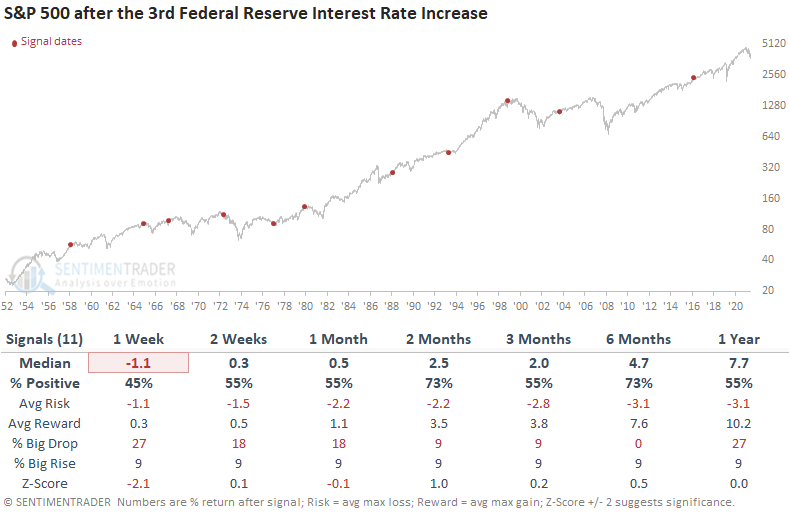
Interest rate-sensitive groups tend to struggle, especially the automobiles and components industry. One should keep a close eye on the financials as they typically provide a vital message concerning credit. Not surprisingly, defensive groups like staples and health care perform better, and commodities tended to perform well.
Oh, Canada!
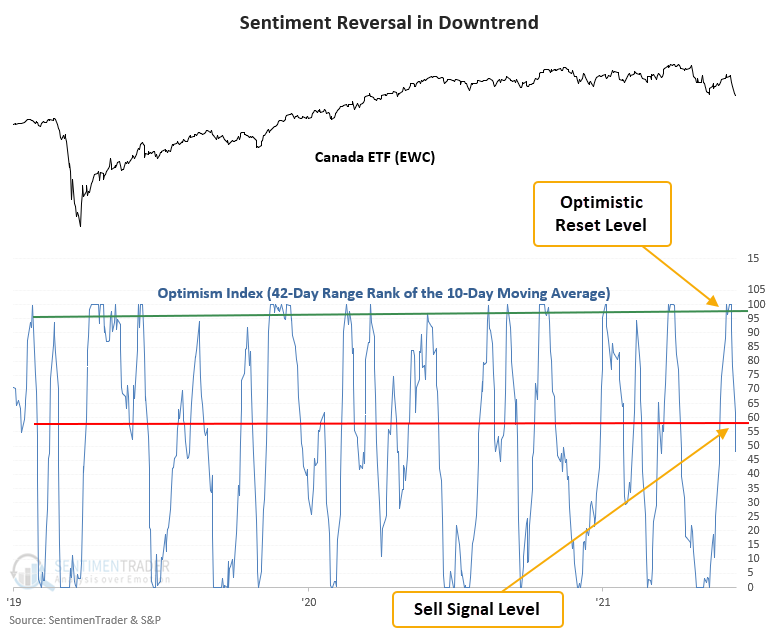
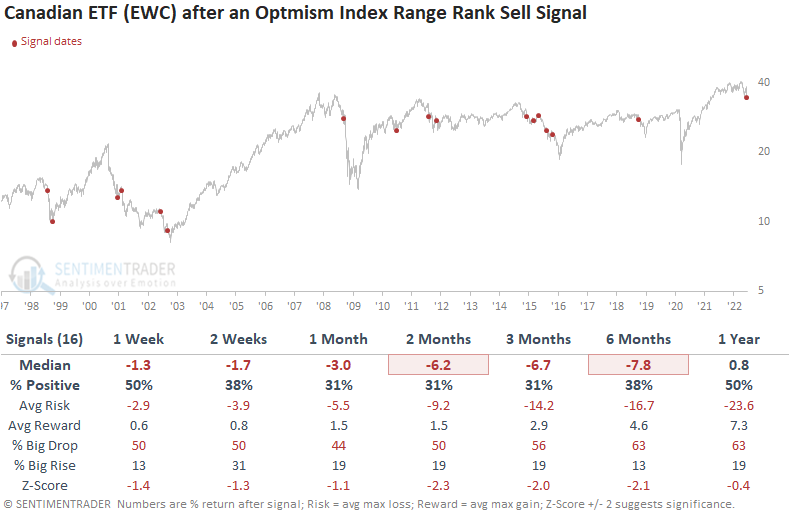
The optimism index for the Canadian ETF (EWC) reversed lower relative to its recent range and the long-term trend for the ETF shows a declining 200-day moving average. Dean noted that Canada has fallen 69% of the time over the next 2 months after other signals.
The model looks for times when sentiment on a market reverses from a high level and momentum in the underlying fund turns negative. That triggered this week in the EWC fund.
This model generated a sell signal 16 times over the past 24 years. After the others, the Canadian ETF's future returns, win rates, and risk/reward profiles look unfavorable across all time frames. The signal shows a negative return at some point in the first 2 months in 14 out of 16 instances.
Seasonal headwinds in corn and gas
Jay looked at sentiment and seasonal trends in corn and natural gas.
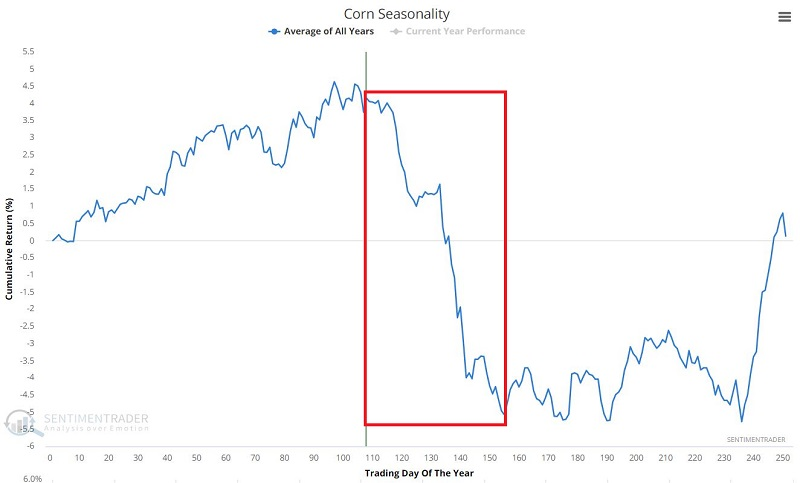
Corn has enjoyed a terrific run in the last two years. In light of high inflation and crop uncertainty around the globe, there is a possibility that prices will continue to run higher. However, seasonality and sentiment suggest that caution may be in order very soon. As you can see in the chart below, corn tends to experience significant weakness between early June and roughly the middle of August.
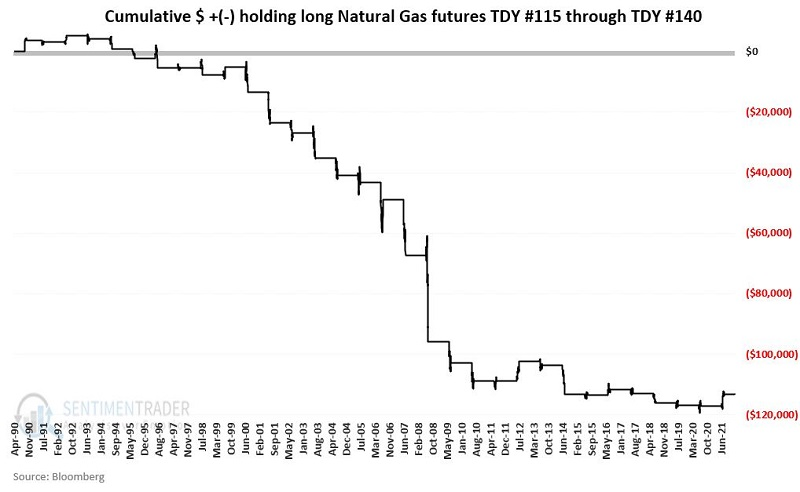
This is another market that has enjoyed a terrific run but which will soon face seasonal resistance. The chart below displays the annual seasonal trend for natural gas futures. The obvious thing to note is the period from TDY #115 through TDY #140. For 2022, this period extends from the close on 6/16 through 7/22.
The chart below displays the $ +(-) from holding a long position in natural gas futures from Trading Day of the Year #115 through TDY #140 since 1990.
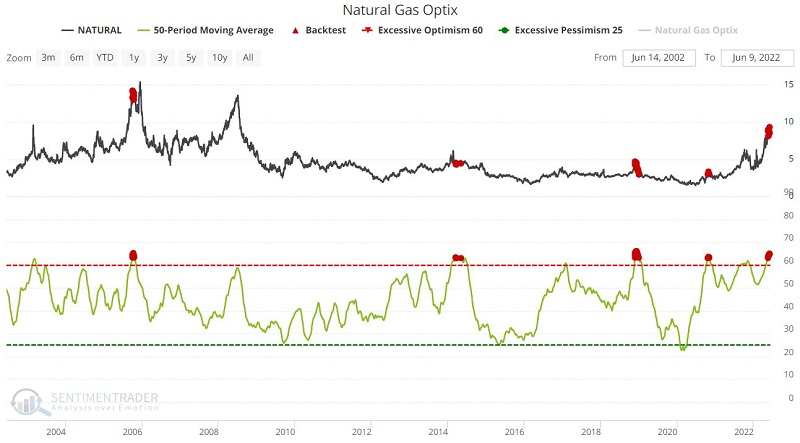
Sentiment is another potential stumbling block for natural gas. The chart and table below highlight those times when the 50-day average of natural gas Optix was above 63. Forward results have tended to be extremely weak.
About TradingEdge Weekly...
The goal of TradingEdge Weekly is to summarize the research published to SentimenTrader over the past week. Sometimes there is a lot to digest and this summary is meant to highlight the highest conviction or most compelling ideas we discussed. This is NOT the full research that's published, rather it pulls out some of the most relevant parts. It includes links to the published research for convenience; if you don't subscribe to those products it will present the options for access.